

Key Insights
The Managed Mobility Services (MMS) market is poised for exceptional expansion, projected to reach USD 6.07 Billion by 2025, demonstrating a robust Compound Annual Growth Rate (CAGR) of 25.41% through 2033. This significant growth is primarily fueled by the escalating adoption of mobile devices across diverse enterprises, necessitating sophisticated management solutions to ensure security, productivity, and compliance. Key drivers include the increasing prevalence of remote and hybrid work models, the burgeoning demand for Bring Your Own Device (BYOD) and Choose Your Own Device (CYOD) policies, and the critical need for enhanced cybersecurity measures to protect sensitive corporate data on mobile endpoints. The market's dynamism is further propelled by continuous technological advancements, such as the integration of Artificial Intelligence (AI) and Machine Learning (ML) in mobility management platforms for predictive analytics and automated threat detection.
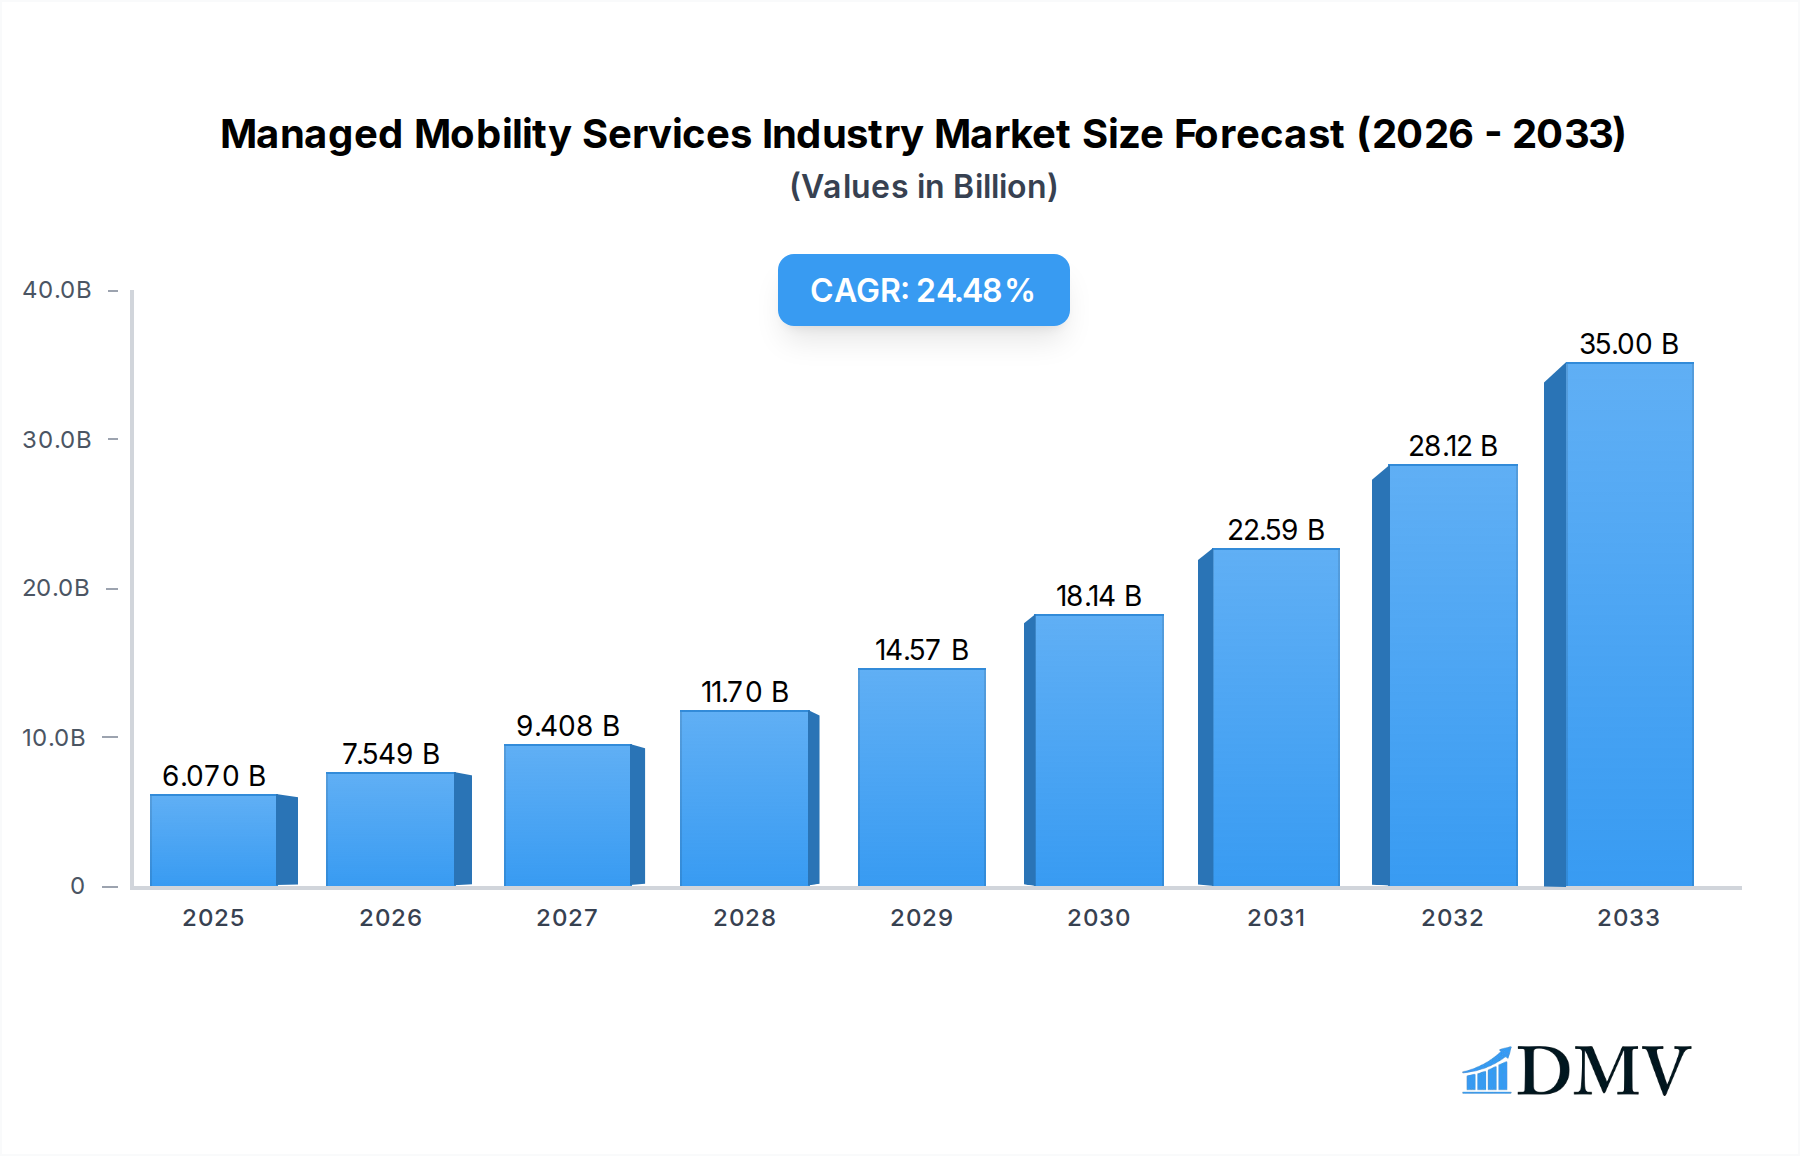
Managed Mobility Services Industry Market Size (In Billion)
The MMS landscape is characterized by a strong emphasis on Mobile Device Management (MDM), Mobile Application Management (MAM), and Mobile Security solutions, catering to a wide array of end-user industries including IT and Telecom, BFSI, Healthcare, Manufacturing, and Retail. Cloud-based deployment models are gaining significant traction due to their scalability, flexibility, and cost-effectiveness, although on-premise solutions continue to serve specific enterprise needs. While the market enjoys strong growth, potential restraints could emerge from the complexity of integrating diverse mobile ecosystems, the ongoing challenge of data privacy regulations, and the need for skilled IT professionals to manage these advanced solutions. Major industry players like Tech Mahindra, Orange SA, AT&T Intellectual Property, Samsung Electronics Co Ltd, Hewlett Packard Enterprise, Microsoft Corporation, Kyndryl Inc, Wipro, Telefónica SA, Fujitsu, and Vodafone Group PLC are actively investing in innovative offerings to capture market share and address evolving customer demands.

Managed Mobility Services Industry Company Market Share
This comprehensive report delivers an in-depth analysis of the global Managed Mobility Services (MMS) industry, providing stakeholders with critical insights into market dynamics, growth trajectories, and strategic opportunities. Spanning from the historical period of 2019–2024 and extending to a robust forecast period of 2025–2033, with a base year of 2025, this study employs meticulous research and data-driven predictions to illuminate the future of enterprise mobility management. The report covers key segments including Mobile Device Management (MDM), Mobile Application Management (MAM), and Mobile Security, across Cloud and On-premise deployment models, and serving diverse end-user industries such as IT and Telecom, BFSI, Healthcare, Manufacturing, Retail, and Education.
This report is essential for IT leaders, mobility strategists, service providers, and investors seeking to understand and capitalize on the evolving managed mobility solutions market. With an estimated market size of XX Million in 2025, projected to reach XX Million by 2033, and a Compound Annual Growth Rate (CAGR) of XX% during the forecast period, the MMS sector is poised for significant expansion. Uncover key industry developments, leading players like Tech Mahindra, Orange SA, AT&T Intellectual Property, Samsung Electronics Co Ltd, Hewlett Packard Enterprise, Microsoft Corporation, Kyndryl Inc, Wipro, Telefónica SA, Fujitsu, and Vodafone Group PLC, and actionable intelligence to navigate this dynamic landscape.
Managed Mobility Services Industry Market Composition & Trends
The Managed Mobility Services market exhibits a dynamic composition characterized by an increasing trend towards specialized and integrated solutions. Market concentration is moderate, with a few large players dominating specific niches, while a substantial number of smaller, agile providers cater to specialized needs. Innovation catalysts are primarily driven by the rapid evolution of mobile technologies, the proliferation of IoT devices, and the growing demand for robust mobile security and mobile application management. The regulatory landscape is becoming more stringent, particularly concerning data privacy and compliance in sectors like BFSI and Healthcare, influencing the adoption of certified MMS solutions. Substitute products, such as in-house IT management, are gradually losing ground to the cost-effectiveness and expertise offered by managed service providers. End-user profiles are diversifying, with a significant shift towards cloud-based solutions across all industries seeking enhanced scalability and flexibility. Merger and acquisition (M&A) activities are on the rise as larger players aim to consolidate their market position and expand their service portfolios, with an estimated XX Million in M&A deal values over the study period.
- Market Share Distribution: Leading providers are expected to capture approximately XX% of the market by 2033, with specialized players holding the remaining share.
- M&A Deal Values: The sector anticipates a cumulative XX Million in M&A transactions between 2019 and 2033, driven by strategic consolidations and technology acquisitions.
- Key Trends: Increasing adoption of AI and ML for predictive security, rise of Zero Trust Network Access (ZTNA), and demand for end-to-end lifecycle management of mobile devices.
Managed Mobility Services Industry Industry Evolution
The Managed Mobility Services industry has undergone a profound evolution, transforming from basic device management to comprehensive enterprise mobility solutions. This evolution has been characterized by significant market growth trajectories fueled by the digital transformation imperative across all sectors. Initially, the focus was on Mobile Device Management (MDM) to enforce basic policies and security on corporate-owned devices. As mobile devices became integral to business operations, the demand for sophisticated Mobile Application Management (MAM) solutions emerged, enabling granular control over enterprise applications and data segregation on both corporate and bring-your-own-device (BYOD) environments. The escalating threat landscape, coupled with the increasing volume of sensitive data managed on mobile endpoints, has propelled Mobile Security to the forefront, driving the adoption of advanced threat detection, prevention, and response services. Technological advancements, including the widespread adoption of 5G, AI-powered analytics, and the Internet of Things (IoT), have further shaped the industry by expanding the scope of managed mobility to encompass a broader range of connected devices and complex use cases. Shifting consumer demands for seamless, secure, and flexible work environments have also played a crucial role, compelling organizations to embrace BYOD policies and remote work models, thereby increasing their reliance on robust MMS. The transition to Cloud-based deployment models has been a pivotal shift, offering greater scalability, cost-efficiency, and faster deployment compared to traditional on-premise solutions. This migration to the cloud has been accelerated by the increasing need for hybrid work capabilities and the desire to reduce IT infrastructure overhead. The IT and Telecom sector has been an early adopter and continues to be a significant market driver, followed closely by BFSI, Healthcare, Manufacturing, Retail, and Education, each with unique mobility requirements that MMS providers are increasingly adept at addressing. The industry's growth is also intrinsically linked to the broader digital transformation initiatives within these end-user industries, where mobility is a foundational element.
Leading Regions, Countries, or Segments in Managed Mobility Services Industry
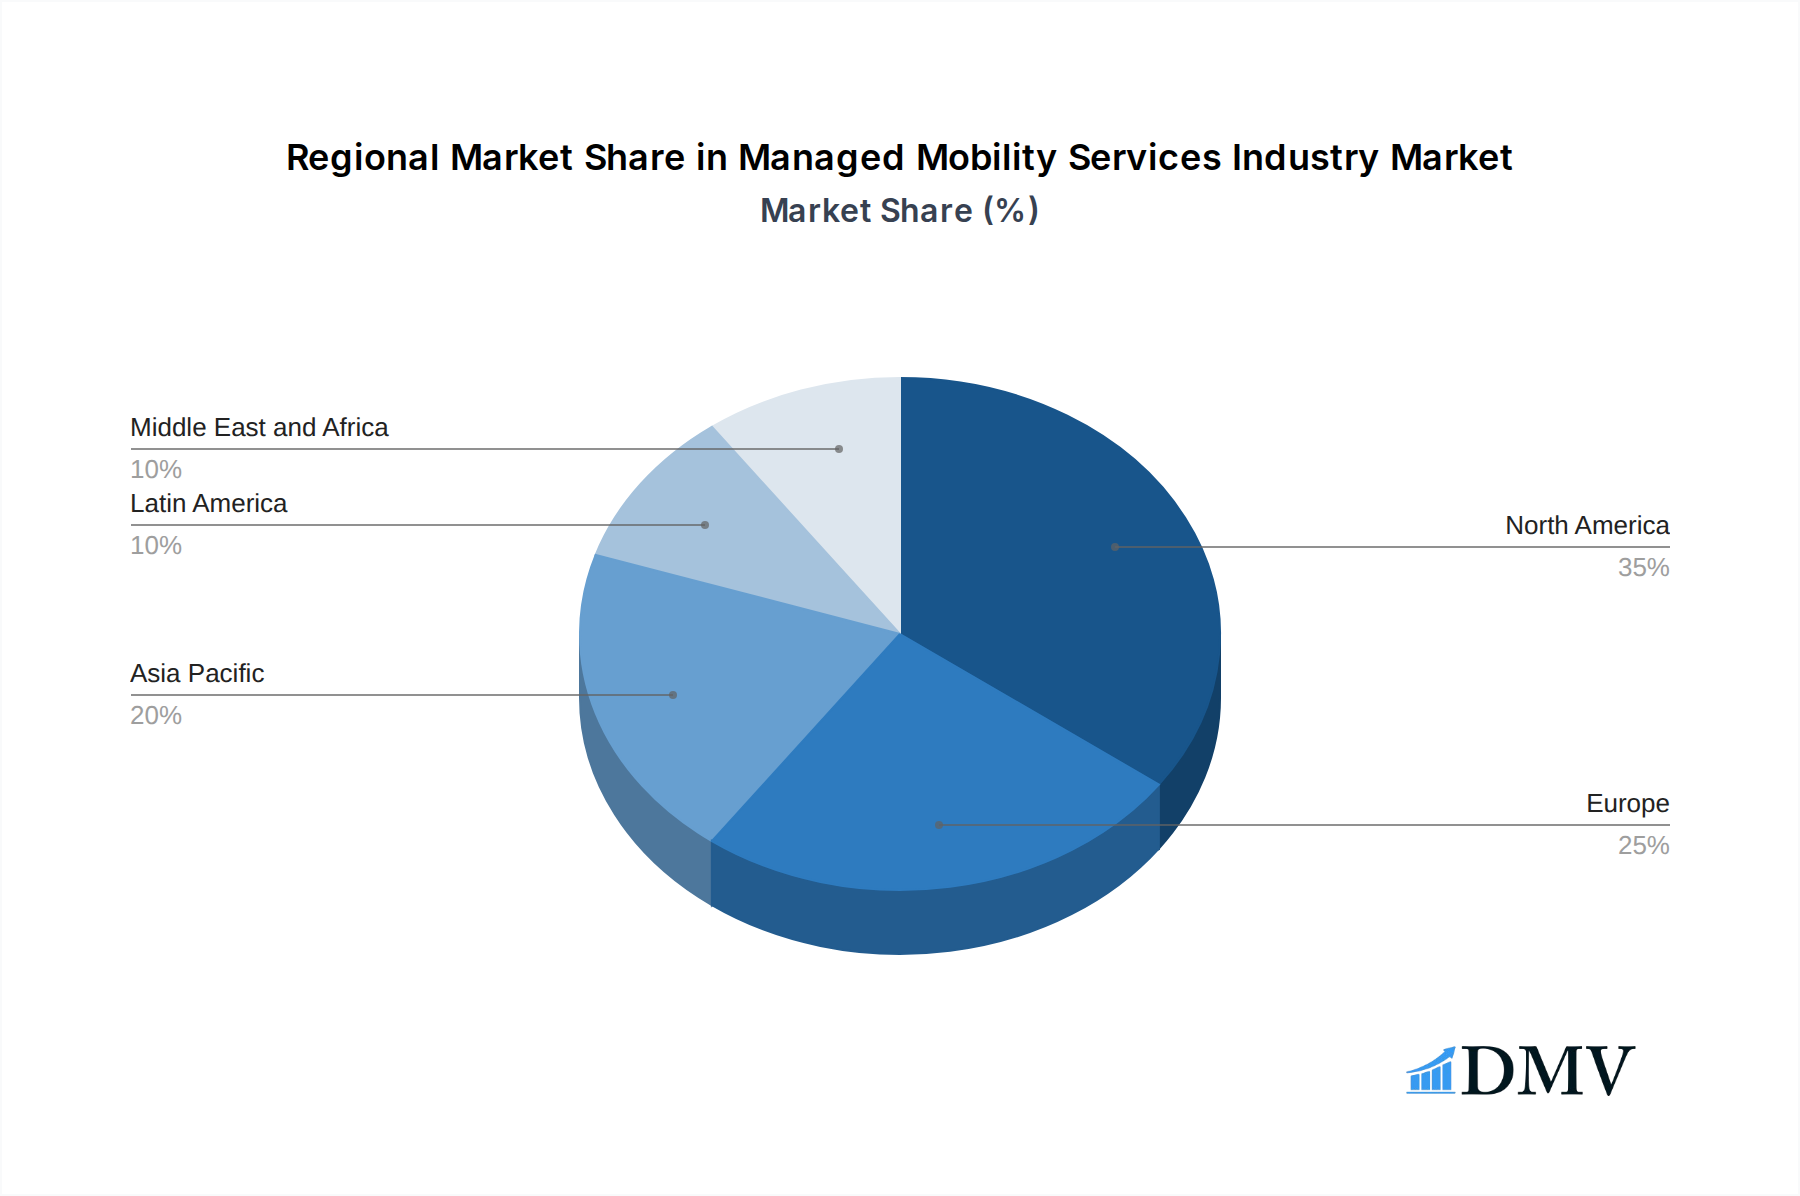
The Managed Mobility Services industry demonstrates significant regional and segmental dominance, with North America and Europe currently leading the market. This leadership is attributed to a combination of factors including high adoption rates of advanced technologies, strong regulatory frameworks supporting data security, and a substantial presence of large enterprises across key end-user industries such as IT and Telecom and BFSI. The IT and Telecom sector remains the largest end-user industry globally, driven by the inherent need for connectivity, device management, and application deployment for a distributed workforce.
Within the functional segments, Mobile Device Management (MDM) continues to hold a dominant position, forming the foundational layer for most mobility strategies. However, the increasing sophistication of mobile threats and the need for application-level control are rapidly expanding the market share of Mobile Application Management (MAM) and Mobile Security solutions. Mobile Security is experiencing particularly robust growth, as organizations prioritize protecting sensitive data and ensuring compliance.
The Cloud deployment model is increasingly becoming the preferred choice across all end-user industries. This preference is driven by the inherent scalability, cost-effectiveness, and agility offered by cloud platforms, enabling businesses to rapidly deploy and manage their mobile fleets without significant upfront infrastructure investment. While on-premise solutions still exist, particularly in highly regulated sectors with strict data sovereignty requirements, the trend is clearly leaning towards cloud-native MMS.
- Dominant Region: North America is expected to maintain its leading position, driven by significant investments in digital transformation and a mature market for managed services.
- Key End-User Industry: IT and Telecom will continue to be the primary driver of demand, followed by BFSI and Healthcare, each presenting unique mobility challenges and opportunities.
- Dominant Deployment Model: Cloud deployment is projected to capture over XX% of the market share by 2033, eclipsing on-premise solutions due to its flexibility and scalability.
- Fastest Growing Segment: Mobile Security is anticipated to witness the highest growth rate, fueled by escalating cyber threats and increasing regulatory scrutiny.
- Investment Trends: Significant investments are being channeled into AI-powered analytics for threat detection and proactive security management within MMS platforms.
Managed Mobility Services Industry Product Innovations
Product innovations in the Managed Mobility Services industry are primarily focused on enhancing security, simplifying management, and enabling advanced analytics. Leading providers are integrating AI and machine learning to offer predictive threat intelligence and automated response capabilities within Mobile Security solutions, proactively identifying and mitigating potential risks. The development of unified endpoint management (UEM) platforms that seamlessly manage diverse devices, including smartphones, tablets, and laptops, is a significant trend, consolidating management functionalities into a single interface. Furthermore, advancements in containerization and sandboxing technologies are bolstering Mobile Application Management (MAM), ensuring robust data isolation and application security without impacting user experience. Innovations in automation and orchestration are streamlining device provisioning, policy enforcement, and software updates, reducing IT overhead and improving operational efficiency. The integration of IoT device management capabilities is also a key area of innovation, catering to the burgeoning needs of industries like manufacturing and logistics.
Propelling Factors for Managed Mobility Services Industry Growth
The Managed Mobility Services industry is experiencing robust growth driven by several key factors. The escalating need for enhanced mobile security in the face of sophisticated cyber threats is a primary catalyst, compelling organizations to seek expert solutions for protecting sensitive data. The ongoing digital transformation across industries, demanding greater workforce agility and remote work capabilities, directly fuels the adoption of managed mobility solutions. Technological advancements, such as the widespread deployment of 5G networks, are enabling more advanced mobile applications and services, requiring robust management and support. Furthermore, the increasing complexity of managing a diverse fleet of mobile devices, including BYOD, necessitates specialized expertise and solutions that managed service providers offer. Cost optimization and a desire to reduce IT overhead are also significant drivers, as organizations seek to leverage the economies of scale and specialized knowledge of MMS providers.
Obstacles in the Managed Mobility Services Industry Market
Despite the strong growth trajectory, the Managed Mobility Services industry faces several obstacles. Regulatory challenges, particularly around data privacy and cross-border data transfer, can complicate global deployments and require significant compliance efforts. Supply chain disruptions, impacting device availability and lead times, can affect the timely provisioning of new devices and replacements. Intense competitive pressures among a growing number of providers can lead to price erosion and necessitate continuous innovation to maintain market share. The complexity of integrating legacy IT systems with modern mobility solutions can also pose a technical hurdle for some organizations. Additionally, the perceived loss of direct control over mobile assets can be a psychological barrier for some IT departments, requiring effective communication and demonstration of value by MMS providers.
Future Opportunities in Managed Mobility Services Industry
The Managed Mobility Services industry is poised for significant future opportunities. The continued expansion of the Internet of Things (IoT) ecosystem presents a vast new market for managed device and data security solutions. The increasing demand for edge computing capabilities will drive the need for mobility solutions that can manage and secure devices at the edge of the network. The growing adoption of hybrid and remote work models globally will further amplify the need for secure, flexible, and scalable mobility management. Emerging markets in Asia Pacific and Latin America are expected to witness substantial growth as digitalization accelerates. Furthermore, the development of advanced AI-driven analytics for proactive threat detection and user behavior analysis offers a significant avenue for service differentiation and revenue growth.
Major Players in the Managed Mobility Services Industry Ecosystem
- Tech Mahindra
- Orange SA
- AT&T Intellectual Property
- Samsung Electronics Co Ltd
- Hewlett Packard Enterprise
- Microsoft Corporation
- Kyndryl Inc
- Wipro
- Telefónica SA
- Fujitsu
- Vodafone Group PLC
Key Developments in Managed Mobility Services Industry Industry
- February 2023: Kyndryl and Microsoft established their first Latin American Center of Excellence with multidisciplinary teams in Brazil, Colombia, Mexico, and Peru. This center combines Kyndryl's expertise in mission-critical IT systems with the Microsoft Cloud to accelerate digital transformation for regional companies. The initiative aims to address the growing need for IT infrastructure modernization and migration to cloud environments, anticipating over 30% cloud market growth in the region by 2023. It will serve as a hub for Microsoft technologies, fostering collaboration between Kyndryl and Microsoft experts to co-create solutions and scale best practices.
- February 2023: Telefónica SA and Skydweller Aero Inc. announced a partnership to explore developing connectivity solutions, leveraging solar-powered aircraft to expand cellular coverage and deliver broadband access to unserved and underserved regions, accelerating the expansion of reliable and affordable connectivity.
Strategic Managed Mobility Services Industry Market Forecast
The Managed Mobility Services industry is set for substantial growth, propelled by the pervasive digital transformation across all sectors and the ever-increasing sophistication of cyber threats. Key growth catalysts include the continued adoption of hybrid work models, the expansion of IoT ecosystems, and the demand for integrated security and management solutions. The shift towards Cloud-based MMS will accelerate, offering greater scalability and cost-efficiency. Emerging markets present significant untapped potential as digitalization gains momentum. Strategic focus on delivering comprehensive, end-to-end mobility solutions, encompassing device management, application deployment, security, and analytics, will be crucial for sustained market leadership and capturing future opportunities in this dynamic and evolving industry. The market is projected to reach XX Million by 2033, indicating a highly promising outlook.
Managed Mobility Services Industry Segmentation
-
1. Function
- 1.1. Mobile Device Management
- 1.2. Mobile Application Management
- 1.3. Mobile Security
- 1.4. Other Functions
-
2. Deployment
- 2.1. Cloud
- 2.2. On-premise
-
3. End-user Industry
- 3.1. IT and Telecom
- 3.2. BFSI
- 3.3. Healthcare
- 3.4. Manufacturing
- 3.5. Retail
- 3.6. Education
- 3.7. Other End-user Industries
Managed Mobility Services Industry Segmentation By Geography
-
1. North America
- 1.1. United States
- 1.2. Canada
-
2. Europe
- 2.1. United Kingdom
- 2.2. Germany
- 2.3. France
- 2.4. Rest of Europe
-
3. Asia Pacific
- 3.1. China
- 3.2. India
- 3.3. Japan
- 3.4. Rest of Asia Pacific
-
4. Latin America
- 4.1. Brazil
- 4.2. Argentina
- 4.3. Mexico
- 4.4. Rest of Latin America
-
5. Middle East and Africa
- 5.1. United Arab Emirates
- 5.2. Saudi Arabia
- 5.3. South Africa
- 5.4. Rest of Middle East and Africa
Managed Mobility Services Industry Regional Market Share
Geographic Coverage of Managed Mobility Services Industry
Managed Mobility Services Industry REPORT HIGHLIGHTS
| Aspects | Details |
|---|---|
| Study Period | 2020-2034 |
| Base Year | 2025 |
| Estimated Year | 2026 |
| Forecast Period | 2026-2034 |
| Historical Period | 2020-2025 |
| Growth Rate | CAGR of 25.41% from 2020-2034 |
| Segmentation |
|
Table of Contents
- 1. Introduction
- 1.1. Research Scope
- 1.2. Market Segmentation
- 1.3. Research Objective
- 1.4. Definitions and Assumptions
- 2. Executive Summary
- 2.1. Market Snapshot
- 3. Market Dynamics
- 3.1. Market Drivers
- 3.2. Market Restrains
- 3.3. Market Trends
- 3.4. Market Opportunities
- 4. Market Factor Analysis
- 4.1. Porters Five Forces
- 4.1.1. Bargaining Power of Suppliers
- 4.1.2. Bargaining Power of Buyers
- 4.1.3. Threat of New Entrants
- 4.1.4. Threat of Substitutes
- 4.1.5. Competitive Rivalry
- 4.2. PESTEL analysis
- 4.3. BCG Analysis
- 4.3.1. Stars (High Growth, High Market Share)
- 4.3.2. Cash Cows (Low Growth, High Market Share)
- 4.3.3. Question Mark (High Growth, Low Market Share)
- 4.3.4. Dogs (Low Growth, Low Market Share)
- 4.4. Ansoff Matrix Analysis
- 4.5. Supply Chain Analysis
- 4.6. Regulatory Landscape
- 4.7. Current Market Potential and Opportunity Assessment (TAM–SAM–SOM Framework)
- 4.8. DMV Analyst Note
- 4.1. Porters Five Forces
- 5. Market Analysis, Insights and Forecast 2021-2033
- 5.1. Market Analysis, Insights and Forecast - by Function
- 5.1.1. Mobile Device Management
- 5.1.2. Mobile Application Management
- 5.1.3. Mobile Security
- 5.1.4. Other Functions
- 5.2. Market Analysis, Insights and Forecast - by Deployment
- 5.2.1. Cloud
- 5.2.2. On-premise
- 5.3. Market Analysis, Insights and Forecast - by End-user Industry
- 5.3.1. IT and Telecom
- 5.3.2. BFSI
- 5.3.3. Healthcare
- 5.3.4. Manufacturing
- 5.3.5. Retail
- 5.3.6. Education
- 5.3.7. Other End-user Industries
- 5.4. Market Analysis, Insights and Forecast - by Region
- 5.4.1. North America
- 5.4.2. Europe
- 5.4.3. Asia Pacific
- 5.4.4. Latin America
- 5.4.5. Middle East and Africa
- 5.1. Market Analysis, Insights and Forecast - by Function
- 6. Global Managed Mobility Services Industry Analysis, Insights and Forecast, 2021-2033
- 6.1. Market Analysis, Insights and Forecast - by Function
- 6.1.1. Mobile Device Management
- 6.1.2. Mobile Application Management
- 6.1.3. Mobile Security
- 6.1.4. Other Functions
- 6.2. Market Analysis, Insights and Forecast - by Deployment
- 6.2.1. Cloud
- 6.2.2. On-premise
- 6.3. Market Analysis, Insights and Forecast - by End-user Industry
- 6.3.1. IT and Telecom
- 6.3.2. BFSI
- 6.3.3. Healthcare
- 6.3.4. Manufacturing
- 6.3.5. Retail
- 6.3.6. Education
- 6.3.7. Other End-user Industries
- 6.1. Market Analysis, Insights and Forecast - by Function
- 7. North America Managed Mobility Services Industry Analysis, Insights and Forecast, 2020-2032
- 7.1. Market Analysis, Insights and Forecast - by Function
- 7.1.1. Mobile Device Management
- 7.1.2. Mobile Application Management
- 7.1.3. Mobile Security
- 7.1.4. Other Functions
- 7.2. Market Analysis, Insights and Forecast - by Deployment
- 7.2.1. Cloud
- 7.2.2. On-premise
- 7.3. Market Analysis, Insights and Forecast - by End-user Industry
- 7.3.1. IT and Telecom
- 7.3.2. BFSI
- 7.3.3. Healthcare
- 7.3.4. Manufacturing
- 7.3.5. Retail
- 7.3.6. Education
- 7.3.7. Other End-user Industries
- 7.1. Market Analysis, Insights and Forecast - by Function
- 8. Europe Managed Mobility Services Industry Analysis, Insights and Forecast, 2020-2032
- 8.1. Market Analysis, Insights and Forecast - by Function
- 8.1.1. Mobile Device Management
- 8.1.2. Mobile Application Management
- 8.1.3. Mobile Security
- 8.1.4. Other Functions
- 8.2. Market Analysis, Insights and Forecast - by Deployment
- 8.2.1. Cloud
- 8.2.2. On-premise
- 8.3. Market Analysis, Insights and Forecast - by End-user Industry
- 8.3.1. IT and Telecom
- 8.3.2. BFSI
- 8.3.3. Healthcare
- 8.3.4. Manufacturing
- 8.3.5. Retail
- 8.3.6. Education
- 8.3.7. Other End-user Industries
- 8.1. Market Analysis, Insights and Forecast - by Function
- 9. Asia Pacific Managed Mobility Services Industry Analysis, Insights and Forecast, 2020-2032
- 9.1. Market Analysis, Insights and Forecast - by Function
- 9.1.1. Mobile Device Management
- 9.1.2. Mobile Application Management
- 9.1.3. Mobile Security
- 9.1.4. Other Functions
- 9.2. Market Analysis, Insights and Forecast - by Deployment
- 9.2.1. Cloud
- 9.2.2. On-premise
- 9.3. Market Analysis, Insights and Forecast - by End-user Industry
- 9.3.1. IT and Telecom
- 9.3.2. BFSI
- 9.3.3. Healthcare
- 9.3.4. Manufacturing
- 9.3.5. Retail
- 9.3.6. Education
- 9.3.7. Other End-user Industries
- 9.1. Market Analysis, Insights and Forecast - by Function
- 10. Latin America Managed Mobility Services Industry Analysis, Insights and Forecast, 2020-2032
- 10.1. Market Analysis, Insights and Forecast - by Function
- 10.1.1. Mobile Device Management
- 10.1.2. Mobile Application Management
- 10.1.3. Mobile Security
- 10.1.4. Other Functions
- 10.2. Market Analysis, Insights and Forecast - by Deployment
- 10.2.1. Cloud
- 10.2.2. On-premise
- 10.3. Market Analysis, Insights and Forecast - by End-user Industry
- 10.3.1. IT and Telecom
- 10.3.2. BFSI
- 10.3.3. Healthcare
- 10.3.4. Manufacturing
- 10.3.5. Retail
- 10.3.6. Education
- 10.3.7. Other End-user Industries
- 10.1. Market Analysis, Insights and Forecast - by Function
- 11. Middle East and Africa Managed Mobility Services Industry Analysis, Insights and Forecast, 2020-2032
- 11.1. Market Analysis, Insights and Forecast - by Function
- 11.1.1. Mobile Device Management
- 11.1.2. Mobile Application Management
- 11.1.3. Mobile Security
- 11.1.4. Other Functions
- 11.2. Market Analysis, Insights and Forecast - by Deployment
- 11.2.1. Cloud
- 11.2.2. On-premise
- 11.3. Market Analysis, Insights and Forecast - by End-user Industry
- 11.3.1. IT and Telecom
- 11.3.2. BFSI
- 11.3.3. Healthcare
- 11.3.4. Manufacturing
- 11.3.5. Retail
- 11.3.6. Education
- 11.3.7. Other End-user Industries
- 11.1. Market Analysis, Insights and Forecast - by Function
- 12. Competitive Analysis
- 12.1. Company Profiles
- 12.1.1 Tech Mahindra
- 12.1.1.1. Company Overview
- 12.1.1.2. Products
- 12.1.1.3. Company Financials
- 12.1.1.4. SWOT Analysis
- 12.1.2 Orange SA
- 12.1.2.1. Company Overview
- 12.1.2.2. Products
- 12.1.2.3. Company Financials
- 12.1.2.4. SWOT Analysis
- 12.1.3 AT&T Intellectual Property
- 12.1.3.1. Company Overview
- 12.1.3.2. Products
- 12.1.3.3. Company Financials
- 12.1.3.4. SWOT Analysis
- 12.1.4 Samsung Electronics Co Ltd
- 12.1.4.1. Company Overview
- 12.1.4.2. Products
- 12.1.4.3. Company Financials
- 12.1.4.4. SWOT Analysis
- 12.1.5 Hewlett Packard Enterprise
- 12.1.5.1. Company Overview
- 12.1.5.2. Products
- 12.1.5.3. Company Financials
- 12.1.5.4. SWOT Analysis
- 12.1.6 Microsoft Corporation
- 12.1.6.1. Company Overview
- 12.1.6.2. Products
- 12.1.6.3. Company Financials
- 12.1.6.4. SWOT Analysis
- 12.1.7 Kyndryl Inc
- 12.1.7.1. Company Overview
- 12.1.7.2. Products
- 12.1.7.3. Company Financials
- 12.1.7.4. SWOT Analysis
- 12.1.8 Wipro
- 12.1.8.1. Company Overview
- 12.1.8.2. Products
- 12.1.8.3. Company Financials
- 12.1.8.4. SWOT Analysis
- 12.1.9 Telefónica SA
- 12.1.9.1. Company Overview
- 12.1.9.2. Products
- 12.1.9.3. Company Financials
- 12.1.9.4. SWOT Analysis
- 12.1.10 Fujitsu
- 12.1.10.1. Company Overview
- 12.1.10.2. Products
- 12.1.10.3. Company Financials
- 12.1.10.4. SWOT Analysis
- 12.1.11 Vodafone Group PLC
- 12.1.11.1. Company Overview
- 12.1.11.2. Products
- 12.1.11.3. Company Financials
- 12.1.11.4. SWOT Analysis
- 12.1.1 Tech Mahindra
- 12.2. Market Entropy
- 12.2.1 Company's Key Areas Served
- 12.2.2 Recent Developments
- 12.3. Company Market Share Analysis 2025
- 12.3.1 Top 5 Companies Market Share Analysis
- 12.3.2 Top 3 Companies Market Share Analysis
- 12.4. List of Potential Customers
- 13. Research Methodology
List of Figures
- Figure 1: Global Managed Mobility Services Industry Revenue Breakdown (Million, %) by Region 2025 & 2033
- Figure 2: Global Managed Mobility Services Industry Volume Breakdown (K Unit, %) by Region 2025 & 2033
- Figure 3: North America Managed Mobility Services Industry Revenue (Million), by Function 2025 & 2033
- Figure 4: North America Managed Mobility Services Industry Volume (K Unit), by Function 2025 & 2033
- Figure 5: North America Managed Mobility Services Industry Revenue Share (%), by Function 2025 & 2033
- Figure 6: North America Managed Mobility Services Industry Volume Share (%), by Function 2025 & 2033
- Figure 7: North America Managed Mobility Services Industry Revenue (Million), by Deployment 2025 & 2033
- Figure 8: North America Managed Mobility Services Industry Volume (K Unit), by Deployment 2025 & 2033
- Figure 9: North America Managed Mobility Services Industry Revenue Share (%), by Deployment 2025 & 2033
- Figure 10: North America Managed Mobility Services Industry Volume Share (%), by Deployment 2025 & 2033
- Figure 11: North America Managed Mobility Services Industry Revenue (Million), by End-user Industry 2025 & 2033
- Figure 12: North America Managed Mobility Services Industry Volume (K Unit), by End-user Industry 2025 & 2033
- Figure 13: North America Managed Mobility Services Industry Revenue Share (%), by End-user Industry 2025 & 2033
- Figure 14: North America Managed Mobility Services Industry Volume Share (%), by End-user Industry 2025 & 2033
- Figure 15: North America Managed Mobility Services Industry Revenue (Million), by Country 2025 & 2033
- Figure 16: North America Managed Mobility Services Industry Volume (K Unit), by Country 2025 & 2033
- Figure 17: North America Managed Mobility Services Industry Revenue Share (%), by Country 2025 & 2033
- Figure 18: North America Managed Mobility Services Industry Volume Share (%), by Country 2025 & 2033
- Figure 19: Europe Managed Mobility Services Industry Revenue (Million), by Function 2025 & 2033
- Figure 20: Europe Managed Mobility Services Industry Volume (K Unit), by Function 2025 & 2033
- Figure 21: Europe Managed Mobility Services Industry Revenue Share (%), by Function 2025 & 2033
- Figure 22: Europe Managed Mobility Services Industry Volume Share (%), by Function 2025 & 2033
- Figure 23: Europe Managed Mobility Services Industry Revenue (Million), by Deployment 2025 & 2033
- Figure 24: Europe Managed Mobility Services Industry Volume (K Unit), by Deployment 2025 & 2033
- Figure 25: Europe Managed Mobility Services Industry Revenue Share (%), by Deployment 2025 & 2033
- Figure 26: Europe Managed Mobility Services Industry Volume Share (%), by Deployment 2025 & 2033
- Figure 27: Europe Managed Mobility Services Industry Revenue (Million), by End-user Industry 2025 & 2033
- Figure 28: Europe Managed Mobility Services Industry Volume (K Unit), by End-user Industry 2025 & 2033
- Figure 29: Europe Managed Mobility Services Industry Revenue Share (%), by End-user Industry 2025 & 2033
- Figure 30: Europe Managed Mobility Services Industry Volume Share (%), by End-user Industry 2025 & 2033
- Figure 31: Europe Managed Mobility Services Industry Revenue (Million), by Country 2025 & 2033
- Figure 32: Europe Managed Mobility Services Industry Volume (K Unit), by Country 2025 & 2033
- Figure 33: Europe Managed Mobility Services Industry Revenue Share (%), by Country 2025 & 2033
- Figure 34: Europe Managed Mobility Services Industry Volume Share (%), by Country 2025 & 2033
- Figure 35: Asia Pacific Managed Mobility Services Industry Revenue (Million), by Function 2025 & 2033
- Figure 36: Asia Pacific Managed Mobility Services Industry Volume (K Unit), by Function 2025 & 2033
- Figure 37: Asia Pacific Managed Mobility Services Industry Revenue Share (%), by Function 2025 & 2033
- Figure 38: Asia Pacific Managed Mobility Services Industry Volume Share (%), by Function 2025 & 2033
- Figure 39: Asia Pacific Managed Mobility Services Industry Revenue (Million), by Deployment 2025 & 2033
- Figure 40: Asia Pacific Managed Mobility Services Industry Volume (K Unit), by Deployment 2025 & 2033
- Figure 41: Asia Pacific Managed Mobility Services Industry Revenue Share (%), by Deployment 2025 & 2033
- Figure 42: Asia Pacific Managed Mobility Services Industry Volume Share (%), by Deployment 2025 & 2033
- Figure 43: Asia Pacific Managed Mobility Services Industry Revenue (Million), by End-user Industry 2025 & 2033
- Figure 44: Asia Pacific Managed Mobility Services Industry Volume (K Unit), by End-user Industry 2025 & 2033
- Figure 45: Asia Pacific Managed Mobility Services Industry Revenue Share (%), by End-user Industry 2025 & 2033
- Figure 46: Asia Pacific Managed Mobility Services Industry Volume Share (%), by End-user Industry 2025 & 2033
- Figure 47: Asia Pacific Managed Mobility Services Industry Revenue (Million), by Country 2025 & 2033
- Figure 48: Asia Pacific Managed Mobility Services Industry Volume (K Unit), by Country 2025 & 2033
- Figure 49: Asia Pacific Managed Mobility Services Industry Revenue Share (%), by Country 2025 & 2033
- Figure 50: Asia Pacific Managed Mobility Services Industry Volume Share (%), by Country 2025 & 2033
- Figure 51: Latin America Managed Mobility Services Industry Revenue (Million), by Function 2025 & 2033
- Figure 52: Latin America Managed Mobility Services Industry Volume (K Unit), by Function 2025 & 2033
- Figure 53: Latin America Managed Mobility Services Industry Revenue Share (%), by Function 2025 & 2033
- Figure 54: Latin America Managed Mobility Services Industry Volume Share (%), by Function 2025 & 2033
- Figure 55: Latin America Managed Mobility Services Industry Revenue (Million), by Deployment 2025 & 2033
- Figure 56: Latin America Managed Mobility Services Industry Volume (K Unit), by Deployment 2025 & 2033
- Figure 57: Latin America Managed Mobility Services Industry Revenue Share (%), by Deployment 2025 & 2033
- Figure 58: Latin America Managed Mobility Services Industry Volume Share (%), by Deployment 2025 & 2033
- Figure 59: Latin America Managed Mobility Services Industry Revenue (Million), by End-user Industry 2025 & 2033
- Figure 60: Latin America Managed Mobility Services Industry Volume (K Unit), by End-user Industry 2025 & 2033
- Figure 61: Latin America Managed Mobility Services Industry Revenue Share (%), by End-user Industry 2025 & 2033
- Figure 62: Latin America Managed Mobility Services Industry Volume Share (%), by End-user Industry 2025 & 2033
- Figure 63: Latin America Managed Mobility Services Industry Revenue (Million), by Country 2025 & 2033
- Figure 64: Latin America Managed Mobility Services Industry Volume (K Unit), by Country 2025 & 2033
- Figure 65: Latin America Managed Mobility Services Industry Revenue Share (%), by Country 2025 & 2033
- Figure 66: Latin America Managed Mobility Services Industry Volume Share (%), by Country 2025 & 2033
- Figure 67: Middle East and Africa Managed Mobility Services Industry Revenue (Million), by Function 2025 & 2033
- Figure 68: Middle East and Africa Managed Mobility Services Industry Volume (K Unit), by Function 2025 & 2033
- Figure 69: Middle East and Africa Managed Mobility Services Industry Revenue Share (%), by Function 2025 & 2033
- Figure 70: Middle East and Africa Managed Mobility Services Industry Volume Share (%), by Function 2025 & 2033
- Figure 71: Middle East and Africa Managed Mobility Services Industry Revenue (Million), by Deployment 2025 & 2033
- Figure 72: Middle East and Africa Managed Mobility Services Industry Volume (K Unit), by Deployment 2025 & 2033
- Figure 73: Middle East and Africa Managed Mobility Services Industry Revenue Share (%), by Deployment 2025 & 2033
- Figure 74: Middle East and Africa Managed Mobility Services Industry Volume Share (%), by Deployment 2025 & 2033
- Figure 75: Middle East and Africa Managed Mobility Services Industry Revenue (Million), by End-user Industry 2025 & 2033
- Figure 76: Middle East and Africa Managed Mobility Services Industry Volume (K Unit), by End-user Industry 2025 & 2033
- Figure 77: Middle East and Africa Managed Mobility Services Industry Revenue Share (%), by End-user Industry 2025 & 2033
- Figure 78: Middle East and Africa Managed Mobility Services Industry Volume Share (%), by End-user Industry 2025 & 2033
- Figure 79: Middle East and Africa Managed Mobility Services Industry Revenue (Million), by Country 2025 & 2033
- Figure 80: Middle East and Africa Managed Mobility Services Industry Volume (K Unit), by Country 2025 & 2033
- Figure 81: Middle East and Africa Managed Mobility Services Industry Revenue Share (%), by Country 2025 & 2033
- Figure 82: Middle East and Africa Managed Mobility Services Industry Volume Share (%), by Country 2025 & 2033
List of Tables
- Table 1: Global Managed Mobility Services Industry Revenue Million Forecast, by Function 2020 & 2033
- Table 2: Global Managed Mobility Services Industry Volume K Unit Forecast, by Function 2020 & 2033
- Table 3: Global Managed Mobility Services Industry Revenue Million Forecast, by Deployment 2020 & 2033
- Table 4: Global Managed Mobility Services Industry Volume K Unit Forecast, by Deployment 2020 & 2033
- Table 5: Global Managed Mobility Services Industry Revenue Million Forecast, by End-user Industry 2020 & 2033
- Table 6: Global Managed Mobility Services Industry Volume K Unit Forecast, by End-user Industry 2020 & 2033
- Table 7: Global Managed Mobility Services Industry Revenue Million Forecast, by Region 2020 & 2033
- Table 8: Global Managed Mobility Services Industry Volume K Unit Forecast, by Region 2020 & 2033
- Table 9: Global Managed Mobility Services Industry Revenue Million Forecast, by Function 2020 & 2033
- Table 10: Global Managed Mobility Services Industry Volume K Unit Forecast, by Function 2020 & 2033
- Table 11: Global Managed Mobility Services Industry Revenue Million Forecast, by Deployment 2020 & 2033
- Table 12: Global Managed Mobility Services Industry Volume K Unit Forecast, by Deployment 2020 & 2033
- Table 13: Global Managed Mobility Services Industry Revenue Million Forecast, by End-user Industry 2020 & 2033
- Table 14: Global Managed Mobility Services Industry Volume K Unit Forecast, by End-user Industry 2020 & 2033
- Table 15: Global Managed Mobility Services Industry Revenue Million Forecast, by Country 2020 & 2033
- Table 16: Global Managed Mobility Services Industry Volume K Unit Forecast, by Country 2020 & 2033
- Table 17: United States Managed Mobility Services Industry Revenue (Million) Forecast, by Application 2020 & 2033
- Table 18: United States Managed Mobility Services Industry Volume (K Unit) Forecast, by Application 2020 & 2033
- Table 19: Canada Managed Mobility Services Industry Revenue (Million) Forecast, by Application 2020 & 2033
- Table 20: Canada Managed Mobility Services Industry Volume (K Unit) Forecast, by Application 2020 & 2033
- Table 21: Global Managed Mobility Services Industry Revenue Million Forecast, by Function 2020 & 2033
- Table 22: Global Managed Mobility Services Industry Volume K Unit Forecast, by Function 2020 & 2033
- Table 23: Global Managed Mobility Services Industry Revenue Million Forecast, by Deployment 2020 & 2033
- Table 24: Global Managed Mobility Services Industry Volume K Unit Forecast, by Deployment 2020 & 2033
- Table 25: Global Managed Mobility Services Industry Revenue Million Forecast, by End-user Industry 2020 & 2033
- Table 26: Global Managed Mobility Services Industry Volume K Unit Forecast, by End-user Industry 2020 & 2033
- Table 27: Global Managed Mobility Services Industry Revenue Million Forecast, by Country 2020 & 2033
- Table 28: Global Managed Mobility Services Industry Volume K Unit Forecast, by Country 2020 & 2033
- Table 29: United Kingdom Managed Mobility Services Industry Revenue (Million) Forecast, by Application 2020 & 2033
- Table 30: United Kingdom Managed Mobility Services Industry Volume (K Unit) Forecast, by Application 2020 & 2033
- Table 31: Germany Managed Mobility Services Industry Revenue (Million) Forecast, by Application 2020 & 2033
- Table 32: Germany Managed Mobility Services Industry Volume (K Unit) Forecast, by Application 2020 & 2033
- Table 33: France Managed Mobility Services Industry Revenue (Million) Forecast, by Application 2020 & 2033
- Table 34: France Managed Mobility Services Industry Volume (K Unit) Forecast, by Application 2020 & 2033
- Table 35: Rest of Europe Managed Mobility Services Industry Revenue (Million) Forecast, by Application 2020 & 2033
- Table 36: Rest of Europe Managed Mobility Services Industry Volume (K Unit) Forecast, by Application 2020 & 2033
- Table 37: Global Managed Mobility Services Industry Revenue Million Forecast, by Function 2020 & 2033
- Table 38: Global Managed Mobility Services Industry Volume K Unit Forecast, by Function 2020 & 2033
- Table 39: Global Managed Mobility Services Industry Revenue Million Forecast, by Deployment 2020 & 2033
- Table 40: Global Managed Mobility Services Industry Volume K Unit Forecast, by Deployment 2020 & 2033
- Table 41: Global Managed Mobility Services Industry Revenue Million Forecast, by End-user Industry 2020 & 2033
- Table 42: Global Managed Mobility Services Industry Volume K Unit Forecast, by End-user Industry 2020 & 2033
- Table 43: Global Managed Mobility Services Industry Revenue Million Forecast, by Country 2020 & 2033
- Table 44: Global Managed Mobility Services Industry Volume K Unit Forecast, by Country 2020 & 2033
- Table 45: China Managed Mobility Services Industry Revenue (Million) Forecast, by Application 2020 & 2033
- Table 46: China Managed Mobility Services Industry Volume (K Unit) Forecast, by Application 2020 & 2033
- Table 47: India Managed Mobility Services Industry Revenue (Million) Forecast, by Application 2020 & 2033
- Table 48: India Managed Mobility Services Industry Volume (K Unit) Forecast, by Application 2020 & 2033
- Table 49: Japan Managed Mobility Services Industry Revenue (Million) Forecast, by Application 2020 & 2033
- Table 50: Japan Managed Mobility Services Industry Volume (K Unit) Forecast, by Application 2020 & 2033
- Table 51: Rest of Asia Pacific Managed Mobility Services Industry Revenue (Million) Forecast, by Application 2020 & 2033
- Table 52: Rest of Asia Pacific Managed Mobility Services Industry Volume (K Unit) Forecast, by Application 2020 & 2033
- Table 53: Global Managed Mobility Services Industry Revenue Million Forecast, by Function 2020 & 2033
- Table 54: Global Managed Mobility Services Industry Volume K Unit Forecast, by Function 2020 & 2033
- Table 55: Global Managed Mobility Services Industry Revenue Million Forecast, by Deployment 2020 & 2033
- Table 56: Global Managed Mobility Services Industry Volume K Unit Forecast, by Deployment 2020 & 2033
- Table 57: Global Managed Mobility Services Industry Revenue Million Forecast, by End-user Industry 2020 & 2033
- Table 58: Global Managed Mobility Services Industry Volume K Unit Forecast, by End-user Industry 2020 & 2033
- Table 59: Global Managed Mobility Services Industry Revenue Million Forecast, by Country 2020 & 2033
- Table 60: Global Managed Mobility Services Industry Volume K Unit Forecast, by Country 2020 & 2033
- Table 61: Brazil Managed Mobility Services Industry Revenue (Million) Forecast, by Application 2020 & 2033
- Table 62: Brazil Managed Mobility Services Industry Volume (K Unit) Forecast, by Application 2020 & 2033
- Table 63: Argentina Managed Mobility Services Industry Revenue (Million) Forecast, by Application 2020 & 2033
- Table 64: Argentina Managed Mobility Services Industry Volume (K Unit) Forecast, by Application 2020 & 2033
- Table 65: Mexico Managed Mobility Services Industry Revenue (Million) Forecast, by Application 2020 & 2033
- Table 66: Mexico Managed Mobility Services Industry Volume (K Unit) Forecast, by Application 2020 & 2033
- Table 67: Rest of Latin America Managed Mobility Services Industry Revenue (Million) Forecast, by Application 2020 & 2033
- Table 68: Rest of Latin America Managed Mobility Services Industry Volume (K Unit) Forecast, by Application 2020 & 2033
- Table 69: Global Managed Mobility Services Industry Revenue Million Forecast, by Function 2020 & 2033
- Table 70: Global Managed Mobility Services Industry Volume K Unit Forecast, by Function 2020 & 2033
- Table 71: Global Managed Mobility Services Industry Revenue Million Forecast, by Deployment 2020 & 2033
- Table 72: Global Managed Mobility Services Industry Volume K Unit Forecast, by Deployment 2020 & 2033
- Table 73: Global Managed Mobility Services Industry Revenue Million Forecast, by End-user Industry 2020 & 2033
- Table 74: Global Managed Mobility Services Industry Volume K Unit Forecast, by End-user Industry 2020 & 2033
- Table 75: Global Managed Mobility Services Industry Revenue Million Forecast, by Country 2020 & 2033
- Table 76: Global Managed Mobility Services Industry Volume K Unit Forecast, by Country 2020 & 2033
- Table 77: United Arab Emirates Managed Mobility Services Industry Revenue (Million) Forecast, by Application 2020 & 2033
- Table 78: United Arab Emirates Managed Mobility Services Industry Volume (K Unit) Forecast, by Application 2020 & 2033
- Table 79: Saudi Arabia Managed Mobility Services Industry Revenue (Million) Forecast, by Application 2020 & 2033
- Table 80: Saudi Arabia Managed Mobility Services Industry Volume (K Unit) Forecast, by Application 2020 & 2033
- Table 81: South Africa Managed Mobility Services Industry Revenue (Million) Forecast, by Application 2020 & 2033
- Table 82: South Africa Managed Mobility Services Industry Volume (K Unit) Forecast, by Application 2020 & 2033
- Table 83: Rest of Middle East and Africa Managed Mobility Services Industry Revenue (Million) Forecast, by Application 2020 & 2033
- Table 84: Rest of Middle East and Africa Managed Mobility Services Industry Volume (K Unit) Forecast, by Application 2020 & 2033
Frequently Asked Questions
1. What is the projected Compound Annual Growth Rate (CAGR) of the Managed Mobility Services Industry?
The projected CAGR is approximately 25.41%.
2. Which companies are prominent players in the Managed Mobility Services Industry?
Key companies in the market include Tech Mahindra, Orange SA, AT&T Intellectual Property, Samsung Electronics Co Ltd, Hewlett Packard Enterprise, Microsoft Corporation, Kyndryl Inc, Wipro, Telefónica SA, Fujitsu, Vodafone Group PLC.
3. What are the main segments of the Managed Mobility Services Industry?
The market segments include Function, Deployment, End-user Industry.
4. Can you provide details about the market size?
The market size is estimated to be USD 6.07 Million as of 2022.
5. What are some drivers contributing to market growth?
Increasing Adoption of BYOD in Multiple Industries; Companies Outsourcing IT Activities.
6. What are the notable trends driving market growth?
IT and Telecom End-user Industry Segment Holds Significant Market Share.
7. Are there any restraints impacting market growth?
Lack of Control over Operations and Cost Visibility.
8. Can you provide examples of recent developments in the market?
February 2023: Kyndryland Microsoft established its first Latin American Center of Excellence with multidisciplinary teams in Brazil, Colombia, Mexico, and Peru. The center combines Kyndryl'sexpertise and understanding of mission-critical IT systems with the Microsoft Cloud to assist companies in the region in accelerating their digital transformation journeys. Organizations throughout Latin America have identified the need to modernize their IT structures and legacy systems by migrating to cloud environments. This will allow them to increase hybrid cloud speed and agility. According to IDC, the cloud market in the region will grow by more than 30% by 2023. Furthermore, the Kyndryland Microsoft Center of Excellence will be a central hub of information, resources, and skills related to Microsoft technologies to support enterprise customers throughout Latin America. Kyndryl's experts in solutions, consulting, and managed services, will collaborate with Microsoft architects and technical staff to co-create replicable assets, conduct proof of concepts (POCs), and scale innovation best practices.
9. What pricing options are available for accessing the report?
Pricing options include single-user, multi-user, and enterprise licenses priced at USD 4750, USD 5250, and USD 8750 respectively.
10. Is the market size provided in terms of value or volume?
The market size is provided in terms of value, measured in Million and volume, measured in K Unit.
11. Are there any specific market keywords associated with the report?
Yes, the market keyword associated with the report is "Managed Mobility Services Industry," which aids in identifying and referencing the specific market segment covered.
12. How do I determine which pricing option suits my needs best?
The pricing options vary based on user requirements and access needs. Individual users may opt for single-user licenses, while businesses requiring broader access may choose multi-user or enterprise licenses for cost-effective access to the report.
13. Are there any additional resources or data provided in the Managed Mobility Services Industry report?
While the report offers comprehensive insights, it's advisable to review the specific contents or supplementary materials provided to ascertain if additional resources or data are available.
14. How can I stay updated on further developments or reports in the Managed Mobility Services Industry?
To stay informed about further developments, trends, and reports in the Managed Mobility Services Industry, consider subscribing to industry newsletters, following relevant companies and organizations, or regularly checking reputable industry news sources and publications.
Methodology
Step 1 - Identification of Relevant Samples Size from Population Database


Step 2 - Approaches for Defining Global Market Size (Value, Volume* & Price*)

Note*: In applicable scenarios
Step 3 - Data Sources
Primary Research
- Web Analytics
- Survey Reports
- Research Institute
- Latest Research Reports
- Opinion Leaders
Secondary Research
- Annual Reports
- White Paper
- Latest Press Release
- Industry Association
- Paid Database
- Investor Presentations

Step 4 - Data Triangulation
Involves using different sources of information in order to increase the validity of a study
These sources are likely to be stakeholders in a program - participants, other researchers, program staff, other community members, and so on.
Then we put all data in single framework & apply various statistical tools to find out the dynamic on the market.
During the analysis stage, feedback from the stakeholder groups would be compared to determine areas of agreement as well as areas of divergence