

Key Insights
The global Quantum Sensors market is poised for significant expansion, projected to reach $0.67 million by 2025, driven by an impressive Compound Annual Growth Rate (CAGR) of 12.95% during the forecast period of 2025-2033. This robust growth is underpinned by the increasing demand for high-precision measurement capabilities across a multitude of sectors. Key market drivers include the escalating need for advanced navigation and timing systems in military and defense applications, the burgeoning adoption of quantum sensing technologies in the automotive industry for enhanced autonomous driving features, and the critical role of these sensors in the oil and gas sector for more accurate resource exploration and monitoring. Furthermore, the healthcare industry is increasingly leveraging quantum sensors for improved diagnostic tools and advanced medical imaging, contributing significantly to market momentum. The market is also witnessing a strong trend towards miniaturization and increased portability of quantum sensing devices, making them more accessible and adaptable to diverse environments.
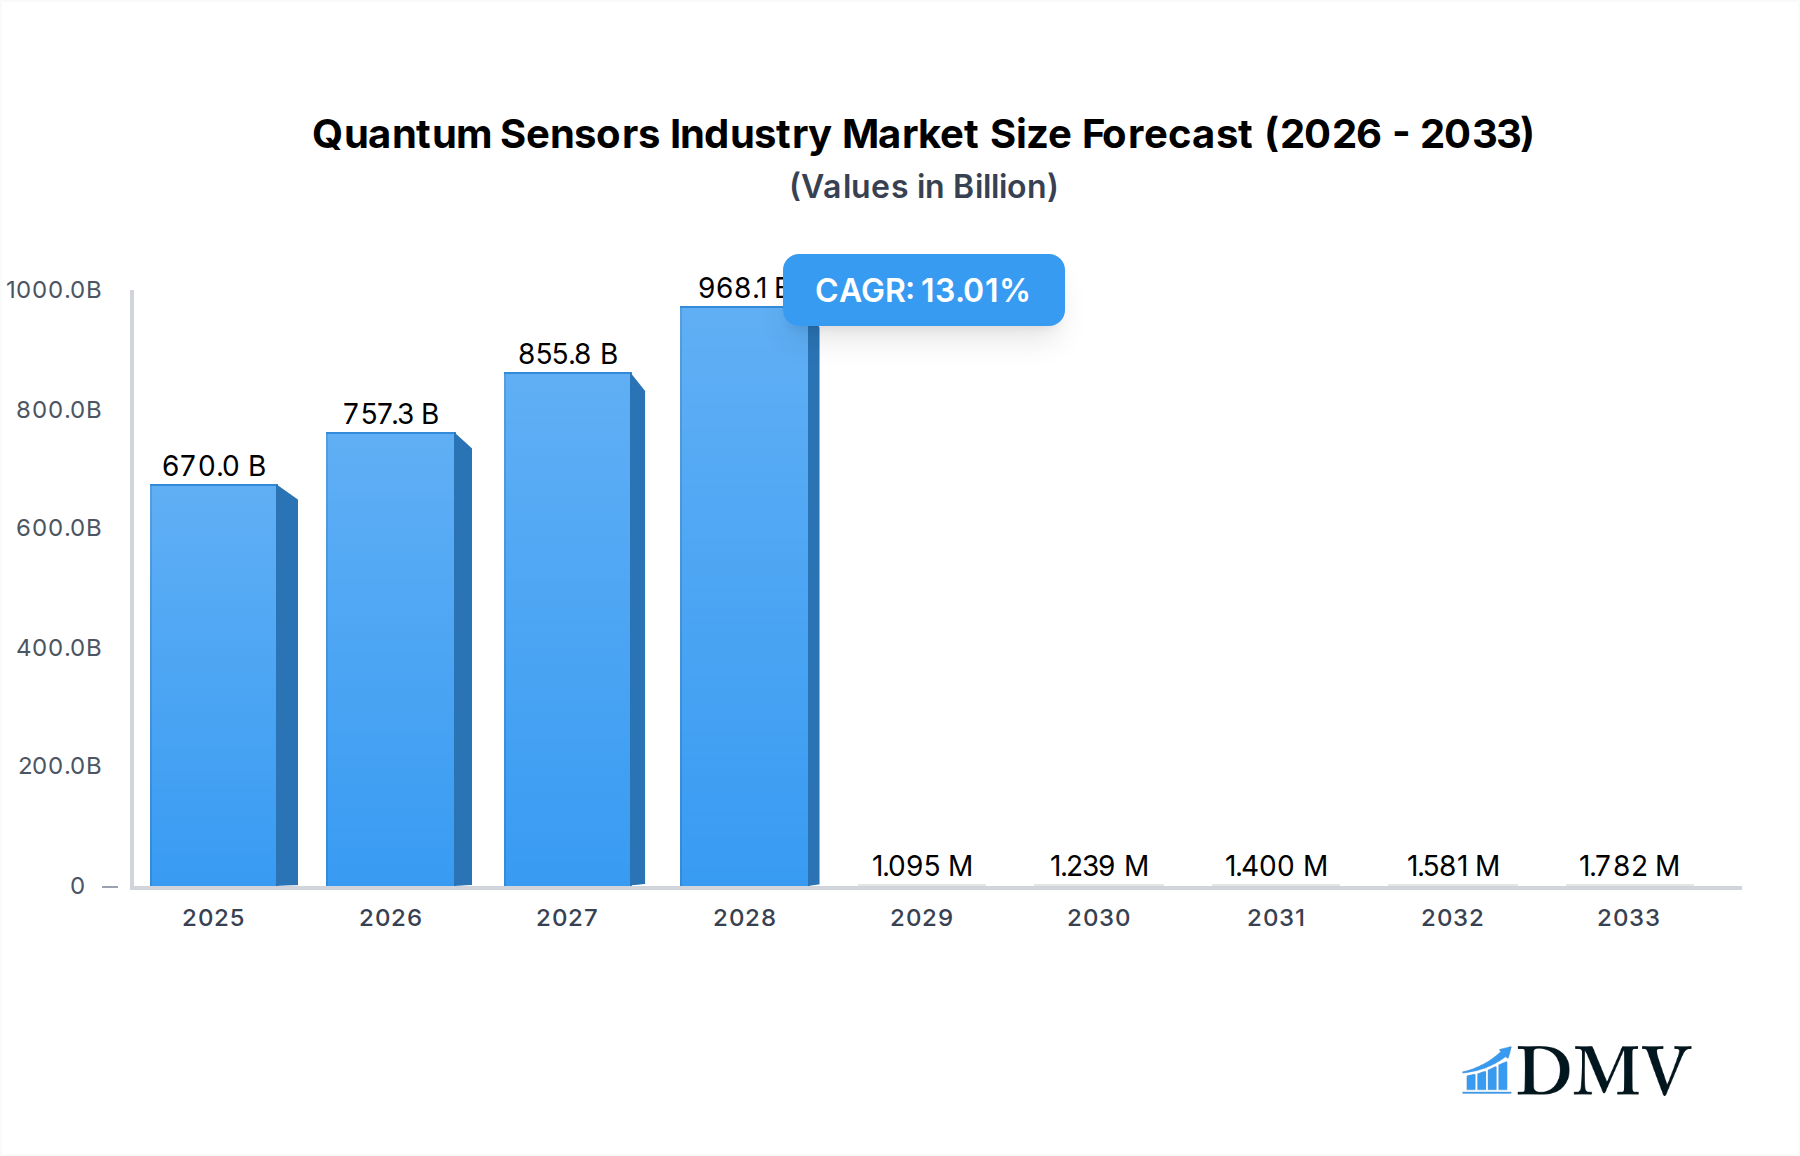
Quantum Sensors Industry Market Size (In Billion)
The Quantum Sensors market is segmented into various product types, with Atomic Clocks, Magnetic Sensors, PAR Quantum Sensors, and Gravity Sensors at the forefront, alongside other specialized product categories. These sophisticated sensors find critical applications in industries such as Military and Defense, Automotive, Oil and Gas, and Healthcare, among others. Geographically, North America, particularly the United States, is expected to lead the market due to substantial investments in quantum technology research and development, coupled with strong government support. Europe, with its advanced industrial base and focus on innovation, also presents a significant market opportunity. The Asia Pacific region, led by China and Japan, is rapidly emerging as a key player, driven by increasing R&D initiatives and government funding for quantum computing and sensing. While the market exhibits strong growth potential, potential restraints such as the high cost of manufacturing advanced quantum sensors and the need for specialized expertise for their operation and maintenance could pose challenges. However, ongoing technological advancements and increasing commercialization efforts are expected to mitigate these limitations, paving the way for sustained market development.

Quantum Sensors Industry Company Market Share
This comprehensive report provides an in-depth analysis of the global Quantum Sensors Industry, offering critical insights into market dynamics, technological advancements, and future growth trajectories. Covering the study period 2019–2033, with a base year of 2025, this report is essential for stakeholders seeking to understand the burgeoning potential of quantum sensing technologies. Our analysis meticulously examines Atomic Clocks, Magnetic Sensors, PAR Quantum Sensors, and Gravity Sensors, alongside Other Product Types, and their applications across Military and Defense, Automotive, Oil and Gas, Healthcare, and Other Applications. Navigate the complexities of this transformative market with data-driven forecasts and strategic recommendations.
Quantum Sensors Industry Market Composition & Trends
The Quantum Sensors Industry is characterized by a dynamic and evolving market concentration, driven by significant innovation catalysts and a complex regulatory landscape. While the market is still in its nascent stages, early indicators suggest a trend towards strategic alliances and potential consolidation as key players jockey for market leadership. The market share distribution is currently fragmented, with specialized technology developers holding significant sway. Innovation is primarily fueled by breakthroughs in quantum physics and advanced materials science. Substitute products, while present in traditional sensing, are rapidly being outpaced by the unparalleled precision and sensitivity offered by quantum sensors. End-user profiles are diverse, ranging from defense contractors and automotive manufacturers to medical researchers and geologists. Mergers and acquisitions (M&A) activities are anticipated to increase as larger corporations recognize the strategic importance of acquiring quantum sensing capabilities. The M&A deal values are expected to escalate, reflecting the high growth potential and technological barriers to entry. This market is poised for substantial disruption, with a CAGR of XX% projected from 2025 to 2033. The total market size is estimated to reach USD XXX Million in 2025, growing to an impressive USD XXX Million by 2033.
Quantum Sensors Industry Industry Evolution
The evolution of the Quantum Sensors Industry is a testament to relentless scientific pursuit and escalating technological demand. Over the historical period 2019–2024, the industry witnessed foundational research and early-stage development, with key breakthroughs in understanding and manipulating quantum phenomena. The base year 2025 marks a pivotal point where early commercialization efforts are gaining momentum, driven by the inherent advantages of quantum sensing, including unprecedented sensitivity, accuracy, and resolution. Market growth trajectories are steep, influenced by a surge in investments from both government agencies and private venture capital firms. Technological advancements are rapidly moving from laboratory settings to practical applications. For instance, the development of highly stable Atomic Clocks is revolutionizing navigation and timekeeping, with adoption rates projected to increase by XX% annually. Magnetic sensors are finding new applications in medical imaging and non-invasive diagnostics, with an anticipated market penetration of XX% by 2028. The growth rate of the quantum sensors market is robust, with analysts forecasting a Compound Annual Growth Rate (CAGR) of XX% from 2025 to 2033. Shifting consumer demands, particularly from industries requiring ultra-precise measurements, are a significant factor. The increasing need for sophisticated detection capabilities in sectors like defense and healthcare is accelerating the adoption of quantum technologies. The transition from traditional sensing to quantum sensing is marked by a gradual but significant shift in R&D focus and commercial product development. As the technology matures, we foresee a broader adoption across various sectors, transforming existing applications and enabling entirely new possibilities. The market size is projected to expand from an estimated USD XXX Million in 2025 to USD XXX Million by 2033.
Leading Regions, Countries, or Segments in Quantum Sensors Industry
North America, particularly the United States, is emerging as a dominant force in the Quantum Sensors Industry, driven by substantial government investment and a robust research ecosystem. The region's leadership is underpinned by a strong emphasis on Military and Defense applications, where the need for advanced surveillance, navigation, and detection technologies is paramount. The US National Science Foundation's recent investment of USD 29 million in quantum sensing research further solidifies this dominance.
Key drivers for North American leadership include:
- Significant R&D Investment: Universities and research institutions across the US are at the forefront of quantum physics research, translating fundamental discoveries into viable sensor technologies.
- Government Funding Initiatives: Programs like those from the National Science Foundation and the Department of Defense provide crucial financial backing for quantum sensor development and deployment.
- Established Defense Sector: The strong demand from the defense sector for next-generation sensing capabilities creates a significant market pull for quantum solutions.
- Technological Innovation Hubs: Regions like Silicon Valley and Boston foster a culture of innovation and attract top talent, accelerating the pace of development.
Within product types, Atomic Clocks are experiencing rapid growth due to their critical role in secure communication, GPS, and scientific research, with an anticipated XX% market share in 2025. Magnetic Sensors are also gaining traction, particularly for their application in advanced medical imaging (MRI) and non-invasive diagnostics, projected to capture XX% of the market. The Automotive sector is showing increasing interest in quantum sensors for enhanced ADAS (Advanced Driver-Assistance Systems) and autonomous driving, although adoption is still in its early stages, projected at XX% market share. The Oil and Gas industry is exploring quantum sensors for subterranean mineral deposit detection and enhanced exploration, with a projected XX% market share. Healthcare applications, beyond medical imaging, are emerging in areas like disease detection at the cellular level, representing a growing segment with a XX% projected market share. The dominance of North America is further amplified by the Military and Defense sector's substantial allocation of resources towards quantum sensing, which is expected to account for XX% of the total market in 2025.
Quantum Sensors Industry Product Innovations
The Quantum Sensors Industry is witnessing groundbreaking product innovations, pushing the boundaries of measurement precision. Companies are developing highly sensitive Magnetic Sensors capable of detecting minuscule magnetic fields for medical diagnostics and geophysical surveys. Advancements in Atomic Clocks are yielding unprecedented accuracy for navigation and fundamental physics research. Furthermore, novel PAR Quantum Sensors are enhancing agricultural productivity through precise light measurement. The unique selling propositions of these innovations lie in their ability to perform measurements that were previously impossible, offering orders of magnitude improvement in sensitivity and resolution. Performance metrics such as picotesla sensitivity in magnetic field detection and femtosecond timing accuracy in atomic clocks are becoming industry standards.
Propelling Factors for Quantum Sensors Industry Growth
The Quantum Sensors Industry is propelled by a confluence of powerful technological, economic, and regulatory factors. Technologically, the inherent precision and sensitivity of quantum phenomena like superposition and entanglement enable sensors that surpass the performance of classical counterparts. This leads to breakthroughs in fields such as medical diagnostics (pinpointing infections within individual cells) and resource exploration (finding subterranean mineral deposits). Economically, increasing global demand for high-precision measurements across industries like defense, automotive, and healthcare fuels market expansion. Government funding, as exemplified by the US National Science Foundation's USD 29 million investment in quantum sensing research, acts as a significant catalyst. Regulatory support, including national quantum initiatives and standardization efforts, further encourages development and adoption, creating a fertile ground for growth.
Obstacles in the Quantum Sensors Industry Market
Despite its immense potential, the Quantum Sensors Industry faces several significant obstacles. High development costs associated with intricate quantum technologies and specialized manufacturing processes represent a substantial financial barrier. The complexity of these sensors also translates into challenges in terms of user-friendliness and integration into existing systems, requiring specialized expertise for operation and maintenance. Supply chain disruptions for critical quantum materials and components can also hinder production scalability. Furthermore, the nascent stage of the market means that standards and regulations are still evolving, creating uncertainty for widespread adoption. The competition from established classical sensing technologies, while being outperformed, still holds a significant market presence and brand recognition, posing a competitive pressure that needs to be overcome. The projected impact of these obstacles on market growth is estimated to be a reduction in the otherwise projected CAGR by approximately XX%.
Future Opportunities in Quantum Sensors Industry
The Quantum Sensors Industry is ripe with future opportunities, driven by emerging technologies and evolving consumer trends. The miniaturization of quantum sensors holds the promise of widespread integration into portable devices for health monitoring and environmental sensing. Advances in quantum computing are expected to create synergistic opportunities, enabling the development of even more sophisticated quantum sensor systems. New markets are opening up in areas like quantum communication security and advanced material characterization. Furthermore, the growing global emphasis on sustainability and climate monitoring presents a significant opportunity for quantum sensors in applications like precise environmental sensing and geological surveys, potentially expanding the market by an estimated XX% over the next decade.
Major Players in the Quantum Sensors Industry Ecosystem
Campbell Scientific Ltd LI-COR Inc AOSense Inc Muquans SAS M Squared Lasers Limited Skye Instruments Ltd Robert Bosch GmbH Apogee Instrument Inc
Key Developments in Quantum Sensors Industry Industry
- April 2024: The US National Science Foundation invested USD 29 million to assist 18 teams of researchers at universities across the United States to explore quantum sensing. Each research team will receive around USD 2 million over four years to research quantum phenomena, such as entanglement, to create sensors to assist in things that would otherwise be impossible. Quantum sensors can enable experts to pinpoint infections inside individual cells and find subterranean mineral deposits.
- January 2024: The Brazilian government announced a new industrial policy with development goals and measures up to 2033. The new policies are expected to directly improve people's daily lives, stimulate production and technology development, increase the competitiveness of the Brazilian industry, provide investment guidance, promote better jobs, and enhance the country's qualified presence in the international market.
Strategic Quantum Sensors Industry Market Forecast
The Quantum Sensors Industry is poised for significant expansion, driven by relentless innovation and increasing demand for ultra-precise measurement capabilities. Future growth catalysts include the ongoing exploration of quantum phenomena for novel applications, particularly in fields like quantum computing and advanced materials science. The strategic investments from governments and private entities underscore the anticipated market potential. As research translates into commercial products, we expect a broader adoption across key sectors such as defense, healthcare, and automotive. The market's trajectory is set to be characterized by rapid technological advancements, leading to the development of sensors with unprecedented sensitivity and accuracy, further solidifying its position as a transformative industry. The market is projected to grow from USD XXX Million in 2025 to USD XXX Million by 2033, exhibiting a CAGR of XX%.
Quantum Sensors Industry Segmentation
-
1. Product Type
- 1.1. Atomic Clocks
- 1.2. Magnetic Sensors
- 1.3. PAR Quantum Sensors
- 1.4. Gravity Sensors
- 1.5. Other Product Types
-
2. Application
- 2.1. Military and Defense
- 2.2. Automotive
- 2.3. Oil and Gas
- 2.4. Healthcare
- 2.5. Other Applications
Quantum Sensors Industry Segmentation By Geography
-
1. North America
- 1.1. United States
- 1.2. Canada
- 1.3. Mexico
-
2. Europe
- 2.1. Germany
- 2.2. United Kingdom
- 2.3. France
- 2.4. Italy
- 2.5. Spain
- 2.6. Rest of Europe
-
3. Asia
- 3.1. China
- 3.2. Japan
- 3.3. India
- 3.4. Australia
- 3.5. South Korea
- 3.6. Rest of Asia Pacific
-
4. Middle East and Africa
- 4.1. UAE
- 4.2. South Africa
- 4.3. Saudi Arabia
- 4.4. Rest Of MEA
-
5. Latin America
- 5.1. Brazil
- 5.2. Argentina
- 5.3. Rest of South America

Quantum Sensors Industry Regional Market Share
Geographic Coverage of Quantum Sensors Industry
Quantum Sensors Industry REPORT HIGHLIGHTS
| Aspects | Details |
|---|---|
| Study Period | 2020-2034 |
| Base Year | 2025 |
| Estimated Year | 2026 |
| Forecast Period | 2026-2034 |
| Historical Period | 2020-2025 |
| Growth Rate | CAGR of 12.95% from 2020-2034 |
| Segmentation |
|
Table of Contents
- 1. Introduction
- 1.1. Research Scope
- 1.2. Market Segmentation
- 1.3. Research Objective
- 1.4. Definitions and Assumptions
- 2. Executive Summary
- 2.1. Market Snapshot
- 3. Market Dynamics
- 3.1. Market Drivers
- 3.2. Market Restrains
- 3.3. Market Trends
- 3.4. Market Opportunities
- 4. Market Factor Analysis
- 4.1. Porters Five Forces
- 4.1.1. Bargaining Power of Suppliers
- 4.1.2. Bargaining Power of Buyers
- 4.1.3. Threat of New Entrants
- 4.1.4. Threat of Substitutes
- 4.1.5. Competitive Rivalry
- 4.2. PESTEL analysis
- 4.3. BCG Analysis
- 4.3.1. Stars (High Growth, High Market Share)
- 4.3.2. Cash Cows (Low Growth, High Market Share)
- 4.3.3. Question Mark (High Growth, Low Market Share)
- 4.3.4. Dogs (Low Growth, Low Market Share)
- 4.4. Ansoff Matrix Analysis
- 4.5. Supply Chain Analysis
- 4.6. Regulatory Landscape
- 4.7. Current Market Potential and Opportunity Assessment (TAM–SAM–SOM Framework)
- 4.8. DMV Analyst Note
- 4.1. Porters Five Forces
- 5. Market Analysis, Insights and Forecast 2021-2033
- 5.1. Market Analysis, Insights and Forecast - by Product Type
- 5.1.1. Atomic Clocks
- 5.1.2. Magnetic Sensors
- 5.1.3. PAR Quantum Sensors
- 5.1.4. Gravity Sensors
- 5.1.5. Other Product Types
- 5.2. Market Analysis, Insights and Forecast - by Application
- 5.2.1. Military and Defense
- 5.2.2. Automotive
- 5.2.3. Oil and Gas
- 5.2.4. Healthcare
- 5.2.5. Other Applications
- 5.3. Market Analysis, Insights and Forecast - by Region
- 5.3.1. North America
- 5.3.2. Europe
- 5.3.3. Asia
- 5.3.4. Middle East and Africa
- 5.3.5. Latin America
- 5.1. Market Analysis, Insights and Forecast - by Product Type
- 6. Global Quantum Sensors Industry Analysis, Insights and Forecast, 2021-2033
- 6.1. Market Analysis, Insights and Forecast - by Product Type
- 6.1.1. Atomic Clocks
- 6.1.2. Magnetic Sensors
- 6.1.3. PAR Quantum Sensors
- 6.1.4. Gravity Sensors
- 6.1.5. Other Product Types
- 6.2. Market Analysis, Insights and Forecast - by Application
- 6.2.1. Military and Defense
- 6.2.2. Automotive
- 6.2.3. Oil and Gas
- 6.2.4. Healthcare
- 6.2.5. Other Applications
- 6.1. Market Analysis, Insights and Forecast - by Product Type
- 7. North America Quantum Sensors Industry Analysis, Insights and Forecast, 2020-2032
- 7.1. Market Analysis, Insights and Forecast - by Product Type
- 7.1.1. Atomic Clocks
- 7.1.2. Magnetic Sensors
- 7.1.3. PAR Quantum Sensors
- 7.1.4. Gravity Sensors
- 7.1.5. Other Product Types
- 7.2. Market Analysis, Insights and Forecast - by Application
- 7.2.1. Military and Defense
- 7.2.2. Automotive
- 7.2.3. Oil and Gas
- 7.2.4. Healthcare
- 7.2.5. Other Applications
- 7.1. Market Analysis, Insights and Forecast - by Product Type
- 8. Europe Quantum Sensors Industry Analysis, Insights and Forecast, 2020-2032
- 8.1. Market Analysis, Insights and Forecast - by Product Type
- 8.1.1. Atomic Clocks
- 8.1.2. Magnetic Sensors
- 8.1.3. PAR Quantum Sensors
- 8.1.4. Gravity Sensors
- 8.1.5. Other Product Types
- 8.2. Market Analysis, Insights and Forecast - by Application
- 8.2.1. Military and Defense
- 8.2.2. Automotive
- 8.2.3. Oil and Gas
- 8.2.4. Healthcare
- 8.2.5. Other Applications
- 8.1. Market Analysis, Insights and Forecast - by Product Type
- 9. Asia Quantum Sensors Industry Analysis, Insights and Forecast, 2020-2032
- 9.1. Market Analysis, Insights and Forecast - by Product Type
- 9.1.1. Atomic Clocks
- 9.1.2. Magnetic Sensors
- 9.1.3. PAR Quantum Sensors
- 9.1.4. Gravity Sensors
- 9.1.5. Other Product Types
- 9.2. Market Analysis, Insights and Forecast - by Application
- 9.2.1. Military and Defense
- 9.2.2. Automotive
- 9.2.3. Oil and Gas
- 9.2.4. Healthcare
- 9.2.5. Other Applications
- 9.1. Market Analysis, Insights and Forecast - by Product Type
- 10. Middle East and Africa Quantum Sensors Industry Analysis, Insights and Forecast, 2020-2032
- 10.1. Market Analysis, Insights and Forecast - by Product Type
- 10.1.1. Atomic Clocks
- 10.1.2. Magnetic Sensors
- 10.1.3. PAR Quantum Sensors
- 10.1.4. Gravity Sensors
- 10.1.5. Other Product Types
- 10.2. Market Analysis, Insights and Forecast - by Application
- 10.2.1. Military and Defense
- 10.2.2. Automotive
- 10.2.3. Oil and Gas
- 10.2.4. Healthcare
- 10.2.5. Other Applications
- 10.1. Market Analysis, Insights and Forecast - by Product Type
- 11. Latin America Quantum Sensors Industry Analysis, Insights and Forecast, 2020-2032
- 11.1. Market Analysis, Insights and Forecast - by Product Type
- 11.1.1. Atomic Clocks
- 11.1.2. Magnetic Sensors
- 11.1.3. PAR Quantum Sensors
- 11.1.4. Gravity Sensors
- 11.1.5. Other Product Types
- 11.2. Market Analysis, Insights and Forecast - by Application
- 11.2.1. Military and Defense
- 11.2.2. Automotive
- 11.2.3. Oil and Gas
- 11.2.4. Healthcare
- 11.2.5. Other Applications
- 11.1. Market Analysis, Insights and Forecast - by Product Type
- 12. Competitive Analysis
- 12.1. Company Profiles
- 12.1.1 Campbell Scientific Ltd
- 12.1.1.1. Company Overview
- 12.1.1.2. Products
- 12.1.1.3. Company Financials
- 12.1.1.4. SWOT Analysis
- 12.1.2 LI-COR Inc
- 12.1.2.1. Company Overview
- 12.1.2.2. Products
- 12.1.2.3. Company Financials
- 12.1.2.4. SWOT Analysis
- 12.1.3 AOSense Inc
- 12.1.3.1. Company Overview
- 12.1.3.2. Products
- 12.1.3.3. Company Financials
- 12.1.3.4. SWOT Analysis
- 12.1.4 Muquans SAS
- 12.1.4.1. Company Overview
- 12.1.4.2. Products
- 12.1.4.3. Company Financials
- 12.1.4.4. SWOT Analysis
- 12.1.5 M Squared Lasers Limited
- 12.1.5.1. Company Overview
- 12.1.5.2. Products
- 12.1.5.3. Company Financials
- 12.1.5.4. SWOT Analysis
- 12.1.6 Skye Instruments Ltd
- 12.1.6.1. Company Overview
- 12.1.6.2. Products
- 12.1.6.3. Company Financials
- 12.1.6.4. SWOT Analysis
- 12.1.7 Robert Bosch GmbH
- 12.1.7.1. Company Overview
- 12.1.7.2. Products
- 12.1.7.3. Company Financials
- 12.1.7.4. SWOT Analysis
- 12.1.8 Apogee Instrument Inc
- 12.1.8.1. Company Overview
- 12.1.8.2. Products
- 12.1.8.3. Company Financials
- 12.1.8.4. SWOT Analysis
- 12.1.1 Campbell Scientific Ltd
- 12.2. Market Entropy
- 12.2.1 Company's Key Areas Served
- 12.2.2 Recent Developments
- 12.3. Company Market Share Analysis 2025
- 12.3.1 Top 5 Companies Market Share Analysis
- 12.3.2 Top 3 Companies Market Share Analysis
- 12.4. List of Potential Customers
- 13. Research Methodology
List of Figures
- Figure 1: Global Quantum Sensors Industry Revenue Breakdown (Million, %) by Region 2025 & 2033
- Figure 2: Global Quantum Sensors Industry Volume Breakdown (K Unit, %) by Region 2025 & 2033
- Figure 3: North America Quantum Sensors Industry Revenue (Million), by Product Type 2025 & 2033
- Figure 4: North America Quantum Sensors Industry Volume (K Unit), by Product Type 2025 & 2033
- Figure 5: North America Quantum Sensors Industry Revenue Share (%), by Product Type 2025 & 2033
- Figure 6: North America Quantum Sensors Industry Volume Share (%), by Product Type 2025 & 2033
- Figure 7: North America Quantum Sensors Industry Revenue (Million), by Application 2025 & 2033
- Figure 8: North America Quantum Sensors Industry Volume (K Unit), by Application 2025 & 2033
- Figure 9: North America Quantum Sensors Industry Revenue Share (%), by Application 2025 & 2033
- Figure 10: North America Quantum Sensors Industry Volume Share (%), by Application 2025 & 2033
- Figure 11: North America Quantum Sensors Industry Revenue (Million), by Country 2025 & 2033
- Figure 12: North America Quantum Sensors Industry Volume (K Unit), by Country 2025 & 2033
- Figure 13: North America Quantum Sensors Industry Revenue Share (%), by Country 2025 & 2033
- Figure 14: North America Quantum Sensors Industry Volume Share (%), by Country 2025 & 2033
- Figure 15: Europe Quantum Sensors Industry Revenue (Million), by Product Type 2025 & 2033
- Figure 16: Europe Quantum Sensors Industry Volume (K Unit), by Product Type 2025 & 2033
- Figure 17: Europe Quantum Sensors Industry Revenue Share (%), by Product Type 2025 & 2033
- Figure 18: Europe Quantum Sensors Industry Volume Share (%), by Product Type 2025 & 2033
- Figure 19: Europe Quantum Sensors Industry Revenue (Million), by Application 2025 & 2033
- Figure 20: Europe Quantum Sensors Industry Volume (K Unit), by Application 2025 & 2033
- Figure 21: Europe Quantum Sensors Industry Revenue Share (%), by Application 2025 & 2033
- Figure 22: Europe Quantum Sensors Industry Volume Share (%), by Application 2025 & 2033
- Figure 23: Europe Quantum Sensors Industry Revenue (Million), by Country 2025 & 2033
- Figure 24: Europe Quantum Sensors Industry Volume (K Unit), by Country 2025 & 2033
- Figure 25: Europe Quantum Sensors Industry Revenue Share (%), by Country 2025 & 2033
- Figure 26: Europe Quantum Sensors Industry Volume Share (%), by Country 2025 & 2033
- Figure 27: Asia Quantum Sensors Industry Revenue (Million), by Product Type 2025 & 2033
- Figure 28: Asia Quantum Sensors Industry Volume (K Unit), by Product Type 2025 & 2033
- Figure 29: Asia Quantum Sensors Industry Revenue Share (%), by Product Type 2025 & 2033
- Figure 30: Asia Quantum Sensors Industry Volume Share (%), by Product Type 2025 & 2033
- Figure 31: Asia Quantum Sensors Industry Revenue (Million), by Application 2025 & 2033
- Figure 32: Asia Quantum Sensors Industry Volume (K Unit), by Application 2025 & 2033
- Figure 33: Asia Quantum Sensors Industry Revenue Share (%), by Application 2025 & 2033
- Figure 34: Asia Quantum Sensors Industry Volume Share (%), by Application 2025 & 2033
- Figure 35: Asia Quantum Sensors Industry Revenue (Million), by Country 2025 & 2033
- Figure 36: Asia Quantum Sensors Industry Volume (K Unit), by Country 2025 & 2033
- Figure 37: Asia Quantum Sensors Industry Revenue Share (%), by Country 2025 & 2033
- Figure 38: Asia Quantum Sensors Industry Volume Share (%), by Country 2025 & 2033
- Figure 39: Middle East and Africa Quantum Sensors Industry Revenue (Million), by Product Type 2025 & 2033
- Figure 40: Middle East and Africa Quantum Sensors Industry Volume (K Unit), by Product Type 2025 & 2033
- Figure 41: Middle East and Africa Quantum Sensors Industry Revenue Share (%), by Product Type 2025 & 2033
- Figure 42: Middle East and Africa Quantum Sensors Industry Volume Share (%), by Product Type 2025 & 2033
- Figure 43: Middle East and Africa Quantum Sensors Industry Revenue (Million), by Application 2025 & 2033
- Figure 44: Middle East and Africa Quantum Sensors Industry Volume (K Unit), by Application 2025 & 2033
- Figure 45: Middle East and Africa Quantum Sensors Industry Revenue Share (%), by Application 2025 & 2033
- Figure 46: Middle East and Africa Quantum Sensors Industry Volume Share (%), by Application 2025 & 2033
- Figure 47: Middle East and Africa Quantum Sensors Industry Revenue (Million), by Country 2025 & 2033
- Figure 48: Middle East and Africa Quantum Sensors Industry Volume (K Unit), by Country 2025 & 2033
- Figure 49: Middle East and Africa Quantum Sensors Industry Revenue Share (%), by Country 2025 & 2033
- Figure 50: Middle East and Africa Quantum Sensors Industry Volume Share (%), by Country 2025 & 2033
- Figure 51: Latin America Quantum Sensors Industry Revenue (Million), by Product Type 2025 & 2033
- Figure 52: Latin America Quantum Sensors Industry Volume (K Unit), by Product Type 2025 & 2033
- Figure 53: Latin America Quantum Sensors Industry Revenue Share (%), by Product Type 2025 & 2033
- Figure 54: Latin America Quantum Sensors Industry Volume Share (%), by Product Type 2025 & 2033
- Figure 55: Latin America Quantum Sensors Industry Revenue (Million), by Application 2025 & 2033
- Figure 56: Latin America Quantum Sensors Industry Volume (K Unit), by Application 2025 & 2033
- Figure 57: Latin America Quantum Sensors Industry Revenue Share (%), by Application 2025 & 2033
- Figure 58: Latin America Quantum Sensors Industry Volume Share (%), by Application 2025 & 2033
- Figure 59: Latin America Quantum Sensors Industry Revenue (Million), by Country 2025 & 2033
- Figure 60: Latin America Quantum Sensors Industry Volume (K Unit), by Country 2025 & 2033
- Figure 61: Latin America Quantum Sensors Industry Revenue Share (%), by Country 2025 & 2033
- Figure 62: Latin America Quantum Sensors Industry Volume Share (%), by Country 2025 & 2033
List of Tables
- Table 1: Global Quantum Sensors Industry Revenue Million Forecast, by Product Type 2020 & 2033
- Table 2: Global Quantum Sensors Industry Volume K Unit Forecast, by Product Type 2020 & 2033
- Table 3: Global Quantum Sensors Industry Revenue Million Forecast, by Application 2020 & 2033
- Table 4: Global Quantum Sensors Industry Volume K Unit Forecast, by Application 2020 & 2033
- Table 5: Global Quantum Sensors Industry Revenue Million Forecast, by Region 2020 & 2033
- Table 6: Global Quantum Sensors Industry Volume K Unit Forecast, by Region 2020 & 2033
- Table 7: Global Quantum Sensors Industry Revenue Million Forecast, by Product Type 2020 & 2033
- Table 8: Global Quantum Sensors Industry Volume K Unit Forecast, by Product Type 2020 & 2033
- Table 9: Global Quantum Sensors Industry Revenue Million Forecast, by Application 2020 & 2033
- Table 10: Global Quantum Sensors Industry Volume K Unit Forecast, by Application 2020 & 2033
- Table 11: Global Quantum Sensors Industry Revenue Million Forecast, by Country 2020 & 2033
- Table 12: Global Quantum Sensors Industry Volume K Unit Forecast, by Country 2020 & 2033
- Table 13: United States Quantum Sensors Industry Revenue (Million) Forecast, by Application 2020 & 2033
- Table 14: United States Quantum Sensors Industry Volume (K Unit) Forecast, by Application 2020 & 2033
- Table 15: Canada Quantum Sensors Industry Revenue (Million) Forecast, by Application 2020 & 2033
- Table 16: Canada Quantum Sensors Industry Volume (K Unit) Forecast, by Application 2020 & 2033
- Table 17: Mexico Quantum Sensors Industry Revenue (Million) Forecast, by Application 2020 & 2033
- Table 18: Mexico Quantum Sensors Industry Volume (K Unit) Forecast, by Application 2020 & 2033
- Table 19: Global Quantum Sensors Industry Revenue Million Forecast, by Product Type 2020 & 2033
- Table 20: Global Quantum Sensors Industry Volume K Unit Forecast, by Product Type 2020 & 2033
- Table 21: Global Quantum Sensors Industry Revenue Million Forecast, by Application 2020 & 2033
- Table 22: Global Quantum Sensors Industry Volume K Unit Forecast, by Application 2020 & 2033
- Table 23: Global Quantum Sensors Industry Revenue Million Forecast, by Country 2020 & 2033
- Table 24: Global Quantum Sensors Industry Volume K Unit Forecast, by Country 2020 & 2033
- Table 25: Germany Quantum Sensors Industry Revenue (Million) Forecast, by Application 2020 & 2033
- Table 26: Germany Quantum Sensors Industry Volume (K Unit) Forecast, by Application 2020 & 2033
- Table 27: United Kingdom Quantum Sensors Industry Revenue (Million) Forecast, by Application 2020 & 2033
- Table 28: United Kingdom Quantum Sensors Industry Volume (K Unit) Forecast, by Application 2020 & 2033
- Table 29: France Quantum Sensors Industry Revenue (Million) Forecast, by Application 2020 & 2033
- Table 30: France Quantum Sensors Industry Volume (K Unit) Forecast, by Application 2020 & 2033
- Table 31: Italy Quantum Sensors Industry Revenue (Million) Forecast, by Application 2020 & 2033
- Table 32: Italy Quantum Sensors Industry Volume (K Unit) Forecast, by Application 2020 & 2033
- Table 33: Spain Quantum Sensors Industry Revenue (Million) Forecast, by Application 2020 & 2033
- Table 34: Spain Quantum Sensors Industry Volume (K Unit) Forecast, by Application 2020 & 2033
- Table 35: Rest of Europe Quantum Sensors Industry Revenue (Million) Forecast, by Application 2020 & 2033
- Table 36: Rest of Europe Quantum Sensors Industry Volume (K Unit) Forecast, by Application 2020 & 2033
- Table 37: Global Quantum Sensors Industry Revenue Million Forecast, by Product Type 2020 & 2033
- Table 38: Global Quantum Sensors Industry Volume K Unit Forecast, by Product Type 2020 & 2033
- Table 39: Global Quantum Sensors Industry Revenue Million Forecast, by Application 2020 & 2033
- Table 40: Global Quantum Sensors Industry Volume K Unit Forecast, by Application 2020 & 2033
- Table 41: Global Quantum Sensors Industry Revenue Million Forecast, by Country 2020 & 2033
- Table 42: Global Quantum Sensors Industry Volume K Unit Forecast, by Country 2020 & 2033
- Table 43: China Quantum Sensors Industry Revenue (Million) Forecast, by Application 2020 & 2033
- Table 44: China Quantum Sensors Industry Volume (K Unit) Forecast, by Application 2020 & 2033
- Table 45: Japan Quantum Sensors Industry Revenue (Million) Forecast, by Application 2020 & 2033
- Table 46: Japan Quantum Sensors Industry Volume (K Unit) Forecast, by Application 2020 & 2033
- Table 47: India Quantum Sensors Industry Revenue (Million) Forecast, by Application 2020 & 2033
- Table 48: India Quantum Sensors Industry Volume (K Unit) Forecast, by Application 2020 & 2033
- Table 49: Australia Quantum Sensors Industry Revenue (Million) Forecast, by Application 2020 & 2033
- Table 50: Australia Quantum Sensors Industry Volume (K Unit) Forecast, by Application 2020 & 2033
- Table 51: South Korea Quantum Sensors Industry Revenue (Million) Forecast, by Application 2020 & 2033
- Table 52: South Korea Quantum Sensors Industry Volume (K Unit) Forecast, by Application 2020 & 2033
- Table 53: Rest of Asia Pacific Quantum Sensors Industry Revenue (Million) Forecast, by Application 2020 & 2033
- Table 54: Rest of Asia Pacific Quantum Sensors Industry Volume (K Unit) Forecast, by Application 2020 & 2033
- Table 55: Global Quantum Sensors Industry Revenue Million Forecast, by Product Type 2020 & 2033
- Table 56: Global Quantum Sensors Industry Volume K Unit Forecast, by Product Type 2020 & 2033
- Table 57: Global Quantum Sensors Industry Revenue Million Forecast, by Application 2020 & 2033
- Table 58: Global Quantum Sensors Industry Volume K Unit Forecast, by Application 2020 & 2033
- Table 59: Global Quantum Sensors Industry Revenue Million Forecast, by Country 2020 & 2033
- Table 60: Global Quantum Sensors Industry Volume K Unit Forecast, by Country 2020 & 2033
- Table 61: UAE Quantum Sensors Industry Revenue (Million) Forecast, by Application 2020 & 2033
- Table 62: UAE Quantum Sensors Industry Volume (K Unit) Forecast, by Application 2020 & 2033
- Table 63: South Africa Quantum Sensors Industry Revenue (Million) Forecast, by Application 2020 & 2033
- Table 64: South Africa Quantum Sensors Industry Volume (K Unit) Forecast, by Application 2020 & 2033
- Table 65: Saudi Arabia Quantum Sensors Industry Revenue (Million) Forecast, by Application 2020 & 2033
- Table 66: Saudi Arabia Quantum Sensors Industry Volume (K Unit) Forecast, by Application 2020 & 2033
- Table 67: Rest Of MEA Quantum Sensors Industry Revenue (Million) Forecast, by Application 2020 & 2033
- Table 68: Rest Of MEA Quantum Sensors Industry Volume (K Unit) Forecast, by Application 2020 & 2033
- Table 69: Global Quantum Sensors Industry Revenue Million Forecast, by Product Type 2020 & 2033
- Table 70: Global Quantum Sensors Industry Volume K Unit Forecast, by Product Type 2020 & 2033
- Table 71: Global Quantum Sensors Industry Revenue Million Forecast, by Application 2020 & 2033
- Table 72: Global Quantum Sensors Industry Volume K Unit Forecast, by Application 2020 & 2033
- Table 73: Global Quantum Sensors Industry Revenue Million Forecast, by Country 2020 & 2033
- Table 74: Global Quantum Sensors Industry Volume K Unit Forecast, by Country 2020 & 2033
- Table 75: Brazil Quantum Sensors Industry Revenue (Million) Forecast, by Application 2020 & 2033
- Table 76: Brazil Quantum Sensors Industry Volume (K Unit) Forecast, by Application 2020 & 2033
- Table 77: Argentina Quantum Sensors Industry Revenue (Million) Forecast, by Application 2020 & 2033
- Table 78: Argentina Quantum Sensors Industry Volume (K Unit) Forecast, by Application 2020 & 2033
- Table 79: Rest of South America Quantum Sensors Industry Revenue (Million) Forecast, by Application 2020 & 2033
- Table 80: Rest of South America Quantum Sensors Industry Volume (K Unit) Forecast, by Application 2020 & 2033
Frequently Asked Questions
1. What is the projected Compound Annual Growth Rate (CAGR) of the Quantum Sensors Industry?
The projected CAGR is approximately 12.95%.
2. Which companies are prominent players in the Quantum Sensors Industry?
Key companies in the market include Campbell Scientific Ltd, LI-COR Inc, AOSense Inc, Muquans SAS, M Squared Lasers Limited, Skye Instruments Ltd, Robert Bosch GmbH, Apogee Instrument Inc.
3. What are the main segments of the Quantum Sensors Industry?
The market segments include Product Type, Application.
4. Can you provide details about the market size?
The market size is estimated to be USD 0.67 Million as of 2022.
5. What are some drivers contributing to market growth?
Increasing Research Activities in the Quantum Field; Increasing Investment in Space Communication.
6. What are the notable trends driving market growth?
Oil and Gas Industry to Grow Significantly.
7. Are there any restraints impacting market growth?
High Deployment and Maintenance Costs.
8. Can you provide examples of recent developments in the market?
April 2024: The US National Science Foundation invested USD 29 million to assist 18 teams of researchers at universities across the United States to explore quantum sensing. Each research team will receive around USD 2 million over four years to research quantum phenomena, such as entanglement, to create sensors to assist in things that would otherwise be impossible. Quantum sensors can enable experts to pinpoint infections inside individual cells and find subterranean mineral deposits.
9. What pricing options are available for accessing the report?
Pricing options include single-user, multi-user, and enterprise licenses priced at USD 4750, USD 5250, and USD 8750 respectively.
10. Is the market size provided in terms of value or volume?
The market size is provided in terms of value, measured in Million and volume, measured in K Unit.
11. Are there any specific market keywords associated with the report?
Yes, the market keyword associated with the report is "Quantum Sensors Industry," which aids in identifying and referencing the specific market segment covered.
12. How do I determine which pricing option suits my needs best?
The pricing options vary based on user requirements and access needs. Individual users may opt for single-user licenses, while businesses requiring broader access may choose multi-user or enterprise licenses for cost-effective access to the report.
13. Are there any additional resources or data provided in the Quantum Sensors Industry report?
While the report offers comprehensive insights, it's advisable to review the specific contents or supplementary materials provided to ascertain if additional resources or data are available.
14. How can I stay updated on further developments or reports in the Quantum Sensors Industry?
To stay informed about further developments, trends, and reports in the Quantum Sensors Industry, consider subscribing to industry newsletters, following relevant companies and organizations, or regularly checking reputable industry news sources and publications.
Methodology
Step 1 - Identification of Relevant Samples Size from Population Database


Step 2 - Approaches for Defining Global Market Size (Value, Volume* & Price*)

Note*: In applicable scenarios
Step 3 - Data Sources
Primary Research
- Web Analytics
- Survey Reports
- Research Institute
- Latest Research Reports
- Opinion Leaders
Secondary Research
- Annual Reports
- White Paper
- Latest Press Release
- Industry Association
- Paid Database
- Investor Presentations

Step 4 - Data Triangulation
Involves using different sources of information in order to increase the validity of a study
These sources are likely to be stakeholders in a program - participants, other researchers, program staff, other community members, and so on.
Then we put all data in single framework & apply various statistical tools to find out the dynamic on the market.
During the analysis stage, feedback from the stakeholder groups would be compared to determine areas of agreement as well as areas of divergence