

Key Insights
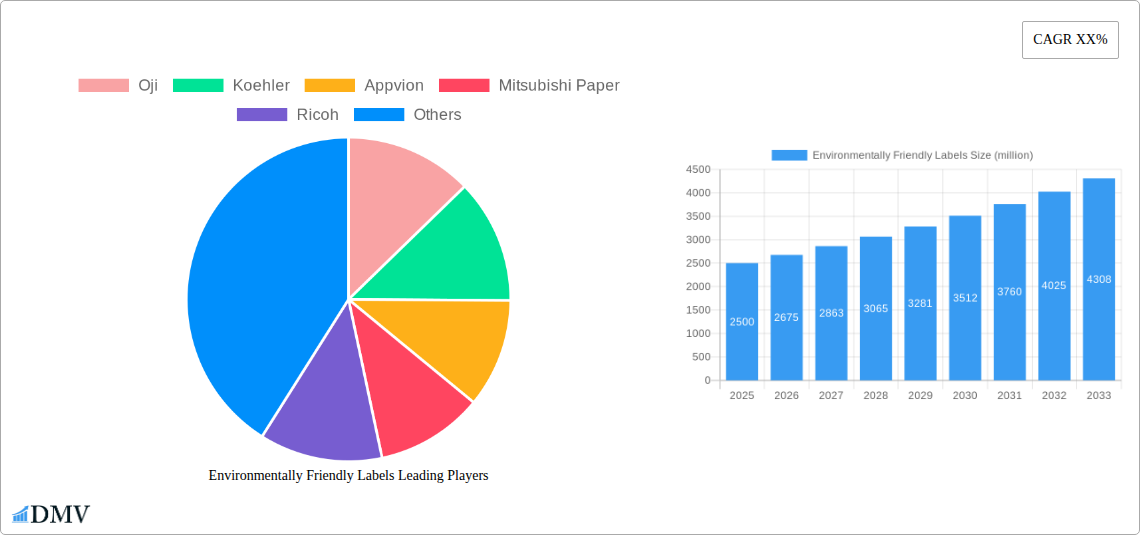
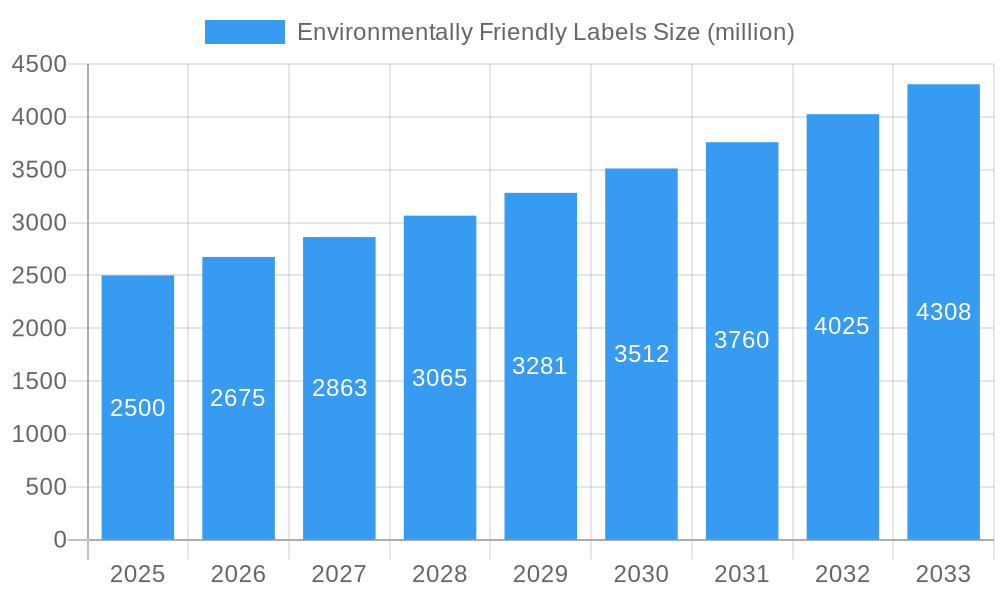
The environmentally friendly labels market is experiencing robust growth, driven by increasing consumer awareness of sustainability and stringent government regulations aimed at reducing plastic waste and promoting eco-conscious packaging. This market, estimated at $2.5 billion in 2025, is projected to achieve a Compound Annual Growth Rate (CAGR) of 7% from 2025 to 2033, reaching approximately $4.5 billion by 2033. Key drivers include the growing demand for sustainable packaging solutions across various industries like food and beverage, cosmetics, and pharmaceuticals. The shift towards e-commerce further fuels market expansion, as online retailers prioritize eco-friendly labeling to enhance their brand image and attract environmentally conscious consumers. Major trends include the increasing adoption of biodegradable and compostable label materials, along with the development of innovative labeling technologies such as digital printing for reduced waste and customized labeling options. However, the market faces restraints such as the higher cost of eco-friendly materials compared to traditional options, and challenges in ensuring the complete recyclability of combined materials. The market is segmented by label type (paper, film, etc.), application (food & beverage, consumer goods etc.), and geography. Leading companies such as Oji, Koehler, Appvion, and Mitsubishi Paper are at the forefront of innovation, investing in research and development to create sustainable and cost-effective labeling solutions.
Environmentally Friendly Labels Market Size (In Billion)
The competitive landscape is characterized by both established players and emerging companies focusing on niche applications and innovative materials. Regional variations in market growth are expected, with North America and Europe leading the way due to strong environmental regulations and heightened consumer demand for sustainable products. Asia-Pacific is also anticipated to show significant growth potential given its expanding manufacturing sector and increasing awareness of environmental issues. The market's trajectory indicates continued growth potential, driven by the long-term trend towards environmentally conscious consumption and the ongoing development of technologically advanced, sustainable labeling options. The future likely involves further consolidation within the industry, with larger players acquiring smaller firms to expand their product portfolios and market reach.
Environmentally Friendly Labels Company Market Share
Environmentally Friendly Labels Market Report: 2019-2033
This comprehensive report provides a detailed analysis of the environmentally friendly labels market, projecting a market value exceeding $XX million by 2033. The study covers the period from 2019 to 2033, with 2025 as the base and estimated year. This in-depth analysis is crucial for stakeholders seeking to understand market dynamics, identify growth opportunities, and make informed strategic decisions within this rapidly evolving sector. The report features detailed analysis from leading companies including Oji, Koehler, Appvion, Mitsubishi Paper, Ricoh, Hansol, Jujo Thermal Paper, Jianghe Paper, Guanhao High-tech, Freeman Paper, Henan Hezhong Signage Technology, Xinxiang Zhongheng Paper, and Suzhou Guanwei Thermal Paper.
Environmentally Friendly Labels Market Composition & Trends
This section delves into the competitive landscape, analyzing market concentration, innovation drivers, regulatory impacts, substitute product analysis, end-user segmentation, and mergers & acquisitions (M&A) activity within the environmentally friendly labels market. The report provides a detailed market share distribution among key players, revealing the dominance of specific companies and highlighting strategic partnerships or acquisitions. For instance, we analyze M&A deal values exceeding $XX million during the historical period (2019-2024), impacting market consolidation and influencing future growth trajectories.
- Market Concentration: Analysis of the Herfindahl-Hirschman Index (HHI) to assess market competitiveness.
- Innovation Catalysts: Detailed examination of technological advancements driving market innovation, including advancements in biodegradable materials and printing technologies.
- Regulatory Landscape: Assessment of global and regional regulations influencing the adoption of environmentally friendly labels, including impact analysis on market growth.
- Substitute Products: Evaluation of alternative labeling solutions and their impact on market share.
- End-User Profiles: Segmentation of end-users based on industry, application, and geographical location, identifying high-growth segments.
- M&A Activity: Comprehensive analysis of M&A deals during the study period (2019-2024), with a focus on deal values and strategic implications.
Environmentally Friendly Labels Industry Evolution
This section provides a comprehensive overview of the environmentally friendly labels market's evolutionary path, encompassing market growth trajectories, technological advancements, and the evolving demands of environmentally conscious consumers. The report uses a combination of qualitative and quantitative data to present a holistic view of the market’s progression. Key data points like compound annual growth rates (CAGR) during the historical period (2019-2024) and forecast period (2025-2033) are included, along with an assessment of market penetration rates for various sustainable labeling solutions. The analysis also considers the influence of technological innovations, such as advancements in bio-based adhesives and compostable label materials, and their contribution to the market's expansion. The changing consumer preferences for eco-friendly products and their impact on the demand for sustainable labels are also meticulously evaluated.
Leading Regions, Countries, or Segments in Environmentally Friendly Labels
This section identifies the dominant regions, countries, and segments within the environmentally friendly labels market. A detailed analysis will uncover the factors driving this dominance, including investment patterns, regulatory support, and consumer behavior. The report will provide a detailed regional breakdown of the market and pinpoint the key countries that exhibit the highest growth rates and market shares.
- Key Drivers for Dominant Regions/Countries/Segments:
- Investment Trends: Analysis of government initiatives, private sector investments, and venture capital funding in the sector for leading regions.
- Regulatory Support: Evaluation of supportive policies and regulations fostering the adoption of environmentally friendly labels in leading regions.
- Consumer Awareness: Assessment of consumer demand and environmental consciousness driving the market growth in specific geographic areas.
Detailed analysis of dominance factors will be presented using paragraphs and focus on macroeconomic indicators, consumer behavior analysis and competitive advantages.
Environmentally Friendly Labels Product Innovations
This section highlights recent product innovations in environmentally friendly labels, including advancements in material science, printing technologies, and label designs. We showcase the unique selling propositions of these innovations and analyze their performance metrics. The discussion will include the emergence of new label materials, such as those made from recycled content or bio-based polymers, as well as improved printing processes that reduce waste and enhance label durability. This detailed analysis will also consider specific performance parameters, such as adhesion strength, water resistance, and print quality, to illustrate the advancements in this market segment.
Propelling Factors for Environmentally Friendly Labels Growth
Several factors contribute to the growth of the environmentally friendly labels market. Technological advancements in material science, leading to the development of biodegradable and compostable labels, are a significant driver. Economic incentives, such as government subsidies and tax breaks for businesses adopting sustainable packaging solutions, also play a crucial role. Stringent environmental regulations, pushing companies to reduce their carbon footprint and adopt eco-friendly practices, further accelerate market growth.
Obstacles in the Environmentally Friendly Labels Market
Despite the growth potential, challenges remain. Regulatory hurdles, particularly inconsistencies in regulations across different regions, can hinder market expansion. Supply chain disruptions, especially during times of economic instability or geopolitical uncertainty, can affect the availability and cost of raw materials, impacting production and market supply. Moreover, intense competition among established and emerging players can put pressure on pricing and profit margins, influencing market dynamics. The report quantifies the impacts of these barriers.
Future Opportunities in Environmentally Friendly Labels
The environmentally friendly labels market presents significant future opportunities. Expanding into new markets, particularly in developing economies with growing consumer awareness of sustainability issues, provides substantial growth potential. Innovation in labeling technologies, such as smart labels with embedded sensors for tracking and monitoring product authenticity and freshness, will open new market segments. Emerging consumer trends, such as increasing preference for sustainable and ethically sourced products, will further fuel the demand for environmentally friendly labels.
Key Developments in Environmentally Friendly Labels Industry
- [Month/Year]: Launch of a new biodegradable label material by [Company Name], significantly impacting market share.
- [Month/Year]: Acquisition of [Company A] by [Company B], resulting in increased market consolidation.
- [Month/Year]: Introduction of a new printing technology by [Company Name], improving efficiency and reducing waste.
- [Month/Year]: Implementation of stricter environmental regulations in [Region], stimulating the demand for sustainable labels. (Further key developments will be detailed in the full report)
Strategic Environmentally Friendly Labels Market Forecast
The environmentally friendly labels market is poised for robust growth over the forecast period (2025-2033), driven by several key factors. Continued technological innovation, leading to the development of more sustainable and cost-effective labeling solutions, will propel market expansion. Growing consumer awareness and demand for eco-friendly products will further fuel market growth. Supportive government policies and regulations will create a favorable environment for the industry's expansion. The market is projected to witness significant expansion across key regions, as businesses increasingly adopt sustainable practices and consumers actively seek environmentally responsible products.
Environmentally Friendly Labels Segmentation
-
1. Application
- 1.1. Electronics Industry
- 1.2. Daily necessities industry
- 1.3. Food and Beverage Industry
- 1.4. Pharmaceutical Industry
- 1.5. Others
-
2. Types
- 2.1. Paper Labels
- 2.2. Synthetic Paper and Film Labels
- 2.3. Others
Environmentally Friendly Labels Segmentation By Geography
-
1. North America
- 1.1. United States
- 1.2. Canada
- 1.3. Mexico
-
2. South America
- 2.1. Brazil
- 2.2. Argentina
- 2.3. Rest of South America
-
3. Europe
- 3.1. United Kingdom
- 3.2. Germany
- 3.3. France
- 3.4. Italy
- 3.5. Spain
- 3.6. Russia
- 3.7. Benelux
- 3.8. Nordics
- 3.9. Rest of Europe
-
4. Middle East & Africa
- 4.1. Turkey
- 4.2. Israel
- 4.3. GCC
- 4.4. North Africa
- 4.5. South Africa
- 4.6. Rest of Middle East & Africa
-
5. Asia Pacific
- 5.1. China
- 5.2. India
- 5.3. Japan
- 5.4. South Korea
- 5.5. ASEAN
- 5.6. Oceania
- 5.7. Rest of Asia Pacific

Environmentally Friendly Labels Regional Market Share
Geographic Coverage of Environmentally Friendly Labels
Environmentally Friendly Labels REPORT HIGHLIGHTS
| Aspects | Details |
|---|---|
| Study Period | 2020-2034 |
| Base Year | 2025 |
| Estimated Year | 2026 |
| Forecast Period | 2026-2034 |
| Historical Period | 2020-2025 |
| Growth Rate | CAGR of XX% from 2020-2034 |
| Segmentation |
|
Table of Contents
- 1. Introduction
- 1.1. Research Scope
- 1.2. Market Segmentation
- 1.3. Research Methodology
- 1.4. Definitions and Assumptions
- 2. Executive Summary
- 2.1. Introduction
- 3. Market Dynamics
- 3.1. Introduction
- 3.2. Market Drivers
- 3.3. Market Restrains
- 3.4. Market Trends
- 4. Market Factor Analysis
- 4.1. Porters Five Forces
- 4.2. Supply/Value Chain
- 4.3. PESTEL analysis
- 4.4. Market Entropy
- 4.5. Patent/Trademark Analysis
- 5. Global Environmentally Friendly Labels Analysis, Insights and Forecast, 2020-2032
- 5.1. Market Analysis, Insights and Forecast - by Application
- 5.1.1. Electronics Industry
- 5.1.2. Daily necessities industry
- 5.1.3. Food and Beverage Industry
- 5.1.4. Pharmaceutical Industry
- 5.1.5. Others
- 5.2. Market Analysis, Insights and Forecast - by Types
- 5.2.1. Paper Labels
- 5.2.2. Synthetic Paper and Film Labels
- 5.2.3. Others
- 5.3. Market Analysis, Insights and Forecast - by Region
- 5.3.1. North America
- 5.3.2. South America
- 5.3.3. Europe
- 5.3.4. Middle East & Africa
- 5.3.5. Asia Pacific
- 5.1. Market Analysis, Insights and Forecast - by Application
- 6. North America Environmentally Friendly Labels Analysis, Insights and Forecast, 2020-2032
- 6.1. Market Analysis, Insights and Forecast - by Application
- 6.1.1. Electronics Industry
- 6.1.2. Daily necessities industry
- 6.1.3. Food and Beverage Industry
- 6.1.4. Pharmaceutical Industry
- 6.1.5. Others
- 6.2. Market Analysis, Insights and Forecast - by Types
- 6.2.1. Paper Labels
- 6.2.2. Synthetic Paper and Film Labels
- 6.2.3. Others
- 6.1. Market Analysis, Insights and Forecast - by Application
- 7. South America Environmentally Friendly Labels Analysis, Insights and Forecast, 2020-2032
- 7.1. Market Analysis, Insights and Forecast - by Application
- 7.1.1. Electronics Industry
- 7.1.2. Daily necessities industry
- 7.1.3. Food and Beverage Industry
- 7.1.4. Pharmaceutical Industry
- 7.1.5. Others
- 7.2. Market Analysis, Insights and Forecast - by Types
- 7.2.1. Paper Labels
- 7.2.2. Synthetic Paper and Film Labels
- 7.2.3. Others
- 7.1. Market Analysis, Insights and Forecast - by Application
- 8. Europe Environmentally Friendly Labels Analysis, Insights and Forecast, 2020-2032
- 8.1. Market Analysis, Insights and Forecast - by Application
- 8.1.1. Electronics Industry
- 8.1.2. Daily necessities industry
- 8.1.3. Food and Beverage Industry
- 8.1.4. Pharmaceutical Industry
- 8.1.5. Others
- 8.2. Market Analysis, Insights and Forecast - by Types
- 8.2.1. Paper Labels
- 8.2.2. Synthetic Paper and Film Labels
- 8.2.3. Others
- 8.1. Market Analysis, Insights and Forecast - by Application
- 9. Middle East & Africa Environmentally Friendly Labels Analysis, Insights and Forecast, 2020-2032
- 9.1. Market Analysis, Insights and Forecast - by Application
- 9.1.1. Electronics Industry
- 9.1.2. Daily necessities industry
- 9.1.3. Food and Beverage Industry
- 9.1.4. Pharmaceutical Industry
- 9.1.5. Others
- 9.2. Market Analysis, Insights and Forecast - by Types
- 9.2.1. Paper Labels
- 9.2.2. Synthetic Paper and Film Labels
- 9.2.3. Others
- 9.1. Market Analysis, Insights and Forecast - by Application
- 10. Asia Pacific Environmentally Friendly Labels Analysis, Insights and Forecast, 2020-2032
- 10.1. Market Analysis, Insights and Forecast - by Application
- 10.1.1. Electronics Industry
- 10.1.2. Daily necessities industry
- 10.1.3. Food and Beverage Industry
- 10.1.4. Pharmaceutical Industry
- 10.1.5. Others
- 10.2. Market Analysis, Insights and Forecast - by Types
- 10.2.1. Paper Labels
- 10.2.2. Synthetic Paper and Film Labels
- 10.2.3. Others
- 10.1. Market Analysis, Insights and Forecast - by Application
- 11. Competitive Analysis
- 11.1. Global Market Share Analysis 2025
- 11.2. Company Profiles
- 11.2.1 Oji
- 11.2.1.1. Overview
- 11.2.1.2. Products
- 11.2.1.3. SWOT Analysis
- 11.2.1.4. Recent Developments
- 11.2.1.5. Financials (Based on Availability)
- 11.2.2 Koehler
- 11.2.2.1. Overview
- 11.2.2.2. Products
- 11.2.2.3. SWOT Analysis
- 11.2.2.4. Recent Developments
- 11.2.2.5. Financials (Based on Availability)
- 11.2.3 Appvion
- 11.2.3.1. Overview
- 11.2.3.2. Products
- 11.2.3.3. SWOT Analysis
- 11.2.3.4. Recent Developments
- 11.2.3.5. Financials (Based on Availability)
- 11.2.4 Mitsubishi Paper
- 11.2.4.1. Overview
- 11.2.4.2. Products
- 11.2.4.3. SWOT Analysis
- 11.2.4.4. Recent Developments
- 11.2.4.5. Financials (Based on Availability)
- 11.2.5 Ricoh
- 11.2.5.1. Overview
- 11.2.5.2. Products
- 11.2.5.3. SWOT Analysis
- 11.2.5.4. Recent Developments
- 11.2.5.5. Financials (Based on Availability)
- 11.2.6 Hansol
- 11.2.6.1. Overview
- 11.2.6.2. Products
- 11.2.6.3. SWOT Analysis
- 11.2.6.4. Recent Developments
- 11.2.6.5. Financials (Based on Availability)
- 11.2.7 Jujo Thermal Paper
- 11.2.7.1. Overview
- 11.2.7.2. Products
- 11.2.7.3. SWOT Analysis
- 11.2.7.4. Recent Developments
- 11.2.7.5. Financials (Based on Availability)
- 11.2.8 Jianghe Paper
- 11.2.8.1. Overview
- 11.2.8.2. Products
- 11.2.8.3. SWOT Analysis
- 11.2.8.4. Recent Developments
- 11.2.8.5. Financials (Based on Availability)
- 11.2.9 Guanhao High-tech
- 11.2.9.1. Overview
- 11.2.9.2. Products
- 11.2.9.3. SWOT Analysis
- 11.2.9.4. Recent Developments
- 11.2.9.5. Financials (Based on Availability)
- 11.2.10 Freeman Paper
- 11.2.10.1. Overview
- 11.2.10.2. Products
- 11.2.10.3. SWOT Analysis
- 11.2.10.4. Recent Developments
- 11.2.10.5. Financials (Based on Availability)
- 11.2.11 Henan Hezhong Signage Technology
- 11.2.11.1. Overview
- 11.2.11.2. Products
- 11.2.11.3. SWOT Analysis
- 11.2.11.4. Recent Developments
- 11.2.11.5. Financials (Based on Availability)
- 11.2.12 Xinxiang Zhongheng Paper
- 11.2.12.1. Overview
- 11.2.12.2. Products
- 11.2.12.3. SWOT Analysis
- 11.2.12.4. Recent Developments
- 11.2.12.5. Financials (Based on Availability)
- 11.2.13 Suzhou Guanwei Thermal Paper
- 11.2.13.1. Overview
- 11.2.13.2. Products
- 11.2.13.3. SWOT Analysis
- 11.2.13.4. Recent Developments
- 11.2.13.5. Financials (Based on Availability)
- 11.2.1 Oji
List of Figures
- Figure 1: Global Environmentally Friendly Labels Revenue Breakdown (million, %) by Region 2025 & 2033
- Figure 2: North America Environmentally Friendly Labels Revenue (million), by Application 2025 & 2033
- Figure 3: North America Environmentally Friendly Labels Revenue Share (%), by Application 2025 & 2033
- Figure 4: North America Environmentally Friendly Labels Revenue (million), by Types 2025 & 2033
- Figure 5: North America Environmentally Friendly Labels Revenue Share (%), by Types 2025 & 2033
- Figure 6: North America Environmentally Friendly Labels Revenue (million), by Country 2025 & 2033
- Figure 7: North America Environmentally Friendly Labels Revenue Share (%), by Country 2025 & 2033
- Figure 8: South America Environmentally Friendly Labels Revenue (million), by Application 2025 & 2033
- Figure 9: South America Environmentally Friendly Labels Revenue Share (%), by Application 2025 & 2033
- Figure 10: South America Environmentally Friendly Labels Revenue (million), by Types 2025 & 2033
- Figure 11: South America Environmentally Friendly Labels Revenue Share (%), by Types 2025 & 2033
- Figure 12: South America Environmentally Friendly Labels Revenue (million), by Country 2025 & 2033
- Figure 13: South America Environmentally Friendly Labels Revenue Share (%), by Country 2025 & 2033
- Figure 14: Europe Environmentally Friendly Labels Revenue (million), by Application 2025 & 2033
- Figure 15: Europe Environmentally Friendly Labels Revenue Share (%), by Application 2025 & 2033
- Figure 16: Europe Environmentally Friendly Labels Revenue (million), by Types 2025 & 2033
- Figure 17: Europe Environmentally Friendly Labels Revenue Share (%), by Types 2025 & 2033
- Figure 18: Europe Environmentally Friendly Labels Revenue (million), by Country 2025 & 2033
- Figure 19: Europe Environmentally Friendly Labels Revenue Share (%), by Country 2025 & 2033
- Figure 20: Middle East & Africa Environmentally Friendly Labels Revenue (million), by Application 2025 & 2033
- Figure 21: Middle East & Africa Environmentally Friendly Labels Revenue Share (%), by Application 2025 & 2033
- Figure 22: Middle East & Africa Environmentally Friendly Labels Revenue (million), by Types 2025 & 2033
- Figure 23: Middle East & Africa Environmentally Friendly Labels Revenue Share (%), by Types 2025 & 2033
- Figure 24: Middle East & Africa Environmentally Friendly Labels Revenue (million), by Country 2025 & 2033
- Figure 25: Middle East & Africa Environmentally Friendly Labels Revenue Share (%), by Country 2025 & 2033
- Figure 26: Asia Pacific Environmentally Friendly Labels Revenue (million), by Application 2025 & 2033
- Figure 27: Asia Pacific Environmentally Friendly Labels Revenue Share (%), by Application 2025 & 2033
- Figure 28: Asia Pacific Environmentally Friendly Labels Revenue (million), by Types 2025 & 2033
- Figure 29: Asia Pacific Environmentally Friendly Labels Revenue Share (%), by Types 2025 & 2033
- Figure 30: Asia Pacific Environmentally Friendly Labels Revenue (million), by Country 2025 & 2033
- Figure 31: Asia Pacific Environmentally Friendly Labels Revenue Share (%), by Country 2025 & 2033
List of Tables
- Table 1: Global Environmentally Friendly Labels Revenue million Forecast, by Application 2020 & 2033
- Table 2: Global Environmentally Friendly Labels Revenue million Forecast, by Types 2020 & 2033
- Table 3: Global Environmentally Friendly Labels Revenue million Forecast, by Region 2020 & 2033
- Table 4: Global Environmentally Friendly Labels Revenue million Forecast, by Application 2020 & 2033
- Table 5: Global Environmentally Friendly Labels Revenue million Forecast, by Types 2020 & 2033
- Table 6: Global Environmentally Friendly Labels Revenue million Forecast, by Country 2020 & 2033
- Table 7: United States Environmentally Friendly Labels Revenue (million) Forecast, by Application 2020 & 2033
- Table 8: Canada Environmentally Friendly Labels Revenue (million) Forecast, by Application 2020 & 2033
- Table 9: Mexico Environmentally Friendly Labels Revenue (million) Forecast, by Application 2020 & 2033
- Table 10: Global Environmentally Friendly Labels Revenue million Forecast, by Application 2020 & 2033
- Table 11: Global Environmentally Friendly Labels Revenue million Forecast, by Types 2020 & 2033
- Table 12: Global Environmentally Friendly Labels Revenue million Forecast, by Country 2020 & 2033
- Table 13: Brazil Environmentally Friendly Labels Revenue (million) Forecast, by Application 2020 & 2033
- Table 14: Argentina Environmentally Friendly Labels Revenue (million) Forecast, by Application 2020 & 2033
- Table 15: Rest of South America Environmentally Friendly Labels Revenue (million) Forecast, by Application 2020 & 2033
- Table 16: Global Environmentally Friendly Labels Revenue million Forecast, by Application 2020 & 2033
- Table 17: Global Environmentally Friendly Labels Revenue million Forecast, by Types 2020 & 2033
- Table 18: Global Environmentally Friendly Labels Revenue million Forecast, by Country 2020 & 2033
- Table 19: United Kingdom Environmentally Friendly Labels Revenue (million) Forecast, by Application 2020 & 2033
- Table 20: Germany Environmentally Friendly Labels Revenue (million) Forecast, by Application 2020 & 2033
- Table 21: France Environmentally Friendly Labels Revenue (million) Forecast, by Application 2020 & 2033
- Table 22: Italy Environmentally Friendly Labels Revenue (million) Forecast, by Application 2020 & 2033
- Table 23: Spain Environmentally Friendly Labels Revenue (million) Forecast, by Application 2020 & 2033
- Table 24: Russia Environmentally Friendly Labels Revenue (million) Forecast, by Application 2020 & 2033
- Table 25: Benelux Environmentally Friendly Labels Revenue (million) Forecast, by Application 2020 & 2033
- Table 26: Nordics Environmentally Friendly Labels Revenue (million) Forecast, by Application 2020 & 2033
- Table 27: Rest of Europe Environmentally Friendly Labels Revenue (million) Forecast, by Application 2020 & 2033
- Table 28: Global Environmentally Friendly Labels Revenue million Forecast, by Application 2020 & 2033
- Table 29: Global Environmentally Friendly Labels Revenue million Forecast, by Types 2020 & 2033
- Table 30: Global Environmentally Friendly Labels Revenue million Forecast, by Country 2020 & 2033
- Table 31: Turkey Environmentally Friendly Labels Revenue (million) Forecast, by Application 2020 & 2033
- Table 32: Israel Environmentally Friendly Labels Revenue (million) Forecast, by Application 2020 & 2033
- Table 33: GCC Environmentally Friendly Labels Revenue (million) Forecast, by Application 2020 & 2033
- Table 34: North Africa Environmentally Friendly Labels Revenue (million) Forecast, by Application 2020 & 2033
- Table 35: South Africa Environmentally Friendly Labels Revenue (million) Forecast, by Application 2020 & 2033
- Table 36: Rest of Middle East & Africa Environmentally Friendly Labels Revenue (million) Forecast, by Application 2020 & 2033
- Table 37: Global Environmentally Friendly Labels Revenue million Forecast, by Application 2020 & 2033
- Table 38: Global Environmentally Friendly Labels Revenue million Forecast, by Types 2020 & 2033
- Table 39: Global Environmentally Friendly Labels Revenue million Forecast, by Country 2020 & 2033
- Table 40: China Environmentally Friendly Labels Revenue (million) Forecast, by Application 2020 & 2033
- Table 41: India Environmentally Friendly Labels Revenue (million) Forecast, by Application 2020 & 2033
- Table 42: Japan Environmentally Friendly Labels Revenue (million) Forecast, by Application 2020 & 2033
- Table 43: South Korea Environmentally Friendly Labels Revenue (million) Forecast, by Application 2020 & 2033
- Table 44: ASEAN Environmentally Friendly Labels Revenue (million) Forecast, by Application 2020 & 2033
- Table 45: Oceania Environmentally Friendly Labels Revenue (million) Forecast, by Application 2020 & 2033
- Table 46: Rest of Asia Pacific Environmentally Friendly Labels Revenue (million) Forecast, by Application 2020 & 2033
Frequently Asked Questions
1. What is the projected Compound Annual Growth Rate (CAGR) of the Environmentally Friendly Labels?
The projected CAGR is approximately XX%.
2. Which companies are prominent players in the Environmentally Friendly Labels?
Key companies in the market include Oji, Koehler, Appvion, Mitsubishi Paper, Ricoh, Hansol, Jujo Thermal Paper, Jianghe Paper, Guanhao High-tech, Freeman Paper, Henan Hezhong Signage Technology, Xinxiang Zhongheng Paper, Suzhou Guanwei Thermal Paper.
3. What are the main segments of the Environmentally Friendly Labels?
The market segments include Application, Types.
4. Can you provide details about the market size?
The market size is estimated to be USD XXX million as of 2022.
5. What are some drivers contributing to market growth?
N/A
6. What are the notable trends driving market growth?
N/A
7. Are there any restraints impacting market growth?
N/A
8. Can you provide examples of recent developments in the market?
N/A
9. What pricing options are available for accessing the report?
Pricing options include single-user, multi-user, and enterprise licenses priced at USD 2900.00, USD 4350.00, and USD 5800.00 respectively.
10. Is the market size provided in terms of value or volume?
The market size is provided in terms of value, measured in million.
11. Are there any specific market keywords associated with the report?
Yes, the market keyword associated with the report is "Environmentally Friendly Labels," which aids in identifying and referencing the specific market segment covered.
12. How do I determine which pricing option suits my needs best?
The pricing options vary based on user requirements and access needs. Individual users may opt for single-user licenses, while businesses requiring broader access may choose multi-user or enterprise licenses for cost-effective access to the report.
13. Are there any additional resources or data provided in the Environmentally Friendly Labels report?
While the report offers comprehensive insights, it's advisable to review the specific contents or supplementary materials provided to ascertain if additional resources or data are available.
14. How can I stay updated on further developments or reports in the Environmentally Friendly Labels?
To stay informed about further developments, trends, and reports in the Environmentally Friendly Labels, consider subscribing to industry newsletters, following relevant companies and organizations, or regularly checking reputable industry news sources and publications.
Methodology
Step 1 - Identification of Relevant Samples Size from Population Database


Step 2 - Approaches for Defining Global Market Size (Value, Volume* & Price*)

Note*: In applicable scenarios
Step 3 - Data Sources
Primary Research
- Web Analytics
- Survey Reports
- Research Institute
- Latest Research Reports
- Opinion Leaders
Secondary Research
- Annual Reports
- White Paper
- Latest Press Release
- Industry Association
- Paid Database
- Investor Presentations

Step 4 - Data Triangulation
Involves using different sources of information in order to increase the validity of a study
These sources are likely to be stakeholders in a program - participants, other researchers, program staff, other community members, and so on.
Then we put all data in single framework & apply various statistical tools to find out the dynamic on the market.
During the analysis stage, feedback from the stakeholder groups would be compared to determine areas of agreement as well as areas of divergence