

Key Insights
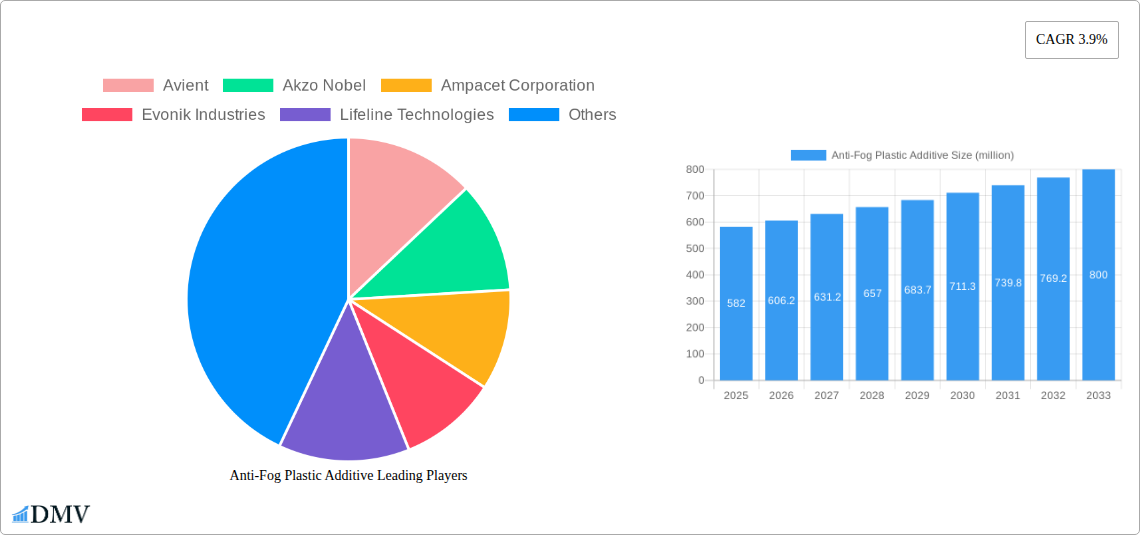
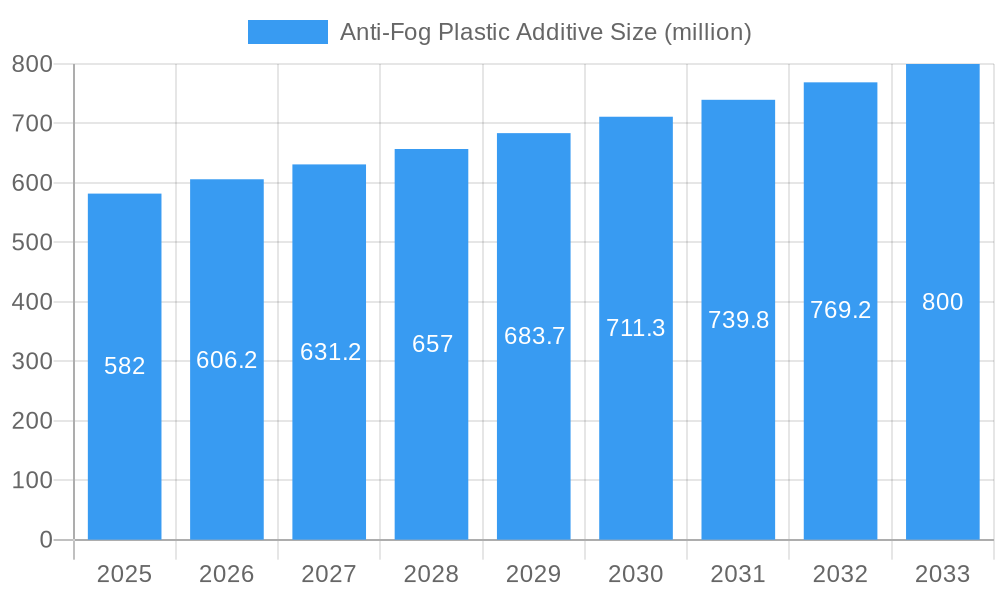
The global anti-fog plastic additive market, valued at $582 million in 2025, is projected to experience steady growth, driven by increasing demand across various sectors. The Compound Annual Growth Rate (CAGR) of 3.9% from 2025 to 2033 indicates a consistent expansion, primarily fueled by the rising adoption of anti-fog coatings in automotive applications (windshields, headlights, and taillights), consumer electronics (displays and screens), and medical devices (surgical instruments and protective eyewear). Furthermore, the growing awareness of safety and visibility, particularly in demanding environments like transportation and healthcare, is contributing significantly to market expansion. The market is segmented by additive type (e.g., polymeric, silica-based), application (automotive, packaging, medical, etc.), and geography. While precise regional data is unavailable, it's reasonable to assume a distribution reflecting global manufacturing and consumption patterns, with North America and Europe likely holding significant shares initially. Competitive dynamics are shaped by a diverse range of established players and emerging companies, continuously innovating to provide higher-performing and cost-effective solutions. The market faces restraints such as the potential for higher production costs associated with certain additives and ongoing concerns regarding environmental impact. However, continuous R&D efforts aimed at developing eco-friendly and high-performance solutions are mitigating these challenges.
Anti-Fog Plastic Additive Market Size (In Million)
The forecast period (2025-2033) anticipates further penetration of anti-fog additives into new applications, possibly including smart glasses and advanced protective equipment. Companies are actively exploring synergies with other functionalities, such as anti-scratch or self-cleaning properties, leading to the development of multifunctional additives. This trend will drive premiumization within the market, potentially increasing the overall average selling price. The presence of several significant players indicates a competitive landscape, with companies focusing on strategic partnerships, product differentiation, and geographic expansion to maintain market share and drive revenue growth. The long-term outlook for the anti-fog plastic additive market remains positive, fueled by technological advancements, increased consumer awareness, and the ongoing growth in key end-use sectors.
Anti-Fog Plastic Additive Company Market Share
Anti-Fog Plastic Additive Market Report: 2019-2033
This comprehensive report provides an in-depth analysis of the global anti-fog plastic additive market, offering invaluable insights for stakeholders across the value chain. The study covers the period from 2019 to 2033, with a focus on the forecast period 2025-2033, and uses 2025 as the base year and estimated year. The market is poised for significant growth, driven by technological advancements and increasing demand across diverse sectors. This report unveils the market dynamics, competitive landscape, and future opportunities within the multi-million dollar anti-fog plastic additive industry.
Anti-Fog Plastic Additive Market Composition & Trends
This section dissects the current state of the anti-fog plastic additive market, evaluating its concentration, innovation drivers, regulatory environment, substitute products, end-user profiles, and mergers and acquisitions (M&A) activity. The market is characterized by a moderately concentrated landscape with several major players holding significant market share. Avient, Akzo Nobel, and Evonik Industries are among the leading companies, collectively commanding an estimated xx million USD market share in 2025. Innovation is driven by the need for improved performance characteristics, such as enhanced durability and clarity, alongside increasing regulatory pressures for environmentally friendly solutions. The substitution of traditional anti-fogging methods with plastic additives is a key trend, while M&A activity has been relatively moderate, with a total estimated value of xx million USD in deals over the past five years.
- Market Share Distribution (2025): Avient (xx%), Akzo Nobel (xx%), Evonik Industries (xx%), Others (xx%).
- M&A Deal Value (2019-2024): Approximately xx million USD.
- Key Innovation Catalysts: Enhanced durability, improved clarity, eco-friendly formulations.
- Major End-Users: Automotive, packaging, ophthalmic, electronics.
Anti-Fog Plastic Additive Industry Evolution
The anti-fog plastic additive market has witnessed consistent growth throughout the historical period (2019-2024), expanding at a Compound Annual Growth Rate (CAGR) of approximately xx%. This growth is attributed to factors such as rising demand from end-use industries, technological advancements leading to improved product efficacy, and increasing consumer preference for enhanced visibility and safety. Technological innovations have focused on developing more effective and environmentally sustainable anti-fog additives. The adoption rate of advanced anti-fog technologies has increased significantly, especially in demanding applications such as automotive and medical devices. Shifting consumer demands are also driving innovation, with a growing preference for more durable and long-lasting anti-fog solutions.
- Market CAGR (2019-2024): xx%
- Projected Market CAGR (2025-2033): xx%
- Adoption Rate of Advanced Anti-fog Technologies (2025): xx%
Leading Regions, Countries, or Segments in Anti-Fog Plastic Additive
The North American region currently holds the largest share of the global anti-fog plastic additive market, driven by robust industrial activity, particularly within the automotive and packaging sectors. Strong regulatory support and significant investments in research and development further contribute to its dominance. Asia-Pacific is projected to witness the fastest growth, fueled by rising industrialization, increasing disposable incomes, and escalating demand for high-quality consumer goods.
- Key Drivers of North American Dominance: Established industrial base, strong R&D investments, supportive regulations.
- Key Drivers of Asia-Pacific Growth: Rapid industrialization, rising disposable incomes, increasing consumer demand.
- Other Significant Regions: Europe, Rest of World.
Anti-Fog Plastic Additive Product Innovations
Recent innovations in anti-fog plastic additives focus on enhancing performance characteristics such as durability, clarity, and cost-effectiveness. The development of nano-structured additives offers improved anti-fogging properties with longer-lasting effects. These advancements are being incorporated into a wider range of applications, extending beyond traditional uses to encompass sectors like healthcare and consumer electronics. Unique selling propositions include improved scratch resistance and resistance to environmental factors.
Propelling Factors for Anti-Fog Plastic Additive Growth
The growth of the anti-fog plastic additive market is propelled by several factors. Technological advancements leading to the development of more effective and durable additives are a major driver. Furthermore, stringent government regulations mandating improved safety and visibility in specific applications, like automotive windshields, are pushing adoption. The increasing demand across diverse sectors, such as automotive, packaging, and healthcare, also contributes to market expansion.
Obstacles in the Anti-Fog Plastic Additive Market
The market faces challenges, including volatile raw material prices affecting production costs and potential supply chain disruptions. Competitive pressures from existing and emerging players are impacting profit margins. Stringent regulatory requirements for environmental compliance can also present challenges to manufacturers. These factors cumulatively impact market growth and profitability.
Future Opportunities in Anti-Fog Plastic Additive
Future opportunities lie in exploring new applications, such as smart packaging solutions integrating anti-fog capabilities, and leveraging the growing interest in sustainable and biodegradable alternatives. Advancements in nanotechnology and other emerging technologies also present avenues for innovation and market expansion.
Major Players in the Anti-Fog Plastic Additive Ecosystem
- Avient
- Akzo Nobel
- Ampacet Corporation
- Evonik Industries
- Lifeline Technologies
- Croda International
- SABO SpA
- Technofill Additives
- JJ Plastalloy
- Miracle Masterbatches
- Kandui Industries
- Rapid Engineering
- PPM
- Pure Polymers
- Polyvel
- Ingenia Polymers
- Tan Hung Co
- REPIN Masterbatches
- AM Group
- Sonali Group
- Palsgaard
- NG MINCHEM
- Hongda
- Welset
- Marubeni
- Primex Plastics Corporation
- Surya Masterbatches
- Clear Polymer
- FERRO-PLAST Srl
Key Developments in Anti-Fog Plastic Additive Industry
- 2022 Q4: Avient launched a new line of eco-friendly anti-fog additives.
- 2023 Q1: Akzo Nobel and Evonik Industries announced a joint venture to develop advanced anti-fog solutions.
- 2024 Q2: Ampacet Corporation acquired a smaller competitor, expanding its market share.
- (Further details to be populated with specific data)
Strategic Anti-Fog Plastic Additive Market Forecast
The anti-fog plastic additive market is poised for substantial growth over the forecast period (2025-2033), driven by continued technological advancements, expanding applications, and increasing demand across key industries. Opportunities in sustainable solutions and emerging markets present significant potential for market expansion. The market is projected to reach a value of xx million USD by 2033, representing a significant increase from the 2025 estimated value.
Anti-Fog Plastic Additive Segmentation
-
1. Application
- 1.1. Food Packaging
- 1.2. Agricultural Film
- 1.3. Others
-
2. Types
- 2.1. Bio-based Additive
- 2.2. Non-Bio Based Additive
Anti-Fog Plastic Additive Segmentation By Geography
-
1. North America
- 1.1. United States
- 1.2. Canada
- 1.3. Mexico
-
2. South America
- 2.1. Brazil
- 2.2. Argentina
- 2.3. Rest of South America
-
3. Europe
- 3.1. United Kingdom
- 3.2. Germany
- 3.3. France
- 3.4. Italy
- 3.5. Spain
- 3.6. Russia
- 3.7. Benelux
- 3.8. Nordics
- 3.9. Rest of Europe
-
4. Middle East & Africa
- 4.1. Turkey
- 4.2. Israel
- 4.3. GCC
- 4.4. North Africa
- 4.5. South Africa
- 4.6. Rest of Middle East & Africa
-
5. Asia Pacific
- 5.1. China
- 5.2. India
- 5.3. Japan
- 5.4. South Korea
- 5.5. ASEAN
- 5.6. Oceania
- 5.7. Rest of Asia Pacific

Anti-Fog Plastic Additive Regional Market Share
Geographic Coverage of Anti-Fog Plastic Additive
Anti-Fog Plastic Additive REPORT HIGHLIGHTS
| Aspects | Details |
|---|---|
| Study Period | 2020-2034 |
| Base Year | 2025 |
| Estimated Year | 2026 |
| Forecast Period | 2026-2034 |
| Historical Period | 2020-2025 |
| Growth Rate | CAGR of 3.9% from 2020-2034 |
| Segmentation |
|
Table of Contents
- 1. Introduction
- 1.1. Research Scope
- 1.2. Market Segmentation
- 1.3. Research Methodology
- 1.4. Definitions and Assumptions
- 2. Executive Summary
- 2.1. Introduction
- 3. Market Dynamics
- 3.1. Introduction
- 3.2. Market Drivers
- 3.3. Market Restrains
- 3.4. Market Trends
- 4. Market Factor Analysis
- 4.1. Porters Five Forces
- 4.2. Supply/Value Chain
- 4.3. PESTEL analysis
- 4.4. Market Entropy
- 4.5. Patent/Trademark Analysis
- 5. Global Anti-Fog Plastic Additive Analysis, Insights and Forecast, 2020-2032
- 5.1. Market Analysis, Insights and Forecast - by Application
- 5.1.1. Food Packaging
- 5.1.2. Agricultural Film
- 5.1.3. Others
- 5.2. Market Analysis, Insights and Forecast - by Types
- 5.2.1. Bio-based Additive
- 5.2.2. Non-Bio Based Additive
- 5.3. Market Analysis, Insights and Forecast - by Region
- 5.3.1. North America
- 5.3.2. South America
- 5.3.3. Europe
- 5.3.4. Middle East & Africa
- 5.3.5. Asia Pacific
- 5.1. Market Analysis, Insights and Forecast - by Application
- 6. North America Anti-Fog Plastic Additive Analysis, Insights and Forecast, 2020-2032
- 6.1. Market Analysis, Insights and Forecast - by Application
- 6.1.1. Food Packaging
- 6.1.2. Agricultural Film
- 6.1.3. Others
- 6.2. Market Analysis, Insights and Forecast - by Types
- 6.2.1. Bio-based Additive
- 6.2.2. Non-Bio Based Additive
- 6.1. Market Analysis, Insights and Forecast - by Application
- 7. South America Anti-Fog Plastic Additive Analysis, Insights and Forecast, 2020-2032
- 7.1. Market Analysis, Insights and Forecast - by Application
- 7.1.1. Food Packaging
- 7.1.2. Agricultural Film
- 7.1.3. Others
- 7.2. Market Analysis, Insights and Forecast - by Types
- 7.2.1. Bio-based Additive
- 7.2.2. Non-Bio Based Additive
- 7.1. Market Analysis, Insights and Forecast - by Application
- 8. Europe Anti-Fog Plastic Additive Analysis, Insights and Forecast, 2020-2032
- 8.1. Market Analysis, Insights and Forecast - by Application
- 8.1.1. Food Packaging
- 8.1.2. Agricultural Film
- 8.1.3. Others
- 8.2. Market Analysis, Insights and Forecast - by Types
- 8.2.1. Bio-based Additive
- 8.2.2. Non-Bio Based Additive
- 8.1. Market Analysis, Insights and Forecast - by Application
- 9. Middle East & Africa Anti-Fog Plastic Additive Analysis, Insights and Forecast, 2020-2032
- 9.1. Market Analysis, Insights and Forecast - by Application
- 9.1.1. Food Packaging
- 9.1.2. Agricultural Film
- 9.1.3. Others
- 9.2. Market Analysis, Insights and Forecast - by Types
- 9.2.1. Bio-based Additive
- 9.2.2. Non-Bio Based Additive
- 9.1. Market Analysis, Insights and Forecast - by Application
- 10. Asia Pacific Anti-Fog Plastic Additive Analysis, Insights and Forecast, 2020-2032
- 10.1. Market Analysis, Insights and Forecast - by Application
- 10.1.1. Food Packaging
- 10.1.2. Agricultural Film
- 10.1.3. Others
- 10.2. Market Analysis, Insights and Forecast - by Types
- 10.2.1. Bio-based Additive
- 10.2.2. Non-Bio Based Additive
- 10.1. Market Analysis, Insights and Forecast - by Application
- 11. Competitive Analysis
- 11.1. Global Market Share Analysis 2025
- 11.2. Company Profiles
- 11.2.1 Avient
- 11.2.1.1. Overview
- 11.2.1.2. Products
- 11.2.1.3. SWOT Analysis
- 11.2.1.4. Recent Developments
- 11.2.1.5. Financials (Based on Availability)
- 11.2.2 Akzo Nobel
- 11.2.2.1. Overview
- 11.2.2.2. Products
- 11.2.2.3. SWOT Analysis
- 11.2.2.4. Recent Developments
- 11.2.2.5. Financials (Based on Availability)
- 11.2.3 Ampacet Corporation
- 11.2.3.1. Overview
- 11.2.3.2. Products
- 11.2.3.3. SWOT Analysis
- 11.2.3.4. Recent Developments
- 11.2.3.5. Financials (Based on Availability)
- 11.2.4 Evonik Industries
- 11.2.4.1. Overview
- 11.2.4.2. Products
- 11.2.4.3. SWOT Analysis
- 11.2.4.4. Recent Developments
- 11.2.4.5. Financials (Based on Availability)
- 11.2.5 Lifeline Technologies
- 11.2.5.1. Overview
- 11.2.5.2. Products
- 11.2.5.3. SWOT Analysis
- 11.2.5.4. Recent Developments
- 11.2.5.5. Financials (Based on Availability)
- 11.2.6 Croda International
- 11.2.6.1. Overview
- 11.2.6.2. Products
- 11.2.6.3. SWOT Analysis
- 11.2.6.4. Recent Developments
- 11.2.6.5. Financials (Based on Availability)
- 11.2.7 SABO SpA
- 11.2.7.1. Overview
- 11.2.7.2. Products
- 11.2.7.3. SWOT Analysis
- 11.2.7.4. Recent Developments
- 11.2.7.5. Financials (Based on Availability)
- 11.2.8 Technofill Additives
- 11.2.8.1. Overview
- 11.2.8.2. Products
- 11.2.8.3. SWOT Analysis
- 11.2.8.4. Recent Developments
- 11.2.8.5. Financials (Based on Availability)
- 11.2.9 JJ Plastalloy
- 11.2.9.1. Overview
- 11.2.9.2. Products
- 11.2.9.3. SWOT Analysis
- 11.2.9.4. Recent Developments
- 11.2.9.5. Financials (Based on Availability)
- 11.2.10 Miracle Masterbatches
- 11.2.10.1. Overview
- 11.2.10.2. Products
- 11.2.10.3. SWOT Analysis
- 11.2.10.4. Recent Developments
- 11.2.10.5. Financials (Based on Availability)
- 11.2.11 Kandui Industries
- 11.2.11.1. Overview
- 11.2.11.2. Products
- 11.2.11.3. SWOT Analysis
- 11.2.11.4. Recent Developments
- 11.2.11.5. Financials (Based on Availability)
- 11.2.12 Rapid Engineering
- 11.2.12.1. Overview
- 11.2.12.2. Products
- 11.2.12.3. SWOT Analysis
- 11.2.12.4. Recent Developments
- 11.2.12.5. Financials (Based on Availability)
- 11.2.13 PPM
- 11.2.13.1. Overview
- 11.2.13.2. Products
- 11.2.13.3. SWOT Analysis
- 11.2.13.4. Recent Developments
- 11.2.13.5. Financials (Based on Availability)
- 11.2.14 Pure Polymers
- 11.2.14.1. Overview
- 11.2.14.2. Products
- 11.2.14.3. SWOT Analysis
- 11.2.14.4. Recent Developments
- 11.2.14.5. Financials (Based on Availability)
- 11.2.15 Polyvel
- 11.2.15.1. Overview
- 11.2.15.2. Products
- 11.2.15.3. SWOT Analysis
- 11.2.15.4. Recent Developments
- 11.2.15.5. Financials (Based on Availability)
- 11.2.16 Ingenia Polymers
- 11.2.16.1. Overview
- 11.2.16.2. Products
- 11.2.16.3. SWOT Analysis
- 11.2.16.4. Recent Developments
- 11.2.16.5. Financials (Based on Availability)
- 11.2.17 Tan Hung Co
- 11.2.17.1. Overview
- 11.2.17.2. Products
- 11.2.17.3. SWOT Analysis
- 11.2.17.4. Recent Developments
- 11.2.17.5. Financials (Based on Availability)
- 11.2.18 REPIN Masterbatches
- 11.2.18.1. Overview
- 11.2.18.2. Products
- 11.2.18.3. SWOT Analysis
- 11.2.18.4. Recent Developments
- 11.2.18.5. Financials (Based on Availability)
- 11.2.19 AM Group
- 11.2.19.1. Overview
- 11.2.19.2. Products
- 11.2.19.3. SWOT Analysis
- 11.2.19.4. Recent Developments
- 11.2.19.5. Financials (Based on Availability)
- 11.2.20 Sonali Group
- 11.2.20.1. Overview
- 11.2.20.2. Products
- 11.2.20.3. SWOT Analysis
- 11.2.20.4. Recent Developments
- 11.2.20.5. Financials (Based on Availability)
- 11.2.21 Palsgaard
- 11.2.21.1. Overview
- 11.2.21.2. Products
- 11.2.21.3. SWOT Analysis
- 11.2.21.4. Recent Developments
- 11.2.21.5. Financials (Based on Availability)
- 11.2.22 NG MINCHEM
- 11.2.22.1. Overview
- 11.2.22.2. Products
- 11.2.22.3. SWOT Analysis
- 11.2.22.4. Recent Developments
- 11.2.22.5. Financials (Based on Availability)
- 11.2.23 Hongda
- 11.2.23.1. Overview
- 11.2.23.2. Products
- 11.2.23.3. SWOT Analysis
- 11.2.23.4. Recent Developments
- 11.2.23.5. Financials (Based on Availability)
- 11.2.24 Welset
- 11.2.24.1. Overview
- 11.2.24.2. Products
- 11.2.24.3. SWOT Analysis
- 11.2.24.4. Recent Developments
- 11.2.24.5. Financials (Based on Availability)
- 11.2.25 Marubeni
- 11.2.25.1. Overview
- 11.2.25.2. Products
- 11.2.25.3. SWOT Analysis
- 11.2.25.4. Recent Developments
- 11.2.25.5. Financials (Based on Availability)
- 11.2.26 Primex Plastics Corporation
- 11.2.26.1. Overview
- 11.2.26.2. Products
- 11.2.26.3. SWOT Analysis
- 11.2.26.4. Recent Developments
- 11.2.26.5. Financials (Based on Availability)
- 11.2.27 Surya Masterbatches
- 11.2.27.1. Overview
- 11.2.27.2. Products
- 11.2.27.3. SWOT Analysis
- 11.2.27.4. Recent Developments
- 11.2.27.5. Financials (Based on Availability)
- 11.2.28 Clear Polymer
- 11.2.28.1. Overview
- 11.2.28.2. Products
- 11.2.28.3. SWOT Analysis
- 11.2.28.4. Recent Developments
- 11.2.28.5. Financials (Based on Availability)
- 11.2.29 FERRO-PLAST Srl
- 11.2.29.1. Overview
- 11.2.29.2. Products
- 11.2.29.3. SWOT Analysis
- 11.2.29.4. Recent Developments
- 11.2.29.5. Financials (Based on Availability)
- 11.2.1 Avient
List of Figures
- Figure 1: Global Anti-Fog Plastic Additive Revenue Breakdown (million, %) by Region 2025 & 2033
- Figure 2: Global Anti-Fog Plastic Additive Volume Breakdown (K, %) by Region 2025 & 2033
- Figure 3: North America Anti-Fog Plastic Additive Revenue (million), by Application 2025 & 2033
- Figure 4: North America Anti-Fog Plastic Additive Volume (K), by Application 2025 & 2033
- Figure 5: North America Anti-Fog Plastic Additive Revenue Share (%), by Application 2025 & 2033
- Figure 6: North America Anti-Fog Plastic Additive Volume Share (%), by Application 2025 & 2033
- Figure 7: North America Anti-Fog Plastic Additive Revenue (million), by Types 2025 & 2033
- Figure 8: North America Anti-Fog Plastic Additive Volume (K), by Types 2025 & 2033
- Figure 9: North America Anti-Fog Plastic Additive Revenue Share (%), by Types 2025 & 2033
- Figure 10: North America Anti-Fog Plastic Additive Volume Share (%), by Types 2025 & 2033
- Figure 11: North America Anti-Fog Plastic Additive Revenue (million), by Country 2025 & 2033
- Figure 12: North America Anti-Fog Plastic Additive Volume (K), by Country 2025 & 2033
- Figure 13: North America Anti-Fog Plastic Additive Revenue Share (%), by Country 2025 & 2033
- Figure 14: North America Anti-Fog Plastic Additive Volume Share (%), by Country 2025 & 2033
- Figure 15: South America Anti-Fog Plastic Additive Revenue (million), by Application 2025 & 2033
- Figure 16: South America Anti-Fog Plastic Additive Volume (K), by Application 2025 & 2033
- Figure 17: South America Anti-Fog Plastic Additive Revenue Share (%), by Application 2025 & 2033
- Figure 18: South America Anti-Fog Plastic Additive Volume Share (%), by Application 2025 & 2033
- Figure 19: South America Anti-Fog Plastic Additive Revenue (million), by Types 2025 & 2033
- Figure 20: South America Anti-Fog Plastic Additive Volume (K), by Types 2025 & 2033
- Figure 21: South America Anti-Fog Plastic Additive Revenue Share (%), by Types 2025 & 2033
- Figure 22: South America Anti-Fog Plastic Additive Volume Share (%), by Types 2025 & 2033
- Figure 23: South America Anti-Fog Plastic Additive Revenue (million), by Country 2025 & 2033
- Figure 24: South America Anti-Fog Plastic Additive Volume (K), by Country 2025 & 2033
- Figure 25: South America Anti-Fog Plastic Additive Revenue Share (%), by Country 2025 & 2033
- Figure 26: South America Anti-Fog Plastic Additive Volume Share (%), by Country 2025 & 2033
- Figure 27: Europe Anti-Fog Plastic Additive Revenue (million), by Application 2025 & 2033
- Figure 28: Europe Anti-Fog Plastic Additive Volume (K), by Application 2025 & 2033
- Figure 29: Europe Anti-Fog Plastic Additive Revenue Share (%), by Application 2025 & 2033
- Figure 30: Europe Anti-Fog Plastic Additive Volume Share (%), by Application 2025 & 2033
- Figure 31: Europe Anti-Fog Plastic Additive Revenue (million), by Types 2025 & 2033
- Figure 32: Europe Anti-Fog Plastic Additive Volume (K), by Types 2025 & 2033
- Figure 33: Europe Anti-Fog Plastic Additive Revenue Share (%), by Types 2025 & 2033
- Figure 34: Europe Anti-Fog Plastic Additive Volume Share (%), by Types 2025 & 2033
- Figure 35: Europe Anti-Fog Plastic Additive Revenue (million), by Country 2025 & 2033
- Figure 36: Europe Anti-Fog Plastic Additive Volume (K), by Country 2025 & 2033
- Figure 37: Europe Anti-Fog Plastic Additive Revenue Share (%), by Country 2025 & 2033
- Figure 38: Europe Anti-Fog Plastic Additive Volume Share (%), by Country 2025 & 2033
- Figure 39: Middle East & Africa Anti-Fog Plastic Additive Revenue (million), by Application 2025 & 2033
- Figure 40: Middle East & Africa Anti-Fog Plastic Additive Volume (K), by Application 2025 & 2033
- Figure 41: Middle East & Africa Anti-Fog Plastic Additive Revenue Share (%), by Application 2025 & 2033
- Figure 42: Middle East & Africa Anti-Fog Plastic Additive Volume Share (%), by Application 2025 & 2033
- Figure 43: Middle East & Africa Anti-Fog Plastic Additive Revenue (million), by Types 2025 & 2033
- Figure 44: Middle East & Africa Anti-Fog Plastic Additive Volume (K), by Types 2025 & 2033
- Figure 45: Middle East & Africa Anti-Fog Plastic Additive Revenue Share (%), by Types 2025 & 2033
- Figure 46: Middle East & Africa Anti-Fog Plastic Additive Volume Share (%), by Types 2025 & 2033
- Figure 47: Middle East & Africa Anti-Fog Plastic Additive Revenue (million), by Country 2025 & 2033
- Figure 48: Middle East & Africa Anti-Fog Plastic Additive Volume (K), by Country 2025 & 2033
- Figure 49: Middle East & Africa Anti-Fog Plastic Additive Revenue Share (%), by Country 2025 & 2033
- Figure 50: Middle East & Africa Anti-Fog Plastic Additive Volume Share (%), by Country 2025 & 2033
- Figure 51: Asia Pacific Anti-Fog Plastic Additive Revenue (million), by Application 2025 & 2033
- Figure 52: Asia Pacific Anti-Fog Plastic Additive Volume (K), by Application 2025 & 2033
- Figure 53: Asia Pacific Anti-Fog Plastic Additive Revenue Share (%), by Application 2025 & 2033
- Figure 54: Asia Pacific Anti-Fog Plastic Additive Volume Share (%), by Application 2025 & 2033
- Figure 55: Asia Pacific Anti-Fog Plastic Additive Revenue (million), by Types 2025 & 2033
- Figure 56: Asia Pacific Anti-Fog Plastic Additive Volume (K), by Types 2025 & 2033
- Figure 57: Asia Pacific Anti-Fog Plastic Additive Revenue Share (%), by Types 2025 & 2033
- Figure 58: Asia Pacific Anti-Fog Plastic Additive Volume Share (%), by Types 2025 & 2033
- Figure 59: Asia Pacific Anti-Fog Plastic Additive Revenue (million), by Country 2025 & 2033
- Figure 60: Asia Pacific Anti-Fog Plastic Additive Volume (K), by Country 2025 & 2033
- Figure 61: Asia Pacific Anti-Fog Plastic Additive Revenue Share (%), by Country 2025 & 2033
- Figure 62: Asia Pacific Anti-Fog Plastic Additive Volume Share (%), by Country 2025 & 2033
List of Tables
- Table 1: Global Anti-Fog Plastic Additive Revenue million Forecast, by Application 2020 & 2033
- Table 2: Global Anti-Fog Plastic Additive Volume K Forecast, by Application 2020 & 2033
- Table 3: Global Anti-Fog Plastic Additive Revenue million Forecast, by Types 2020 & 2033
- Table 4: Global Anti-Fog Plastic Additive Volume K Forecast, by Types 2020 & 2033
- Table 5: Global Anti-Fog Plastic Additive Revenue million Forecast, by Region 2020 & 2033
- Table 6: Global Anti-Fog Plastic Additive Volume K Forecast, by Region 2020 & 2033
- Table 7: Global Anti-Fog Plastic Additive Revenue million Forecast, by Application 2020 & 2033
- Table 8: Global Anti-Fog Plastic Additive Volume K Forecast, by Application 2020 & 2033
- Table 9: Global Anti-Fog Plastic Additive Revenue million Forecast, by Types 2020 & 2033
- Table 10: Global Anti-Fog Plastic Additive Volume K Forecast, by Types 2020 & 2033
- Table 11: Global Anti-Fog Plastic Additive Revenue million Forecast, by Country 2020 & 2033
- Table 12: Global Anti-Fog Plastic Additive Volume K Forecast, by Country 2020 & 2033
- Table 13: United States Anti-Fog Plastic Additive Revenue (million) Forecast, by Application 2020 & 2033
- Table 14: United States Anti-Fog Plastic Additive Volume (K) Forecast, by Application 2020 & 2033
- Table 15: Canada Anti-Fog Plastic Additive Revenue (million) Forecast, by Application 2020 & 2033
- Table 16: Canada Anti-Fog Plastic Additive Volume (K) Forecast, by Application 2020 & 2033
- Table 17: Mexico Anti-Fog Plastic Additive Revenue (million) Forecast, by Application 2020 & 2033
- Table 18: Mexico Anti-Fog Plastic Additive Volume (K) Forecast, by Application 2020 & 2033
- Table 19: Global Anti-Fog Plastic Additive Revenue million Forecast, by Application 2020 & 2033
- Table 20: Global Anti-Fog Plastic Additive Volume K Forecast, by Application 2020 & 2033
- Table 21: Global Anti-Fog Plastic Additive Revenue million Forecast, by Types 2020 & 2033
- Table 22: Global Anti-Fog Plastic Additive Volume K Forecast, by Types 2020 & 2033
- Table 23: Global Anti-Fog Plastic Additive Revenue million Forecast, by Country 2020 & 2033
- Table 24: Global Anti-Fog Plastic Additive Volume K Forecast, by Country 2020 & 2033
- Table 25: Brazil Anti-Fog Plastic Additive Revenue (million) Forecast, by Application 2020 & 2033
- Table 26: Brazil Anti-Fog Plastic Additive Volume (K) Forecast, by Application 2020 & 2033
- Table 27: Argentina Anti-Fog Plastic Additive Revenue (million) Forecast, by Application 2020 & 2033
- Table 28: Argentina Anti-Fog Plastic Additive Volume (K) Forecast, by Application 2020 & 2033
- Table 29: Rest of South America Anti-Fog Plastic Additive Revenue (million) Forecast, by Application 2020 & 2033
- Table 30: Rest of South America Anti-Fog Plastic Additive Volume (K) Forecast, by Application 2020 & 2033
- Table 31: Global Anti-Fog Plastic Additive Revenue million Forecast, by Application 2020 & 2033
- Table 32: Global Anti-Fog Plastic Additive Volume K Forecast, by Application 2020 & 2033
- Table 33: Global Anti-Fog Plastic Additive Revenue million Forecast, by Types 2020 & 2033
- Table 34: Global Anti-Fog Plastic Additive Volume K Forecast, by Types 2020 & 2033
- Table 35: Global Anti-Fog Plastic Additive Revenue million Forecast, by Country 2020 & 2033
- Table 36: Global Anti-Fog Plastic Additive Volume K Forecast, by Country 2020 & 2033
- Table 37: United Kingdom Anti-Fog Plastic Additive Revenue (million) Forecast, by Application 2020 & 2033
- Table 38: United Kingdom Anti-Fog Plastic Additive Volume (K) Forecast, by Application 2020 & 2033
- Table 39: Germany Anti-Fog Plastic Additive Revenue (million) Forecast, by Application 2020 & 2033
- Table 40: Germany Anti-Fog Plastic Additive Volume (K) Forecast, by Application 2020 & 2033
- Table 41: France Anti-Fog Plastic Additive Revenue (million) Forecast, by Application 2020 & 2033
- Table 42: France Anti-Fog Plastic Additive Volume (K) Forecast, by Application 2020 & 2033
- Table 43: Italy Anti-Fog Plastic Additive Revenue (million) Forecast, by Application 2020 & 2033
- Table 44: Italy Anti-Fog Plastic Additive Volume (K) Forecast, by Application 2020 & 2033
- Table 45: Spain Anti-Fog Plastic Additive Revenue (million) Forecast, by Application 2020 & 2033
- Table 46: Spain Anti-Fog Plastic Additive Volume (K) Forecast, by Application 2020 & 2033
- Table 47: Russia Anti-Fog Plastic Additive Revenue (million) Forecast, by Application 2020 & 2033
- Table 48: Russia Anti-Fog Plastic Additive Volume (K) Forecast, by Application 2020 & 2033
- Table 49: Benelux Anti-Fog Plastic Additive Revenue (million) Forecast, by Application 2020 & 2033
- Table 50: Benelux Anti-Fog Plastic Additive Volume (K) Forecast, by Application 2020 & 2033
- Table 51: Nordics Anti-Fog Plastic Additive Revenue (million) Forecast, by Application 2020 & 2033
- Table 52: Nordics Anti-Fog Plastic Additive Volume (K) Forecast, by Application 2020 & 2033
- Table 53: Rest of Europe Anti-Fog Plastic Additive Revenue (million) Forecast, by Application 2020 & 2033
- Table 54: Rest of Europe Anti-Fog Plastic Additive Volume (K) Forecast, by Application 2020 & 2033
- Table 55: Global Anti-Fog Plastic Additive Revenue million Forecast, by Application 2020 & 2033
- Table 56: Global Anti-Fog Plastic Additive Volume K Forecast, by Application 2020 & 2033
- Table 57: Global Anti-Fog Plastic Additive Revenue million Forecast, by Types 2020 & 2033
- Table 58: Global Anti-Fog Plastic Additive Volume K Forecast, by Types 2020 & 2033
- Table 59: Global Anti-Fog Plastic Additive Revenue million Forecast, by Country 2020 & 2033
- Table 60: Global Anti-Fog Plastic Additive Volume K Forecast, by Country 2020 & 2033
- Table 61: Turkey Anti-Fog Plastic Additive Revenue (million) Forecast, by Application 2020 & 2033
- Table 62: Turkey Anti-Fog Plastic Additive Volume (K) Forecast, by Application 2020 & 2033
- Table 63: Israel Anti-Fog Plastic Additive Revenue (million) Forecast, by Application 2020 & 2033
- Table 64: Israel Anti-Fog Plastic Additive Volume (K) Forecast, by Application 2020 & 2033
- Table 65: GCC Anti-Fog Plastic Additive Revenue (million) Forecast, by Application 2020 & 2033
- Table 66: GCC Anti-Fog Plastic Additive Volume (K) Forecast, by Application 2020 & 2033
- Table 67: North Africa Anti-Fog Plastic Additive Revenue (million) Forecast, by Application 2020 & 2033
- Table 68: North Africa Anti-Fog Plastic Additive Volume (K) Forecast, by Application 2020 & 2033
- Table 69: South Africa Anti-Fog Plastic Additive Revenue (million) Forecast, by Application 2020 & 2033
- Table 70: South Africa Anti-Fog Plastic Additive Volume (K) Forecast, by Application 2020 & 2033
- Table 71: Rest of Middle East & Africa Anti-Fog Plastic Additive Revenue (million) Forecast, by Application 2020 & 2033
- Table 72: Rest of Middle East & Africa Anti-Fog Plastic Additive Volume (K) Forecast, by Application 2020 & 2033
- Table 73: Global Anti-Fog Plastic Additive Revenue million Forecast, by Application 2020 & 2033
- Table 74: Global Anti-Fog Plastic Additive Volume K Forecast, by Application 2020 & 2033
- Table 75: Global Anti-Fog Plastic Additive Revenue million Forecast, by Types 2020 & 2033
- Table 76: Global Anti-Fog Plastic Additive Volume K Forecast, by Types 2020 & 2033
- Table 77: Global Anti-Fog Plastic Additive Revenue million Forecast, by Country 2020 & 2033
- Table 78: Global Anti-Fog Plastic Additive Volume K Forecast, by Country 2020 & 2033
- Table 79: China Anti-Fog Plastic Additive Revenue (million) Forecast, by Application 2020 & 2033
- Table 80: China Anti-Fog Plastic Additive Volume (K) Forecast, by Application 2020 & 2033
- Table 81: India Anti-Fog Plastic Additive Revenue (million) Forecast, by Application 2020 & 2033
- Table 82: India Anti-Fog Plastic Additive Volume (K) Forecast, by Application 2020 & 2033
- Table 83: Japan Anti-Fog Plastic Additive Revenue (million) Forecast, by Application 2020 & 2033
- Table 84: Japan Anti-Fog Plastic Additive Volume (K) Forecast, by Application 2020 & 2033
- Table 85: South Korea Anti-Fog Plastic Additive Revenue (million) Forecast, by Application 2020 & 2033
- Table 86: South Korea Anti-Fog Plastic Additive Volume (K) Forecast, by Application 2020 & 2033
- Table 87: ASEAN Anti-Fog Plastic Additive Revenue (million) Forecast, by Application 2020 & 2033
- Table 88: ASEAN Anti-Fog Plastic Additive Volume (K) Forecast, by Application 2020 & 2033
- Table 89: Oceania Anti-Fog Plastic Additive Revenue (million) Forecast, by Application 2020 & 2033
- Table 90: Oceania Anti-Fog Plastic Additive Volume (K) Forecast, by Application 2020 & 2033
- Table 91: Rest of Asia Pacific Anti-Fog Plastic Additive Revenue (million) Forecast, by Application 2020 & 2033
- Table 92: Rest of Asia Pacific Anti-Fog Plastic Additive Volume (K) Forecast, by Application 2020 & 2033
Frequently Asked Questions
1. What is the projected Compound Annual Growth Rate (CAGR) of the Anti-Fog Plastic Additive?
The projected CAGR is approximately 3.9%.
2. Which companies are prominent players in the Anti-Fog Plastic Additive?
Key companies in the market include Avient, Akzo Nobel, Ampacet Corporation, Evonik Industries, Lifeline Technologies, Croda International, SABO SpA, Technofill Additives, JJ Plastalloy, Miracle Masterbatches, Kandui Industries, Rapid Engineering, PPM, Pure Polymers, Polyvel, Ingenia Polymers, Tan Hung Co, REPIN Masterbatches, AM Group, Sonali Group, Palsgaard, NG MINCHEM, Hongda, Welset, Marubeni, Primex Plastics Corporation, Surya Masterbatches, Clear Polymer, FERRO-PLAST Srl.
3. What are the main segments of the Anti-Fog Plastic Additive?
The market segments include Application, Types.
4. Can you provide details about the market size?
The market size is estimated to be USD 582 million as of 2022.
5. What are some drivers contributing to market growth?
N/A
6. What are the notable trends driving market growth?
N/A
7. Are there any restraints impacting market growth?
N/A
8. Can you provide examples of recent developments in the market?
N/A
9. What pricing options are available for accessing the report?
Pricing options include single-user, multi-user, and enterprise licenses priced at USD 3950.00, USD 5925.00, and USD 7900.00 respectively.
10. Is the market size provided in terms of value or volume?
The market size is provided in terms of value, measured in million and volume, measured in K.
11. Are there any specific market keywords associated with the report?
Yes, the market keyword associated with the report is "Anti-Fog Plastic Additive," which aids in identifying and referencing the specific market segment covered.
12. How do I determine which pricing option suits my needs best?
The pricing options vary based on user requirements and access needs. Individual users may opt for single-user licenses, while businesses requiring broader access may choose multi-user or enterprise licenses for cost-effective access to the report.
13. Are there any additional resources or data provided in the Anti-Fog Plastic Additive report?
While the report offers comprehensive insights, it's advisable to review the specific contents or supplementary materials provided to ascertain if additional resources or data are available.
14. How can I stay updated on further developments or reports in the Anti-Fog Plastic Additive?
To stay informed about further developments, trends, and reports in the Anti-Fog Plastic Additive, consider subscribing to industry newsletters, following relevant companies and organizations, or regularly checking reputable industry news sources and publications.
Methodology
Step 1 - Identification of Relevant Samples Size from Population Database


Step 2 - Approaches for Defining Global Market Size (Value, Volume* & Price*)

Note*: In applicable scenarios
Step 3 - Data Sources
Primary Research
- Web Analytics
- Survey Reports
- Research Institute
- Latest Research Reports
- Opinion Leaders
Secondary Research
- Annual Reports
- White Paper
- Latest Press Release
- Industry Association
- Paid Database
- Investor Presentations

Step 4 - Data Triangulation
Involves using different sources of information in order to increase the validity of a study
These sources are likely to be stakeholders in a program - participants, other researchers, program staff, other community members, and so on.
Then we put all data in single framework & apply various statistical tools to find out the dynamic on the market.
During the analysis stage, feedback from the stakeholder groups would be compared to determine areas of agreement as well as areas of divergence