

Key Insights
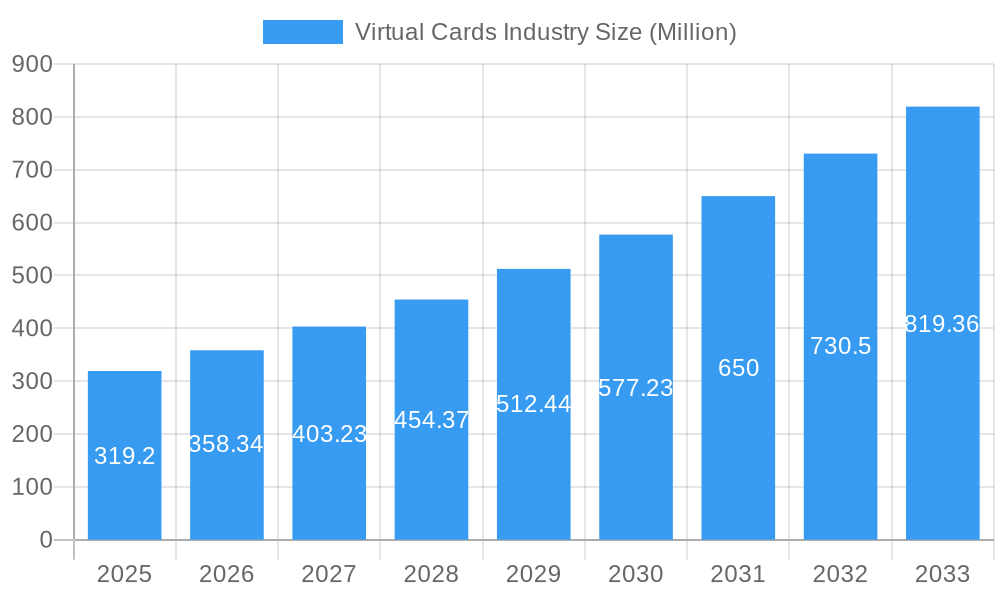
The global virtual cards market is experiencing robust growth, projected to reach $319.20 million in 2025 and maintain a Compound Annual Growth Rate (CAGR) exceeding 12% through 2033. This expansion is driven by several key factors. Firstly, the increasing adoption of digital payment methods across both B2B and B2C sectors is fueling demand for secure and efficient virtual card solutions. Businesses are leveraging B2B virtual cards to streamline expense management, improve reconciliation processes, and enhance security for online transactions. Simultaneously, consumers are increasingly embracing B2C virtual cards for online shopping and contactless payments, attracted by their convenience and enhanced security features compared to traditional physical cards. The rise of e-commerce and the growing preference for contactless payments are significant catalysts for market growth. Furthermore, technological advancements, such as improved fraud prevention mechanisms and enhanced integration with existing payment systems, are further accelerating the adoption of virtual cards. The market is segmented by product type (B2B, B2C remote payment, and B2C POS virtual cards) and end-user (consumer and business), reflecting the diverse applications of this technology. Major players like American Express, Mastercard, and JPMorgan Chase, alongside specialized fintech companies, are actively shaping market competition and innovation.
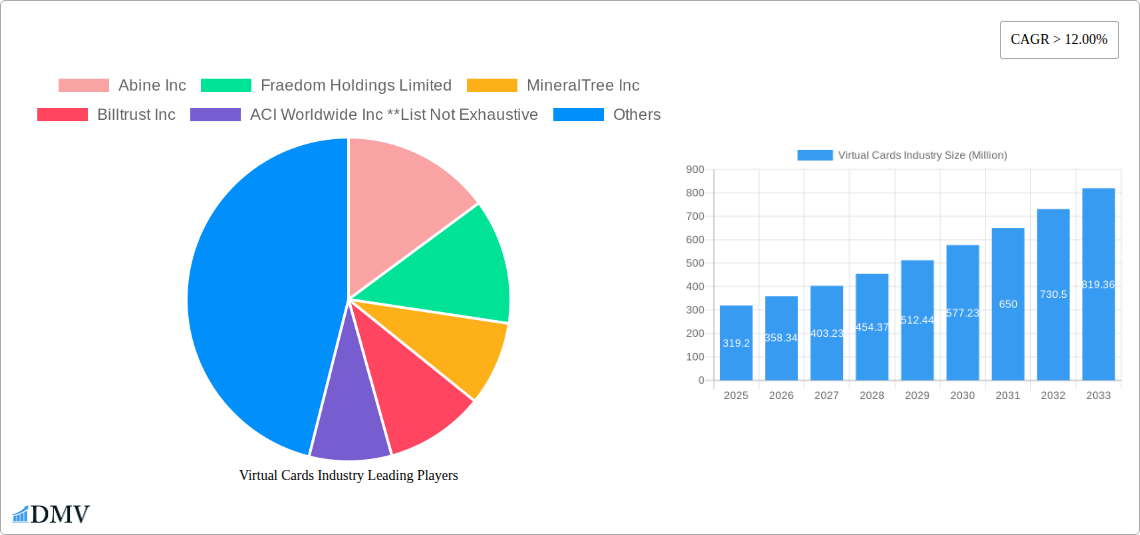
Virtual Cards Industry Market Size (In Million)
Geographic expansion is another crucial driver. While North America currently holds a significant market share due to early adoption and established digital infrastructure, regions like Asia-Pacific and Europe are witnessing rapid growth, driven by increasing internet penetration and smartphone usage. The market faces certain restraints, including concerns about security breaches and the need for widespread consumer education on virtual card functionalities. However, ongoing improvements in security protocols and targeted marketing initiatives are mitigating these challenges. The long-term outlook for the virtual cards market remains exceptionally positive, fueled by continuous technological advancements, expanding digital payment ecosystems, and a growing preference for contactless and secure transaction methods across diverse industries and demographics. The forecast period of 2025-2033 is expected to witness significant expansion driven by these factors.
Virtual Cards Industry Company Market Share
Virtual Cards Industry: A Comprehensive Market Report (2019-2033)
This insightful report provides a detailed analysis of the global Virtual Cards industry, projecting a market value of $XX Million by 2033. Covering the historical period (2019-2024), base year (2025), and forecast period (2025-2033), this comprehensive study offers invaluable insights for stakeholders seeking to navigate this rapidly evolving landscape. The report meticulously examines market composition, technological advancements, key players, and future growth prospects, providing actionable intelligence for strategic decision-making.
Virtual Cards Industry Market Composition & Trends
The global virtual cards market is experiencing robust growth, driven by the increasing adoption of digital payment solutions and the expansion of e-commerce. Market concentration is moderate, with several major players competing alongside numerous niche providers. Innovation is a key catalyst, with continuous advancements in security features, payment processing technologies, and user interfaces shaping market dynamics. Regulatory landscapes vary across regions, impacting market access and operational compliance. Substitute products, such as traditional credit and debit cards, still hold significant market share, though virtual cards are progressively gaining traction due to their enhanced security and convenience.
- Market Share Distribution (2025 Estimate): Mastercard Incorporated: 25%; American Express Company: 18%; Alipay com Co Ltd: 15%; Other Players: 42% (This distribution is an estimate based on market trends and currently available data)
- M&A Activity (2019-2024): Total deal value exceeding $XX Million, with a noticeable increase in activity in the past two years. Deals primarily focused on enhancing technological capabilities and expanding market reach.
Virtual Cards Industry Industry Evolution
The virtual cards market has witnessed exponential growth since 2019, propelled by technological advancements such as mobile wallets, tokenization, and improved security protocols. This growth trajectory is projected to continue throughout the forecast period, driven by increased consumer demand for convenient and secure payment options. The shift towards contactless payments and the rise of mobile commerce have significantly boosted virtual card adoption. The integration of virtual cards into various platforms, including e-commerce websites, mobile apps, and enterprise resource planning (ERP) systems, has further facilitated wider adoption across various industries. The market is also witnessing a rising demand for specialized virtual cards catering to specific business needs and consumer preferences. Growth rates are averaging XX% annually, with adoption metrics exceeding XX Million active users globally in 2025.
Leading Regions, Countries, or Segments in Virtual Cards Industry
The North American and European regions currently dominate the virtual cards market, driven by high levels of technological adoption, robust digital infrastructure, and established regulatory frameworks. Within product types, B2B virtual cards maintain the largest market share, fueled by increasing business demand for streamlined expense management and enhanced security. However, the B2C segment, particularly B2C remote payment virtual cards, is experiencing rapid growth, reflecting the rising popularity of online shopping and mobile payments.
- Key Drivers:
- North America: High penetration of smartphones and internet usage, coupled with strong regulatory support for digital payments.
- Europe: Growing adoption of contactless payments and the expansion of online banking services.
- B2B Virtual Cards: Increased demand for efficient expense management and enhanced security features among businesses.
- B2C Remote Payment Virtual Cards: Surge in e-commerce transactions and the rising preference for convenient online payment solutions.
Virtual Cards Industry Product Innovations
Recent innovations include the introduction of biometrics for enhanced security, AI-powered fraud detection systems, and integration with various loyalty programs and reward systems. These advancements enhance user experience, improve security, and provide greater flexibility to users. Unique selling propositions include disposable virtual card numbers, advanced fraud prevention, and seamless integration with existing financial systems, offering a significant competitive advantage.
Propelling Factors for Virtual Cards Industry Growth
Technological advancements such as mobile wallets, improved security features, and seamless integration with existing financial systems are key growth drivers. Economic factors, including the rise of e-commerce and the increased adoption of digital payments, further fuel this growth. Supportive regulatory frameworks and government initiatives aimed at promoting digital financial inclusion also play a crucial role in boosting market expansion.
Obstacles in the Virtual Cards Industry Market
Regulatory hurdles and varying compliance standards across different jurisdictions pose significant challenges. Supply chain disruptions impacting the production and distribution of virtual card solutions can also affect market growth. Intense competition from existing payment providers and emerging fintech companies exerts continuous pressure on market participants. These challenges are estimated to reduce market growth by approximately XX% annually.
Future Opportunities in Virtual Cards Industry
Expansion into developing markets with rapidly growing digital economies offers considerable potential. The integration of virtual cards with emerging technologies such as blockchain and the Internet of Things (IoT) presents exciting opportunities for innovation. The rising demand for customized virtual card solutions catering to niche markets and specialized needs also creates new avenues for growth.
Major Players in the Virtual Cards Industry Ecosystem
- Abine Inc
- Fraedom Holdings Limited
- MineralTree Inc
- Billtrust Inc
- ACI Worldwide Inc
- American Express Company
- Mastercard Incorporated
- JPMorgan Chase & Co
- Alipay com Co Ltd
- Skrill USA Inc
Key Developments in Virtual Cards Industry Industry
- December 2023: Conferma Pay and Mastercard expanded their partnership, enabling mobile virtual card payments and offering contactless payments to corporate customers. This development significantly expands the reach and convenience of virtual cards.
- May 2022: Mastercard and OPay partnered to promote financial inclusion and digital commerce across the Middle East and Africa. This strategic alliance opens up significant new markets for virtual card solutions.
Strategic Virtual Cards Industry Market Forecast
The virtual cards market is poised for sustained growth, driven by continuous technological innovation, increasing digital adoption, and expanding e-commerce activity. The market's future potential is significant, with projections indicating substantial expansion across various segments and geographies. The emergence of new technologies and the expansion into untapped markets will continue to shape the industry's trajectory in the coming years.
Virtual Cards Industry Segmentation
-
1. Product Type
- 1.1. B2B Virtual Cards
- 1.2. B2C Remote Payment Virtual Cards
- 1.3. B2C POS Virtual Cards
-
2. End User
- 2.1. Consumer Use
- 2.2. Business Use
Virtual Cards Industry Segmentation By Geography
-
1. North America
- 1.1. United States
- 1.2. Canada
- 1.3. Rest of North America
-
2. South America
- 2.1. Brazil
- 2.2. Peru
- 2.3. Rest of South America
-
3. Europe
- 3.1. United Kingdom
- 3.2. Germany
- 3.3. Rest of Europe
-
4. Asia Pacific
- 4.1. India
- 4.2. Japan
- 4.3. Rest of Asia Pacific
- 5. Middle East
-
6. Saudi Arabia
- 6.1. United Arab Emirates
- 6.2. Rest of Middle East
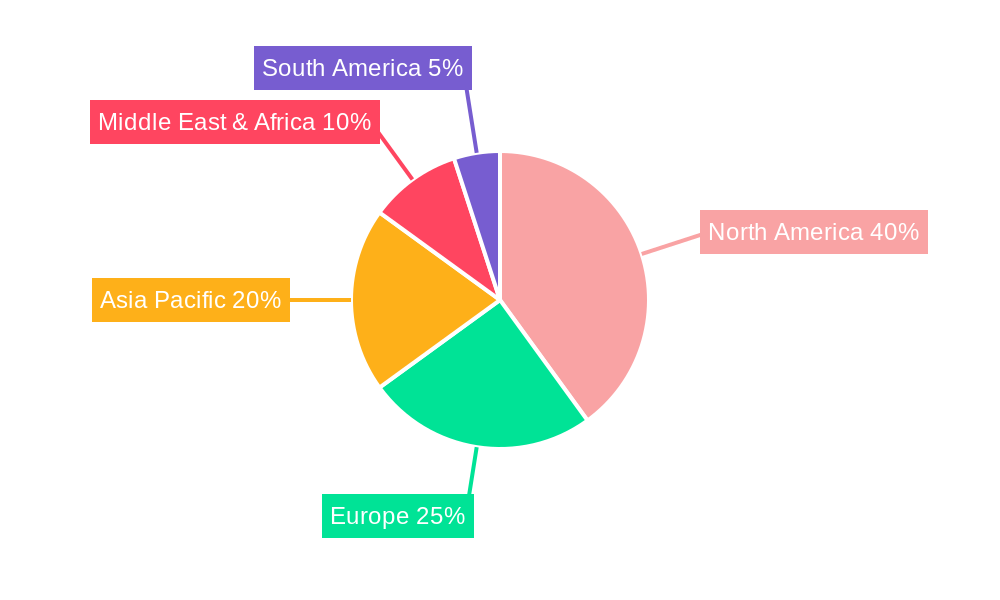
Virtual Cards Industry Regional Market Share
Geographic Coverage of Virtual Cards Industry
Virtual Cards Industry REPORT HIGHLIGHTS
| Aspects | Details |
|---|---|
| Study Period | 2020-2034 |
| Base Year | 2025 |
| Estimated Year | 2026 |
| Forecast Period | 2026-2034 |
| Historical Period | 2020-2025 |
| Growth Rate | CAGR of > 12.00% from 2020-2034 |
| Segmentation |
|
Table of Contents
- 1. Introduction
- 1.1. Research Scope
- 1.2. Market Segmentation
- 1.3. Research Objective
- 1.4. Definitions and Assumptions
- 2. Executive Summary
- 2.1. Market Snapshot
- 3. Market Dynamics
- 3.1. Market Drivers
- 3.2. Market Restrains
- 3.3. Market Trends
- 3.4. Market Opportunities
- 4. Market Factor Analysis
- 4.1. Porters Five Forces
- 4.1.1. Bargaining Power of Suppliers
- 4.1.2. Bargaining Power of Buyers
- 4.1.3. Threat of New Entrants
- 4.1.4. Threat of Substitutes
- 4.1.5. Competitive Rivalry
- 4.2. PESTEL analysis
- 4.3. BCG Analysis
- 4.3.1. Stars (High Growth, High Market Share)
- 4.3.2. Cash Cows (Low Growth, High Market Share)
- 4.3.3. Question Mark (High Growth, Low Market Share)
- 4.3.4. Dogs (Low Growth, Low Market Share)
- 4.4. Ansoff Matrix Analysis
- 4.5. Supply Chain Analysis
- 4.6. Regulatory Landscape
- 4.7. Current Market Potential and Opportunity Assessment (TAM–SAM–SOM Framework)
- 4.8. DMV Analyst Note
- 4.1. Porters Five Forces
- 5. Market Analysis, Insights and Forecast 2021-2033
- 5.1. Market Analysis, Insights and Forecast - by Product Type
- 5.1.1. B2B Virtual Cards
- 5.1.2. B2C Remote Payment Virtual Cards
- 5.1.3. B2C POS Virtual Cards
- 5.2. Market Analysis, Insights and Forecast - by End User
- 5.2.1. Consumer Use
- 5.2.2. Business Use
- 5.3. Market Analysis, Insights and Forecast - by Region
- 5.3.1. North America
- 5.3.2. South America
- 5.3.3. Europe
- 5.3.4. Asia Pacific
- 5.3.5. Middle East
- 5.3.6. Saudi Arabia
- 5.1. Market Analysis, Insights and Forecast - by Product Type
- 6. Virtual Cards Industry Analysis, Insights and Forecast, 2021-2033
- 6.1. Market Analysis, Insights and Forecast - by Product Type
- 6.1.1. B2B Virtual Cards
- 6.1.2. B2C Remote Payment Virtual Cards
- 6.1.3. B2C POS Virtual Cards
- 6.2. Market Analysis, Insights and Forecast - by End User
- 6.2.1. Consumer Use
- 6.2.2. Business Use
- 6.1. Market Analysis, Insights and Forecast - by Product Type
- 7. North America Virtual Cards Industry Analysis, Insights and Forecast, 2020-2032
- 7.1. Market Analysis, Insights and Forecast - by Product Type
- 7.1.1. B2B Virtual Cards
- 7.1.2. B2C Remote Payment Virtual Cards
- 7.1.3. B2C POS Virtual Cards
- 7.2. Market Analysis, Insights and Forecast - by End User
- 7.2.1. Consumer Use
- 7.2.2. Business Use
- 7.1. Market Analysis, Insights and Forecast - by Product Type
- 8. South America Virtual Cards Industry Analysis, Insights and Forecast, 2020-2032
- 8.1. Market Analysis, Insights and Forecast - by Product Type
- 8.1.1. B2B Virtual Cards
- 8.1.2. B2C Remote Payment Virtual Cards
- 8.1.3. B2C POS Virtual Cards
- 8.2. Market Analysis, Insights and Forecast - by End User
- 8.2.1. Consumer Use
- 8.2.2. Business Use
- 8.1. Market Analysis, Insights and Forecast - by Product Type
- 9. Europe Virtual Cards Industry Analysis, Insights and Forecast, 2020-2032
- 9.1. Market Analysis, Insights and Forecast - by Product Type
- 9.1.1. B2B Virtual Cards
- 9.1.2. B2C Remote Payment Virtual Cards
- 9.1.3. B2C POS Virtual Cards
- 9.2. Market Analysis, Insights and Forecast - by End User
- 9.2.1. Consumer Use
- 9.2.2. Business Use
- 9.1. Market Analysis, Insights and Forecast - by Product Type
- 10. Asia Pacific Virtual Cards Industry Analysis, Insights and Forecast, 2020-2032
- 10.1. Market Analysis, Insights and Forecast - by Product Type
- 10.1.1. B2B Virtual Cards
- 10.1.2. B2C Remote Payment Virtual Cards
- 10.1.3. B2C POS Virtual Cards
- 10.2. Market Analysis, Insights and Forecast - by End User
- 10.2.1. Consumer Use
- 10.2.2. Business Use
- 10.1. Market Analysis, Insights and Forecast - by Product Type
- 11. Middle East Virtual Cards Industry Analysis, Insights and Forecast, 2020-2032
- 11.1. Market Analysis, Insights and Forecast - by Product Type
- 11.1.1. B2B Virtual Cards
- 11.1.2. B2C Remote Payment Virtual Cards
- 11.1.3. B2C POS Virtual Cards
- 11.2. Market Analysis, Insights and Forecast - by End User
- 11.2.1. Consumer Use
- 11.2.2. Business Use
- 11.1. Market Analysis, Insights and Forecast - by Product Type
- 12. Saudi Arabia Virtual Cards Industry Analysis, Insights and Forecast, 2020-2032
- 12.1. Market Analysis, Insights and Forecast - by Product Type
- 12.1.1. B2B Virtual Cards
- 12.1.2. B2C Remote Payment Virtual Cards
- 12.1.3. B2C POS Virtual Cards
- 12.2. Market Analysis, Insights and Forecast - by End User
- 12.2.1. Consumer Use
- 12.2.2. Business Use
- 12.1. Market Analysis, Insights and Forecast - by Product Type
- 13. Competitive Analysis
- 13.1. Company Profiles
- 13.1.1 Abine Inc
- 13.1.1.1. Company Overview
- 13.1.1.2. Products
- 13.1.1.3. Company Financials
- 13.1.1.4. SWOT Analysis
- 13.1.2 Fraedom Holdings Limited
- 13.1.2.1. Company Overview
- 13.1.2.2. Products
- 13.1.2.3. Company Financials
- 13.1.2.4. SWOT Analysis
- 13.1.3 MineralTree Inc
- 13.1.3.1. Company Overview
- 13.1.3.2. Products
- 13.1.3.3. Company Financials
- 13.1.3.4. SWOT Analysis
- 13.1.4 Billtrust Inc
- 13.1.4.1. Company Overview
- 13.1.4.2. Products
- 13.1.4.3. Company Financials
- 13.1.4.4. SWOT Analysis
- 13.1.5 ACI Worldwide Inc **List Not Exhaustive
- 13.1.5.1. Company Overview
- 13.1.5.2. Products
- 13.1.5.3. Company Financials
- 13.1.5.4. SWOT Analysis
- 13.1.6 American Express Company
- 13.1.6.1. Company Overview
- 13.1.6.2. Products
- 13.1.6.3. Company Financials
- 13.1.6.4. SWOT Analysis
- 13.1.7 Mastercard Incorporated
- 13.1.7.1. Company Overview
- 13.1.7.2. Products
- 13.1.7.3. Company Financials
- 13.1.7.4. SWOT Analysis
- 13.1.8 JPMorgan Chase & Co
- 13.1.8.1. Company Overview
- 13.1.8.2. Products
- 13.1.8.3. Company Financials
- 13.1.8.4. SWOT Analysis
- 13.1.9 Alipay com Co Ltd
- 13.1.9.1. Company Overview
- 13.1.9.2. Products
- 13.1.9.3. Company Financials
- 13.1.9.4. SWOT Analysis
- 13.1.10 Skrill USA Inc
- 13.1.10.1. Company Overview
- 13.1.10.2. Products
- 13.1.10.3. Company Financials
- 13.1.10.4. SWOT Analysis
- 13.1.1 Abine Inc
- 13.2. Market Entropy
- 13.2.1 Company's Key Areas Served
- 13.2.2 Recent Developments
- 13.3. Company Market Share Analysis 2025
- 13.3.1 Top 5 Companies Market Share Analysis
- 13.3.2 Top 3 Companies Market Share Analysis
- 13.4. List of Potential Customers
- 14. Research Methodology
List of Figures
- Figure 1: Virtual Cards Industry Revenue Breakdown (Million, %) by Product 2025 & 2033
- Figure 2: Virtual Cards Industry Share (%) by Company 2025
List of Tables
- Table 1: Virtual Cards Industry Revenue Million Forecast, by Product Type 2020 & 2033
- Table 2: Virtual Cards Industry Revenue Million Forecast, by End User 2020 & 2033
- Table 3: Virtual Cards Industry Revenue Million Forecast, by Region 2020 & 2033
- Table 4: Virtual Cards Industry Revenue Million Forecast, by Product Type 2020 & 2033
- Table 5: Virtual Cards Industry Revenue Million Forecast, by End User 2020 & 2033
- Table 6: Virtual Cards Industry Revenue Million Forecast, by Country 2020 & 2033
- Table 7: United States Virtual Cards Industry Revenue (Million) Forecast, by Application 2020 & 2033
- Table 8: Canada Virtual Cards Industry Revenue (Million) Forecast, by Application 2020 & 2033
- Table 9: Rest of North America Virtual Cards Industry Revenue (Million) Forecast, by Application 2020 & 2033
- Table 10: Virtual Cards Industry Revenue Million Forecast, by Product Type 2020 & 2033
- Table 11: Virtual Cards Industry Revenue Million Forecast, by End User 2020 & 2033
- Table 12: Virtual Cards Industry Revenue Million Forecast, by Country 2020 & 2033
- Table 13: Brazil Virtual Cards Industry Revenue (Million) Forecast, by Application 2020 & 2033
- Table 14: Peru Virtual Cards Industry Revenue (Million) Forecast, by Application 2020 & 2033
- Table 15: Rest of South America Virtual Cards Industry Revenue (Million) Forecast, by Application 2020 & 2033
- Table 16: Virtual Cards Industry Revenue Million Forecast, by Product Type 2020 & 2033
- Table 17: Virtual Cards Industry Revenue Million Forecast, by End User 2020 & 2033
- Table 18: Virtual Cards Industry Revenue Million Forecast, by Country 2020 & 2033
- Table 19: United Kingdom Virtual Cards Industry Revenue (Million) Forecast, by Application 2020 & 2033
- Table 20: Germany Virtual Cards Industry Revenue (Million) Forecast, by Application 2020 & 2033
- Table 21: Rest of Europe Virtual Cards Industry Revenue (Million) Forecast, by Application 2020 & 2033
- Table 22: Virtual Cards Industry Revenue Million Forecast, by Product Type 2020 & 2033
- Table 23: Virtual Cards Industry Revenue Million Forecast, by End User 2020 & 2033
- Table 24: Virtual Cards Industry Revenue Million Forecast, by Country 2020 & 2033
- Table 25: India Virtual Cards Industry Revenue (Million) Forecast, by Application 2020 & 2033
- Table 26: Japan Virtual Cards Industry Revenue (Million) Forecast, by Application 2020 & 2033
- Table 27: Rest of Asia Pacific Virtual Cards Industry Revenue (Million) Forecast, by Application 2020 & 2033
- Table 28: Virtual Cards Industry Revenue Million Forecast, by Product Type 2020 & 2033
- Table 29: Virtual Cards Industry Revenue Million Forecast, by End User 2020 & 2033
- Table 30: Virtual Cards Industry Revenue Million Forecast, by Country 2020 & 2033
- Table 31: Virtual Cards Industry Revenue Million Forecast, by Product Type 2020 & 2033
- Table 32: Virtual Cards Industry Revenue Million Forecast, by End User 2020 & 2033
- Table 33: Virtual Cards Industry Revenue Million Forecast, by Country 2020 & 2033
- Table 34: United Arab Emirates Virtual Cards Industry Revenue (Million) Forecast, by Application 2020 & 2033
- Table 35: Rest of Middle East Virtual Cards Industry Revenue (Million) Forecast, by Application 2020 & 2033
Frequently Asked Questions
1. What is the projected Compound Annual Growth Rate (CAGR) of the Virtual Cards Industry?
The projected CAGR is approximately > 12.00%.
2. Which companies are prominent players in the Virtual Cards Industry?
Key companies in the market include Abine Inc, Fraedom Holdings Limited, MineralTree Inc, Billtrust Inc, ACI Worldwide Inc **List Not Exhaustive, American Express Company, Mastercard Incorporated, JPMorgan Chase & Co, Alipay com Co Ltd, Skrill USA Inc.
3. What are the main segments of the Virtual Cards Industry?
The market segments include Product Type, End User.
4. Can you provide details about the market size?
The market size is estimated to be USD 319.20 Million as of 2022.
5. What are some drivers contributing to market growth?
Digital Transformation is Driving the Market.
6. What are the notable trends driving market growth?
Increasing Online Transactions is Augmenting the Virtual Cards Market in Asia-Pacific.
7. Are there any restraints impacting market growth?
Connectivity and Technical Issues is Restraining the Market.
8. Can you provide examples of recent developments in the market?
December 2023: Conferma Pay and Mastercard expanded their partnership to enable mobile virtual card payments. Mastercard’s commercial bank clients were expected to be able to offer the convenience of contactless virtual card payments to their corporate customers using Conferma Pay.
9. What pricing options are available for accessing the report?
Pricing options include single-user, multi-user, and enterprise licenses priced at USD 3800, USD 4500, and USD 5800 respectively.
10. Is the market size provided in terms of value or volume?
The market size is provided in terms of value, measured in Million.
11. Are there any specific market keywords associated with the report?
Yes, the market keyword associated with the report is "Virtual Cards Industry," which aids in identifying and referencing the specific market segment covered.
12. How do I determine which pricing option suits my needs best?
The pricing options vary based on user requirements and access needs. Individual users may opt for single-user licenses, while businesses requiring broader access may choose multi-user or enterprise licenses for cost-effective access to the report.
13. Are there any additional resources or data provided in the Virtual Cards Industry report?
While the report offers comprehensive insights, it's advisable to review the specific contents or supplementary materials provided to ascertain if additional resources or data are available.
14. How can I stay updated on further developments or reports in the Virtual Cards Industry?
To stay informed about further developments, trends, and reports in the Virtual Cards Industry, consider subscribing to industry newsletters, following relevant companies and organizations, or regularly checking reputable industry news sources and publications.
Methodology
Step 1 - Identification of Relevant Samples Size from Population Database


Step 2 - Approaches for Defining Global Market Size (Value, Volume* & Price*)

Note*: In applicable scenarios
Step 3 - Data Sources
Primary Research
- Web Analytics
- Survey Reports
- Research Institute
- Latest Research Reports
- Opinion Leaders
Secondary Research
- Annual Reports
- White Paper
- Latest Press Release
- Industry Association
- Paid Database
- Investor Presentations

Step 4 - Data Triangulation
Involves using different sources of information in order to increase the validity of a study
These sources are likely to be stakeholders in a program - participants, other researchers, program staff, other community members, and so on.
Then we put all data in single framework & apply various statistical tools to find out the dynamic on the market.
During the analysis stage, feedback from the stakeholder groups would be compared to determine areas of agreement as well as areas of divergence