

Key Insights
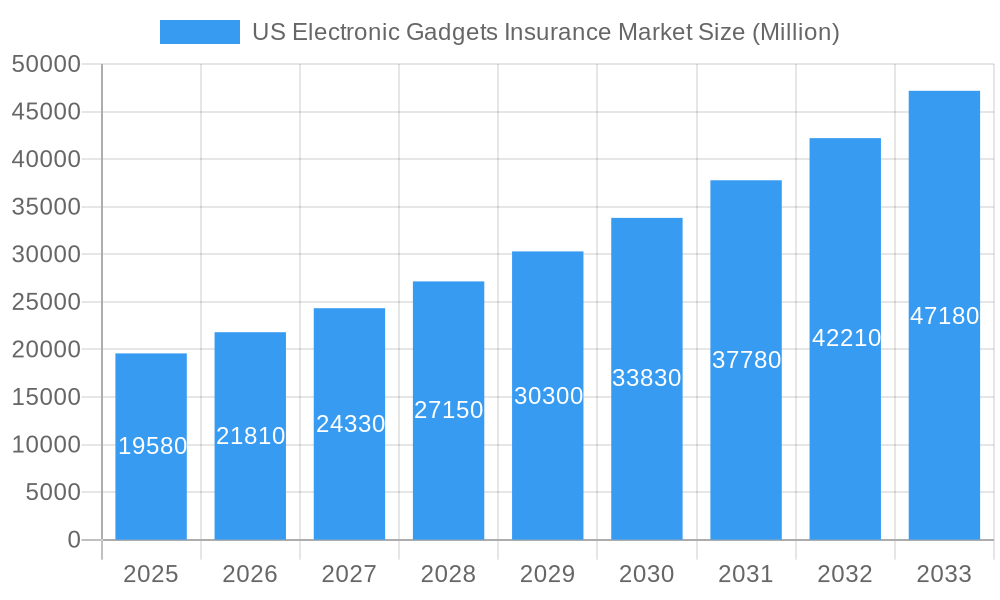
The US electronic gadgets insurance market is experiencing robust expansion, projected to reach a substantial size of $19.58 billion. This growth is fueled by an impressive Compound Annual Growth Rate (CAGR) of 11.54%, indicating a dynamic and rapidly evolving sector. The increasing reliance on electronic devices across both consumer and corporate landscapes, coupled with the rising cost of device replacement and repair, are primary drivers for this surge. The market is segmented by coverage type, with accidental damage, theft, and loss protection being the most sought-after. In terms of device types, laptops, computers, cameras, mobile devices, and drones represent key areas of focus for insurers. The end-user base is bifurcated, encompassing both individual consumers seeking to protect their personal electronics and corporate entities looking to safeguard their business-critical equipment.
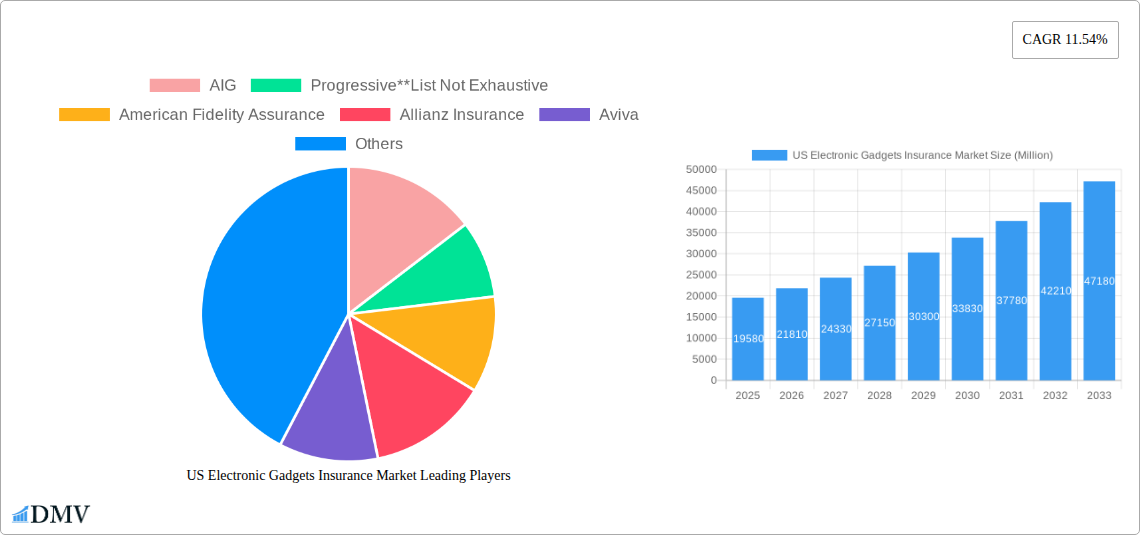
US Electronic Gadgets Insurance Market Market Size (In Billion)
Several factors are shaping the trajectory of the US electronic gadgets insurance market. Key trends include the growing popularity of device-as-a-service models, which often bundle insurance, and the increasing sophistication of cyber threats, leading to a demand for broader coverage. The proliferation of smart home devices and the expanding use of drones in commercial applications further contribute to market expansion. However, the market also faces certain restraints, such as the perceived high cost of premiums by some consumers and the potential for market saturation in specific segments. Despite these challenges, the overarching trend points towards sustained growth, driven by technological advancements, increasing device adoption, and a heightened awareness of the financial risks associated with electronic device ownership. Major players like AIG, Progressive, American Fidelity Assurance, Allianz Insurance, and Aviva are actively competing, offering diverse solutions to cater to the evolving needs of policyholders.
US Electronic Gadgets Insurance Market Company Market Share
US Electronic Gadgets Insurance Market Report: Comprehensive Analysis & Forecast 2019–2033
This in-depth report provides an exhaustive analysis of the US Electronic Gadgets Insurance Market, offering critical insights into market composition, industry evolution, and future trajectory. Covering the period from 2019 to 2033, with a base and estimated year of 2025 and a forecast period spanning 2025–2033, this report is an indispensable resource for stakeholders seeking to understand and capitalize on the burgeoning opportunities within this dynamic sector.
US Electronic Gadgets Insurance Market Market Composition & Trends
The US Electronic Gadgets Insurance Market is characterized by a moderate level of concentration, with key players like AIG and Progressive holding significant market share. The market is propelled by continuous innovation in device technology and an increasing reliance on electronic gadgets for both personal and professional use. Regulatory landscapes, while largely supportive of consumer protection, also influence product development and distribution strategies. The emergence of substitute products, such as extended warranties offered directly by manufacturers, presents a competitive challenge. Understanding end-user profiles—ranging from individuals protecting their personal devices to corporations insuring valuable business equipment—is crucial for strategic market positioning. Mergers and acquisitions (M&A) activities, with recent deal values in the hundreds of millions of dollars, continue to shape the competitive environment, consolidating market presence and expanding service portfolios.
- Market Share Distribution: Key players like AIG and Progressive account for an estimated XX% of the total market share.
- Innovation Catalysts: Rapid advancements in consumer electronics and the proliferation of smart devices.
- Regulatory Landscape: State-specific regulations governing insurance practices and consumer rights.
- Substitute Products: Manufacturer-offered extended warranties and self-insurance models.
- End-User Profiles: Diversified needs from individual consumers for mobile devices to corporate clients for IT infrastructure.
- M&A Activities: Strategic acquisitions aimed at market consolidation and service diversification, with recent deal values reaching an estimated $500 Million.
US Electronic Gadgets Insurance Market Industry Evolution
The US Electronic Gadgets Insurance Market has witnessed robust growth, driven by an escalating adoption of advanced electronic devices and a heightened consumer awareness regarding the financial implications of accidental damage, theft, and loss. Over the historical period (2019–2024), the market has seen a compound annual growth rate (CAGR) of approximately 12%, a testament to its resilience and inherent demand. Technological advancements, including the introduction of sophisticated mobile devices, high-performance laptops, and specialized equipment like drones, have continuously expanded the scope of insurable assets. This evolution has been mirrored by shifting consumer demands, with a growing preference for comprehensive, multi-device coverage plans and seamless claims processing. The increasing complexity and cost of replacing damaged or stolen electronics, estimated at an average of $700 per incident for high-end devices, further solidify the value proposition of gadget insurance. The market's growth trajectory is also influenced by the expanding digital economy, where reliance on electronic devices for work, communication, and entertainment is paramount. Projections indicate a sustained CAGR of 10% through the forecast period (2025–2033), driven by continued technological innovation and evolving consumer purchasing habits. The penetration rate of electronic gadget insurance, currently at XX%, is expected to climb significantly as more consumers recognize the importance of protecting their investments. The average policy premium has seen an upward trend, reaching an estimated $150 annually for comprehensive coverage, reflecting the increasing value of insured gadgets and the breadth of coverage offered.
Leading Regions, Countries, or Segments in US Electronic Gadgets Insurance Market
The US Electronic Gadgets Insurance Market demonstrates significant dominance across various segments, with Mobile Devices as a coverage type and Individual end-users representing the largest and fastest-growing sectors. The sheer volume of mobile device ownership across the nation, coupled with their susceptibility to damage and theft, makes them a prime target for insurance solutions. Individuals, constituting the vast majority of consumers, actively seek protection for their personal smartphones, tablets, and wearables, driving substantial market penetration.
Dominant Device Type: Mobile Devices
- Key Drivers: Pervasive ownership of smartphones and tablets; high incidence of accidental damage and theft; increasing cost of device replacement; consumer demand for seamless protection plans bundled with device purchases.
- In-depth Analysis: The mobile device segment accounts for an estimated 45% of the total US Electronic Gadgets Insurance Market. This dominance is fueled by the continuous upgrade cycle of smartphones and the critical role they play in daily life. Insurers are responding with tailored policies that cover a wide range of risks, from cracked screens to complete device loss, often with competitive deductibles starting at $50.
Dominant End User: Individual
- Key Drivers: High disposable income allocated to personal electronics; increased awareness of financial risk associated with device damage; desire for peace of mind; accessibility of online insurance platforms.
- In-depth Analysis: Individual consumers represent approximately 60% of the market's customer base. Their purchasing decisions are often influenced by brand reputation, ease of claim submission, and the perceived value of insurance in mitigating unexpected expenses. The average annual premium for individual coverage is around $120, with a XX% conversion rate from device purchase to insurance enrollment.
Dominant Coverage Type: Accidental Damage
- Key Drivers: Ubiquity of accidents involving electronic devices; consumer concern over repair costs; widespread availability of accidental damage coverage options.
- In-depth Analysis: Accidental damage claims form the largest portion of payouts in the market, estimated at XX% of all claims. This coverage is a fundamental component of most gadget insurance policies, addressing common issues like drops, spills, and impact damage, with claim resolution times averaging 3-5 business days.
US Electronic Gadgets Insurance Market Product Innovations
Product innovation in the US Electronic Gadgets Insurance Market centers on offering more comprehensive and flexible coverage options. Insurers are developing policies that cater to the evolving landscape of electronics, including specialized insurance for drones and smart home devices. A key trend is the integration of IoT capabilities for proactive risk management, potentially leading to premium reductions for users who demonstrate responsible gadget usage. Policies are increasingly offering worldwide coverage and expedited replacement services, aiming for a turnaround time of XX hours for critical device replacements. The focus is on simplifying the claims process and providing a seamless customer experience.
Propelling Factors for US Electronic Gadgets Insurance Market Growth
Several factors are propelling the growth of the US Electronic Gadgets Insurance Market. The relentless pace of technological innovation leads to an ever-expanding array of sophisticated and costly electronic devices that consumers and businesses seek to protect. Furthermore, a growing consumer awareness of the financial risks associated with device damage, theft, or loss is driving demand for insurance solutions. The ease of access to information and purchasing channels online has significantly lowered the barrier to entry for consumers. Economic stability, coupled with a rising disposable income, allows individuals and businesses to allocate funds towards preventative measures like insurance. Regulatory frameworks that protect consumer interests also foster trust and encourage market participation.
Obstacles in the US Electronic Gadgets Insurance Market Market
Despite its growth, the US Electronic Gadgets Insurance Market faces several obstacles. Regulatory complexities and variations across states can create compliance challenges for insurers operating nationwide. The threat of fraudulent claims, while managed by robust verification processes, remains a concern that can impact profitability. Supply chain disruptions, particularly for replacement parts or new devices, can lead to delays in claims fulfillment, affecting customer satisfaction. Intense competitive pressure from both established insurers and new market entrants drives down profit margins, necessitating efficient operational strategies. The relatively low penetration rate in certain demographics also presents a challenge in expanding the market reach.
Future Opportunities in US Electronic Gadgets Insurance Market
The US Electronic Gadgets Insurance Market presents significant future opportunities. The continuous innovation in consumer electronics, including the rise of 5G-enabled devices, wearables, and the burgeoning Internet of Things (IoT) ecosystem, opens avenues for new and specialized insurance products. The increasing adoption of drones for commercial purposes, from photography to agriculture and logistics, represents a rapidly growing niche market demanding tailored insurance solutions. Expanding into emerging consumer segments, such as Gen Z and younger millennials, with digital-first marketing and policy customization, offers substantial growth potential. Furthermore, partnerships with device manufacturers and retailers for bundled insurance offerings can significantly boost market penetration and customer acquisition.
Major Players in the US Electronic Gadgets Insurance Market Ecosystem
- AIG
- Progressive
- American Fidelity Assurance
- Allianz Insurance
- Aviva
- AXA
- Chubb
- Assurant Inc
- AT&T Inc
- Amica Mutual Insurance
Key Developments in US Electronic Gadgets Insurance Market Industry
- October 2023: Bolttech and Allianz Partners partnered to launch insurance solutions for embedded devices and appliances in the United States.
- February 2023: Moonrock Insurance, in collaboration with Apollo Insurance, unveiled an innovative drone insurance offering. This product aims to cover a wide range of non-standard drone operations, encompassing activities such as beyond visual line of sight (BVLOS) flights, heavy lift capabilities, swarm displays, and crop spraying.
Strategic US Electronic Gadgets Insurance Market Market Forecast
The strategic US Electronic Gadgets Insurance Market forecast anticipates continued robust growth driven by an expanding portfolio of electronic devices and an increasing consumer imperative to protect these valuable assets. Key growth catalysts include the persistent demand for mobile device insurance, the emergence of specialized coverage for drones and smart home technology, and strategic partnerships with manufacturers to embed insurance at the point of sale. The market's potential is further amplified by evolving consumer expectations for seamless digital claims processing and personalized coverage options. As technology continues to advance, the need for comprehensive and adaptable insurance solutions will only intensify, positioning the US Electronic Gadgets Insurance Market for sustained expansion and profitability.
US Electronic Gadgets Insurance Market Segmentation
-
1. Coverage Type
- 1.1. Accidental Damage
- 1.2. Theft and Loss
-
2. Device Type
- 2.1. Laptops
- 2.2. Computers
- 2.3. Cameras
- 2.4. Mobile Devices
- 2.5. Drones
-
3. End Users
- 3.1. Corporate
- 3.2. Individual
US Electronic Gadgets Insurance Market Segmentation By Geography
-
1. North America
- 1.1. United States
- 1.2. Canada
- 1.3. Mexico
-
2. South America
- 2.1. Brazil
- 2.2. Argentina
- 2.3. Rest of South America
-
3. Europe
- 3.1. United Kingdom
- 3.2. Germany
- 3.3. France
- 3.4. Italy
- 3.5. Spain
- 3.6. Russia
- 3.7. Benelux
- 3.8. Nordics
- 3.9. Rest of Europe
-
4. Middle East & Africa
- 4.1. Turkey
- 4.2. Israel
- 4.3. GCC
- 4.4. North Africa
- 4.5. South Africa
- 4.6. Rest of Middle East & Africa
-
5. Asia Pacific
- 5.1. China
- 5.2. India
- 5.3. Japan
- 5.4. South Korea
- 5.5. ASEAN
- 5.6. Oceania
- 5.7. Rest of Asia Pacific
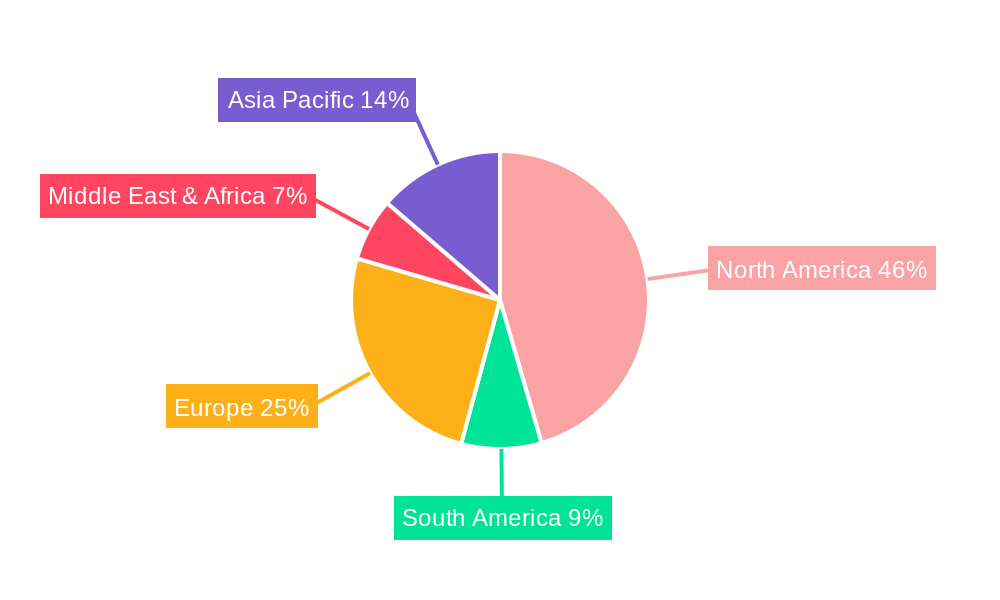
US Electronic Gadgets Insurance Market Regional Market Share
Geographic Coverage of US Electronic Gadgets Insurance Market
US Electronic Gadgets Insurance Market REPORT HIGHLIGHTS
| Aspects | Details |
|---|---|
| Study Period | 2020-2034 |
| Base Year | 2025 |
| Estimated Year | 2026 |
| Forecast Period | 2026-2034 |
| Historical Period | 2020-2025 |
| Growth Rate | CAGR of 11.54% from 2020-2034 |
| Segmentation |
|
Table of Contents
- 1. Introduction
- 1.1. Research Scope
- 1.2. Market Segmentation
- 1.3. Research Objective
- 1.4. Definitions and Assumptions
- 2. Executive Summary
- 2.1. Market Snapshot
- 3. Market Dynamics
- 3.1. Market Drivers
- 3.2. Market Restrains
- 3.3. Market Trends
- 3.4. Market Opportunities
- 4. Market Factor Analysis
- 4.1. Porters Five Forces
- 4.1.1. Bargaining Power of Suppliers
- 4.1.2. Bargaining Power of Buyers
- 4.1.3. Threat of New Entrants
- 4.1.4. Threat of Substitutes
- 4.1.5. Competitive Rivalry
- 4.2. PESTEL analysis
- 4.3. BCG Analysis
- 4.3.1. Stars (High Growth, High Market Share)
- 4.3.2. Cash Cows (Low Growth, High Market Share)
- 4.3.3. Question Mark (High Growth, Low Market Share)
- 4.3.4. Dogs (Low Growth, Low Market Share)
- 4.4. Ansoff Matrix Analysis
- 4.5. Supply Chain Analysis
- 4.6. Regulatory Landscape
- 4.7. Current Market Potential and Opportunity Assessment (TAM–SAM–SOM Framework)
- 4.8. DMV Analyst Note
- 4.1. Porters Five Forces
- 5. Market Analysis, Insights and Forecast 2021-2033
- 5.1. Market Analysis, Insights and Forecast - by Coverage Type
- 5.1.1. Accidental Damage
- 5.1.2. Theft and Loss
- 5.2. Market Analysis, Insights and Forecast - by Device Type
- 5.2.1. Laptops
- 5.2.2. Computers
- 5.2.3. Cameras
- 5.2.4. Mobile Devices
- 5.2.5. Drones
- 5.3. Market Analysis, Insights and Forecast - by End Users
- 5.3.1. Corporate
- 5.3.2. Individual
- 5.4. Market Analysis, Insights and Forecast - by Region
- 5.4.1. North America
- 5.4.2. South America
- 5.4.3. Europe
- 5.4.4. Middle East & Africa
- 5.4.5. Asia Pacific
- 5.1. Market Analysis, Insights and Forecast - by Coverage Type
- 6. Global US Electronic Gadgets Insurance Market Analysis, Insights and Forecast, 2021-2033
- 6.1. Market Analysis, Insights and Forecast - by Coverage Type
- 6.1.1. Accidental Damage
- 6.1.2. Theft and Loss
- 6.2. Market Analysis, Insights and Forecast - by Device Type
- 6.2.1. Laptops
- 6.2.2. Computers
- 6.2.3. Cameras
- 6.2.4. Mobile Devices
- 6.2.5. Drones
- 6.3. Market Analysis, Insights and Forecast - by End Users
- 6.3.1. Corporate
- 6.3.2. Individual
- 6.1. Market Analysis, Insights and Forecast - by Coverage Type
- 7. North America US Electronic Gadgets Insurance Market Analysis, Insights and Forecast, 2020-2032
- 7.1. Market Analysis, Insights and Forecast - by Coverage Type
- 7.1.1. Accidental Damage
- 7.1.2. Theft and Loss
- 7.2. Market Analysis, Insights and Forecast - by Device Type
- 7.2.1. Laptops
- 7.2.2. Computers
- 7.2.3. Cameras
- 7.2.4. Mobile Devices
- 7.2.5. Drones
- 7.3. Market Analysis, Insights and Forecast - by End Users
- 7.3.1. Corporate
- 7.3.2. Individual
- 7.1. Market Analysis, Insights and Forecast - by Coverage Type
- 8. South America US Electronic Gadgets Insurance Market Analysis, Insights and Forecast, 2020-2032
- 8.1. Market Analysis, Insights and Forecast - by Coverage Type
- 8.1.1. Accidental Damage
- 8.1.2. Theft and Loss
- 8.2. Market Analysis, Insights and Forecast - by Device Type
- 8.2.1. Laptops
- 8.2.2. Computers
- 8.2.3. Cameras
- 8.2.4. Mobile Devices
- 8.2.5. Drones
- 8.3. Market Analysis, Insights and Forecast - by End Users
- 8.3.1. Corporate
- 8.3.2. Individual
- 8.1. Market Analysis, Insights and Forecast - by Coverage Type
- 9. Europe US Electronic Gadgets Insurance Market Analysis, Insights and Forecast, 2020-2032
- 9.1. Market Analysis, Insights and Forecast - by Coverage Type
- 9.1.1. Accidental Damage
- 9.1.2. Theft and Loss
- 9.2. Market Analysis, Insights and Forecast - by Device Type
- 9.2.1. Laptops
- 9.2.2. Computers
- 9.2.3. Cameras
- 9.2.4. Mobile Devices
- 9.2.5. Drones
- 9.3. Market Analysis, Insights and Forecast - by End Users
- 9.3.1. Corporate
- 9.3.2. Individual
- 9.1. Market Analysis, Insights and Forecast - by Coverage Type
- 10. Middle East & Africa US Electronic Gadgets Insurance Market Analysis, Insights and Forecast, 2020-2032
- 10.1. Market Analysis, Insights and Forecast - by Coverage Type
- 10.1.1. Accidental Damage
- 10.1.2. Theft and Loss
- 10.2. Market Analysis, Insights and Forecast - by Device Type
- 10.2.1. Laptops
- 10.2.2. Computers
- 10.2.3. Cameras
- 10.2.4. Mobile Devices
- 10.2.5. Drones
- 10.3. Market Analysis, Insights and Forecast - by End Users
- 10.3.1. Corporate
- 10.3.2. Individual
- 10.1. Market Analysis, Insights and Forecast - by Coverage Type
- 11. Asia Pacific US Electronic Gadgets Insurance Market Analysis, Insights and Forecast, 2020-2032
- 11.1. Market Analysis, Insights and Forecast - by Coverage Type
- 11.1.1. Accidental Damage
- 11.1.2. Theft and Loss
- 11.2. Market Analysis, Insights and Forecast - by Device Type
- 11.2.1. Laptops
- 11.2.2. Computers
- 11.2.3. Cameras
- 11.2.4. Mobile Devices
- 11.2.5. Drones
- 11.3. Market Analysis, Insights and Forecast - by End Users
- 11.3.1. Corporate
- 11.3.2. Individual
- 11.1. Market Analysis, Insights and Forecast - by Coverage Type
- 12. Competitive Analysis
- 12.1. Company Profiles
- 12.1.1 AIG
- 12.1.1.1. Company Overview
- 12.1.1.2. Products
- 12.1.1.3. Company Financials
- 12.1.1.4. SWOT Analysis
- 12.1.2 Progressive**List Not Exhaustive
- 12.1.2.1. Company Overview
- 12.1.2.2. Products
- 12.1.2.3. Company Financials
- 12.1.2.4. SWOT Analysis
- 12.1.3 American Fidelity Assurance
- 12.1.3.1. Company Overview
- 12.1.3.2. Products
- 12.1.3.3. Company Financials
- 12.1.3.4. SWOT Analysis
- 12.1.4 Allianz Insurance
- 12.1.4.1. Company Overview
- 12.1.4.2. Products
- 12.1.4.3. Company Financials
- 12.1.4.4. SWOT Analysis
- 12.1.5 Aviva
- 12.1.5.1. Company Overview
- 12.1.5.2. Products
- 12.1.5.3. Company Financials
- 12.1.5.4. SWOT Analysis
- 12.1.6 AXA
- 12.1.6.1. Company Overview
- 12.1.6.2. Products
- 12.1.6.3. Company Financials
- 12.1.6.4. SWOT Analysis
- 12.1.7 Chubb
- 12.1.7.1. Company Overview
- 12.1.7.2. Products
- 12.1.7.3. Company Financials
- 12.1.7.4. SWOT Analysis
- 12.1.8 Assurant Inc
- 12.1.8.1. Company Overview
- 12.1.8.2. Products
- 12.1.8.3. Company Financials
- 12.1.8.4. SWOT Analysis
- 12.1.9 AT&T Inc
- 12.1.9.1. Company Overview
- 12.1.9.2. Products
- 12.1.9.3. Company Financials
- 12.1.9.4. SWOT Analysis
- 12.1.10 Amica Mutual Insurance
- 12.1.10.1. Company Overview
- 12.1.10.2. Products
- 12.1.10.3. Company Financials
- 12.1.10.4. SWOT Analysis
- 12.1.1 AIG
- 12.2. Market Entropy
- 12.2.1 Company's Key Areas Served
- 12.2.2 Recent Developments
- 12.3. Company Market Share Analysis 2025
- 12.3.1 Top 5 Companies Market Share Analysis
- 12.3.2 Top 3 Companies Market Share Analysis
- 12.4. List of Potential Customers
- 13. Research Methodology
List of Figures
- Figure 1: Global US Electronic Gadgets Insurance Market Revenue Breakdown (Million, %) by Region 2025 & 2033
- Figure 2: North America US Electronic Gadgets Insurance Market Revenue (Million), by Coverage Type 2025 & 2033
- Figure 3: North America US Electronic Gadgets Insurance Market Revenue Share (%), by Coverage Type 2025 & 2033
- Figure 4: North America US Electronic Gadgets Insurance Market Revenue (Million), by Device Type 2025 & 2033
- Figure 5: North America US Electronic Gadgets Insurance Market Revenue Share (%), by Device Type 2025 & 2033
- Figure 6: North America US Electronic Gadgets Insurance Market Revenue (Million), by End Users 2025 & 2033
- Figure 7: North America US Electronic Gadgets Insurance Market Revenue Share (%), by End Users 2025 & 2033
- Figure 8: North America US Electronic Gadgets Insurance Market Revenue (Million), by Country 2025 & 2033
- Figure 9: North America US Electronic Gadgets Insurance Market Revenue Share (%), by Country 2025 & 2033
- Figure 10: South America US Electronic Gadgets Insurance Market Revenue (Million), by Coverage Type 2025 & 2033
- Figure 11: South America US Electronic Gadgets Insurance Market Revenue Share (%), by Coverage Type 2025 & 2033
- Figure 12: South America US Electronic Gadgets Insurance Market Revenue (Million), by Device Type 2025 & 2033
- Figure 13: South America US Electronic Gadgets Insurance Market Revenue Share (%), by Device Type 2025 & 2033
- Figure 14: South America US Electronic Gadgets Insurance Market Revenue (Million), by End Users 2025 & 2033
- Figure 15: South America US Electronic Gadgets Insurance Market Revenue Share (%), by End Users 2025 & 2033
- Figure 16: South America US Electronic Gadgets Insurance Market Revenue (Million), by Country 2025 & 2033
- Figure 17: South America US Electronic Gadgets Insurance Market Revenue Share (%), by Country 2025 & 2033
- Figure 18: Europe US Electronic Gadgets Insurance Market Revenue (Million), by Coverage Type 2025 & 2033
- Figure 19: Europe US Electronic Gadgets Insurance Market Revenue Share (%), by Coverage Type 2025 & 2033
- Figure 20: Europe US Electronic Gadgets Insurance Market Revenue (Million), by Device Type 2025 & 2033
- Figure 21: Europe US Electronic Gadgets Insurance Market Revenue Share (%), by Device Type 2025 & 2033
- Figure 22: Europe US Electronic Gadgets Insurance Market Revenue (Million), by End Users 2025 & 2033
- Figure 23: Europe US Electronic Gadgets Insurance Market Revenue Share (%), by End Users 2025 & 2033
- Figure 24: Europe US Electronic Gadgets Insurance Market Revenue (Million), by Country 2025 & 2033
- Figure 25: Europe US Electronic Gadgets Insurance Market Revenue Share (%), by Country 2025 & 2033
- Figure 26: Middle East & Africa US Electronic Gadgets Insurance Market Revenue (Million), by Coverage Type 2025 & 2033
- Figure 27: Middle East & Africa US Electronic Gadgets Insurance Market Revenue Share (%), by Coverage Type 2025 & 2033
- Figure 28: Middle East & Africa US Electronic Gadgets Insurance Market Revenue (Million), by Device Type 2025 & 2033
- Figure 29: Middle East & Africa US Electronic Gadgets Insurance Market Revenue Share (%), by Device Type 2025 & 2033
- Figure 30: Middle East & Africa US Electronic Gadgets Insurance Market Revenue (Million), by End Users 2025 & 2033
- Figure 31: Middle East & Africa US Electronic Gadgets Insurance Market Revenue Share (%), by End Users 2025 & 2033
- Figure 32: Middle East & Africa US Electronic Gadgets Insurance Market Revenue (Million), by Country 2025 & 2033
- Figure 33: Middle East & Africa US Electronic Gadgets Insurance Market Revenue Share (%), by Country 2025 & 2033
- Figure 34: Asia Pacific US Electronic Gadgets Insurance Market Revenue (Million), by Coverage Type 2025 & 2033
- Figure 35: Asia Pacific US Electronic Gadgets Insurance Market Revenue Share (%), by Coverage Type 2025 & 2033
- Figure 36: Asia Pacific US Electronic Gadgets Insurance Market Revenue (Million), by Device Type 2025 & 2033
- Figure 37: Asia Pacific US Electronic Gadgets Insurance Market Revenue Share (%), by Device Type 2025 & 2033
- Figure 38: Asia Pacific US Electronic Gadgets Insurance Market Revenue (Million), by End Users 2025 & 2033
- Figure 39: Asia Pacific US Electronic Gadgets Insurance Market Revenue Share (%), by End Users 2025 & 2033
- Figure 40: Asia Pacific US Electronic Gadgets Insurance Market Revenue (Million), by Country 2025 & 2033
- Figure 41: Asia Pacific US Electronic Gadgets Insurance Market Revenue Share (%), by Country 2025 & 2033
List of Tables
- Table 1: Global US Electronic Gadgets Insurance Market Revenue Million Forecast, by Coverage Type 2020 & 2033
- Table 2: Global US Electronic Gadgets Insurance Market Revenue Million Forecast, by Device Type 2020 & 2033
- Table 3: Global US Electronic Gadgets Insurance Market Revenue Million Forecast, by End Users 2020 & 2033
- Table 4: Global US Electronic Gadgets Insurance Market Revenue Million Forecast, by Region 2020 & 2033
- Table 5: Global US Electronic Gadgets Insurance Market Revenue Million Forecast, by Coverage Type 2020 & 2033
- Table 6: Global US Electronic Gadgets Insurance Market Revenue Million Forecast, by Device Type 2020 & 2033
- Table 7: Global US Electronic Gadgets Insurance Market Revenue Million Forecast, by End Users 2020 & 2033
- Table 8: Global US Electronic Gadgets Insurance Market Revenue Million Forecast, by Country 2020 & 2033
- Table 9: United States US Electronic Gadgets Insurance Market Revenue (Million) Forecast, by Application 2020 & 2033
- Table 10: Canada US Electronic Gadgets Insurance Market Revenue (Million) Forecast, by Application 2020 & 2033
- Table 11: Mexico US Electronic Gadgets Insurance Market Revenue (Million) Forecast, by Application 2020 & 2033
- Table 12: Global US Electronic Gadgets Insurance Market Revenue Million Forecast, by Coverage Type 2020 & 2033
- Table 13: Global US Electronic Gadgets Insurance Market Revenue Million Forecast, by Device Type 2020 & 2033
- Table 14: Global US Electronic Gadgets Insurance Market Revenue Million Forecast, by End Users 2020 & 2033
- Table 15: Global US Electronic Gadgets Insurance Market Revenue Million Forecast, by Country 2020 & 2033
- Table 16: Brazil US Electronic Gadgets Insurance Market Revenue (Million) Forecast, by Application 2020 & 2033
- Table 17: Argentina US Electronic Gadgets Insurance Market Revenue (Million) Forecast, by Application 2020 & 2033
- Table 18: Rest of South America US Electronic Gadgets Insurance Market Revenue (Million) Forecast, by Application 2020 & 2033
- Table 19: Global US Electronic Gadgets Insurance Market Revenue Million Forecast, by Coverage Type 2020 & 2033
- Table 20: Global US Electronic Gadgets Insurance Market Revenue Million Forecast, by Device Type 2020 & 2033
- Table 21: Global US Electronic Gadgets Insurance Market Revenue Million Forecast, by End Users 2020 & 2033
- Table 22: Global US Electronic Gadgets Insurance Market Revenue Million Forecast, by Country 2020 & 2033
- Table 23: United Kingdom US Electronic Gadgets Insurance Market Revenue (Million) Forecast, by Application 2020 & 2033
- Table 24: Germany US Electronic Gadgets Insurance Market Revenue (Million) Forecast, by Application 2020 & 2033
- Table 25: France US Electronic Gadgets Insurance Market Revenue (Million) Forecast, by Application 2020 & 2033
- Table 26: Italy US Electronic Gadgets Insurance Market Revenue (Million) Forecast, by Application 2020 & 2033
- Table 27: Spain US Electronic Gadgets Insurance Market Revenue (Million) Forecast, by Application 2020 & 2033
- Table 28: Russia US Electronic Gadgets Insurance Market Revenue (Million) Forecast, by Application 2020 & 2033
- Table 29: Benelux US Electronic Gadgets Insurance Market Revenue (Million) Forecast, by Application 2020 & 2033
- Table 30: Nordics US Electronic Gadgets Insurance Market Revenue (Million) Forecast, by Application 2020 & 2033
- Table 31: Rest of Europe US Electronic Gadgets Insurance Market Revenue (Million) Forecast, by Application 2020 & 2033
- Table 32: Global US Electronic Gadgets Insurance Market Revenue Million Forecast, by Coverage Type 2020 & 2033
- Table 33: Global US Electronic Gadgets Insurance Market Revenue Million Forecast, by Device Type 2020 & 2033
- Table 34: Global US Electronic Gadgets Insurance Market Revenue Million Forecast, by End Users 2020 & 2033
- Table 35: Global US Electronic Gadgets Insurance Market Revenue Million Forecast, by Country 2020 & 2033
- Table 36: Turkey US Electronic Gadgets Insurance Market Revenue (Million) Forecast, by Application 2020 & 2033
- Table 37: Israel US Electronic Gadgets Insurance Market Revenue (Million) Forecast, by Application 2020 & 2033
- Table 38: GCC US Electronic Gadgets Insurance Market Revenue (Million) Forecast, by Application 2020 & 2033
- Table 39: North Africa US Electronic Gadgets Insurance Market Revenue (Million) Forecast, by Application 2020 & 2033
- Table 40: South Africa US Electronic Gadgets Insurance Market Revenue (Million) Forecast, by Application 2020 & 2033
- Table 41: Rest of Middle East & Africa US Electronic Gadgets Insurance Market Revenue (Million) Forecast, by Application 2020 & 2033
- Table 42: Global US Electronic Gadgets Insurance Market Revenue Million Forecast, by Coverage Type 2020 & 2033
- Table 43: Global US Electronic Gadgets Insurance Market Revenue Million Forecast, by Device Type 2020 & 2033
- Table 44: Global US Electronic Gadgets Insurance Market Revenue Million Forecast, by End Users 2020 & 2033
- Table 45: Global US Electronic Gadgets Insurance Market Revenue Million Forecast, by Country 2020 & 2033
- Table 46: China US Electronic Gadgets Insurance Market Revenue (Million) Forecast, by Application 2020 & 2033
- Table 47: India US Electronic Gadgets Insurance Market Revenue (Million) Forecast, by Application 2020 & 2033
- Table 48: Japan US Electronic Gadgets Insurance Market Revenue (Million) Forecast, by Application 2020 & 2033
- Table 49: South Korea US Electronic Gadgets Insurance Market Revenue (Million) Forecast, by Application 2020 & 2033
- Table 50: ASEAN US Electronic Gadgets Insurance Market Revenue (Million) Forecast, by Application 2020 & 2033
- Table 51: Oceania US Electronic Gadgets Insurance Market Revenue (Million) Forecast, by Application 2020 & 2033
- Table 52: Rest of Asia Pacific US Electronic Gadgets Insurance Market Revenue (Million) Forecast, by Application 2020 & 2033
Frequently Asked Questions
1. What is the projected Compound Annual Growth Rate (CAGR) of the US Electronic Gadgets Insurance Market?
The projected CAGR is approximately 11.54%.
2. Which companies are prominent players in the US Electronic Gadgets Insurance Market?
Key companies in the market include AIG, Progressive**List Not Exhaustive, American Fidelity Assurance, Allianz Insurance, Aviva, AXA, Chubb, Assurant Inc, AT&T Inc, Amica Mutual Insurance.
3. What are the main segments of the US Electronic Gadgets Insurance Market?
The market segments include Coverage Type, Device Type, End Users.
4. Can you provide details about the market size?
The market size is estimated to be USD 19.58 Million as of 2022.
5. What are some drivers contributing to market growth?
Increse in Consumer spending for Electronic gadgets.; Rising living living standard of the the people.
6. What are the notable trends driving market growth?
Increase In Demand For Electronic Gadget Post Pandemic.
7. Are there any restraints impacting market growth?
Fluctuation in price of electronic gadgets raw material.; Fragmented market in electronic gadgets insurance business.
8. Can you provide examples of recent developments in the market?
In October 2023, Bolttech and Allianz Partners partnered to launch insurance solutions for embedded devices and appliances in the United States.
9. What pricing options are available for accessing the report?
Pricing options include single-user, multi-user, and enterprise licenses priced at USD 3800, USD 4500, and USD 5800 respectively.
10. Is the market size provided in terms of value or volume?
The market size is provided in terms of value, measured in Million.
11. Are there any specific market keywords associated with the report?
Yes, the market keyword associated with the report is "US Electronic Gadgets Insurance Market," which aids in identifying and referencing the specific market segment covered.
12. How do I determine which pricing option suits my needs best?
The pricing options vary based on user requirements and access needs. Individual users may opt for single-user licenses, while businesses requiring broader access may choose multi-user or enterprise licenses for cost-effective access to the report.
13. Are there any additional resources or data provided in the US Electronic Gadgets Insurance Market report?
While the report offers comprehensive insights, it's advisable to review the specific contents or supplementary materials provided to ascertain if additional resources or data are available.
14. How can I stay updated on further developments or reports in the US Electronic Gadgets Insurance Market?
To stay informed about further developments, trends, and reports in the US Electronic Gadgets Insurance Market, consider subscribing to industry newsletters, following relevant companies and organizations, or regularly checking reputable industry news sources and publications.
Methodology
Step 1 - Identification of Relevant Samples Size from Population Database


Step 2 - Approaches for Defining Global Market Size (Value, Volume* & Price*)

Note*: In applicable scenarios
Step 3 - Data Sources
Primary Research
- Web Analytics
- Survey Reports
- Research Institute
- Latest Research Reports
- Opinion Leaders
Secondary Research
- Annual Reports
- White Paper
- Latest Press Release
- Industry Association
- Paid Database
- Investor Presentations

Step 4 - Data Triangulation
Involves using different sources of information in order to increase the validity of a study
These sources are likely to be stakeholders in a program - participants, other researchers, program staff, other community members, and so on.
Then we put all data in single framework & apply various statistical tools to find out the dynamic on the market.
During the analysis stage, feedback from the stakeholder groups would be compared to determine areas of agreement as well as areas of divergence