

Key Insights
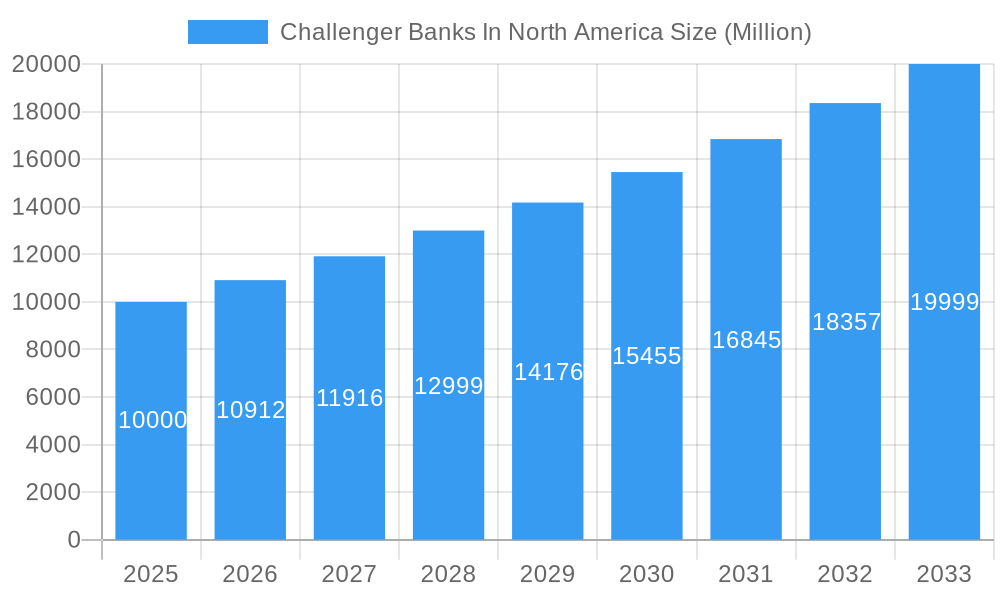
The North American challenger bank market, currently valued at approximately $10 billion (2025), is experiencing robust growth, projected to expand at a Compound Annual Growth Rate (CAGR) of 9.12% from 2025 to 2033. This surge is driven by several key factors. Firstly, increasing consumer demand for digital-first banking solutions, characterized by user-friendly interfaces, seamless mobile experiences, and personalized financial management tools, fuels the adoption of challenger banks. Secondly, the frustration with traditional banking's fees, complex processes, and lack of personalized service creates a fertile ground for challenger banks to thrive. Furthermore, technological advancements, such as open banking APIs and AI-powered financial solutions, enable challenger banks to offer innovative products and services that cater to evolving customer needs. This includes features like budgeting tools, automated savings, and early paycheck access, contributing to a competitive edge over established institutions. Key players like Chime, Varo, and others are successfully capturing market share through strategic marketing, strong customer acquisition, and continuous product innovation.
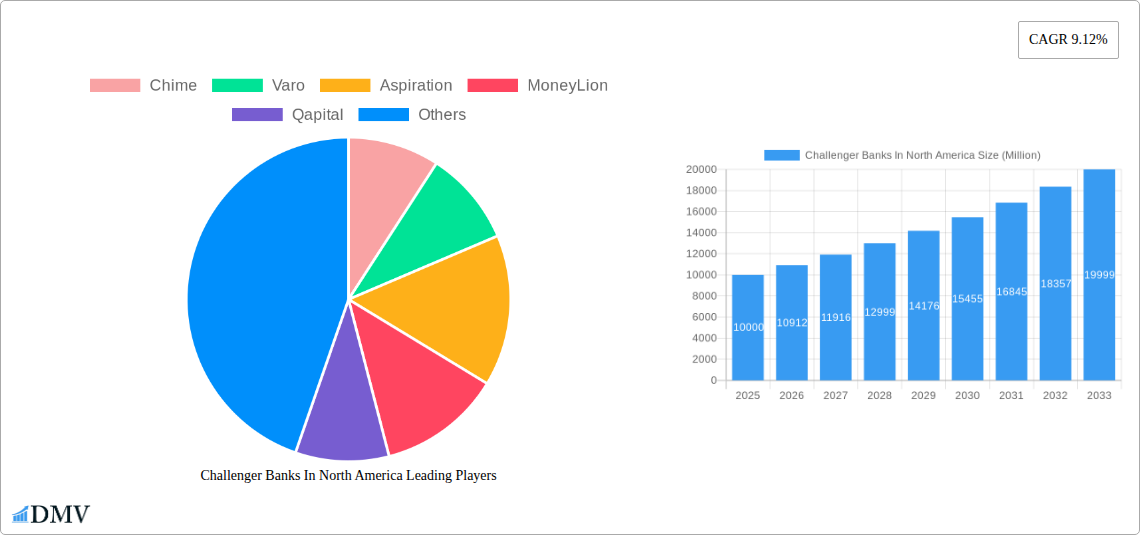
Challenger Banks In North America Market Size (In Billion)
However, challenges remain. Competition within the sector is intense, requiring continuous investment in technology and marketing to maintain a competitive position. Regulatory hurdles and the need to ensure robust security and data privacy are crucial concerns for these institutions. Furthermore, maintaining profitability while offering competitive pricing and free services can pose a significant obstacle. The ability to scale operations efficiently and effectively manage risk will be crucial for long-term success in this dynamic market. Despite these challenges, the market's strong growth trajectory suggests that challenger banks will continue to play a significant role in shaping the future of the North American financial landscape.
Challenger Banks In North America Company Market Share
Challenger Banks in North America: A Comprehensive Market Report (2019-2033)
This insightful report provides a detailed analysis of the North American challenger bank market, offering a comprehensive overview of its current state, future trajectory, and key players. With a study period spanning 2019-2033, a base year of 2025, and a forecast period of 2025-2033, this report is an essential resource for stakeholders seeking to understand and capitalize on the dynamic opportunities within this rapidly evolving sector. The report leverages extensive data analysis, including market share distribution and M&A deal values (in Millions of USD), to paint a clear picture of the competitive landscape and future prospects.
Challenger Banks In North America Market Composition & Trends
This section delves into the competitive dynamics of the North American challenger banking market, analyzing market concentration, innovation drivers, regulatory hurdles, substitute financial products, customer demographics, and merger & acquisition (M&A) activity. We explore the market share distribution among key players, quantifying the dominance of specific firms and identifying emerging competitors. Our analysis includes detailed examination of M&A deal values, pinpointing significant transactions and their implications for market consolidation.
- Market Concentration: The market is moderately concentrated, with a few dominant players holding significant market share, while numerous smaller players compete for niche segments. Market share data for 2024 shows Chime holding approximately xx% market share, followed by Varo at xx%, and Aspiration at xx%. These figures are based on estimates using various publicly available data points.
- Innovation Catalysts: Technological advancements, particularly in mobile banking and fintech integration, are significant innovation drivers. Open banking initiatives are also fostering innovation by facilitating data sharing and creating opportunities for new service offerings.
- Regulatory Landscape: The regulatory environment is evolving, with increasing scrutiny of data privacy, cybersecurity, and consumer protection. This is leading to higher compliance costs and potential barriers to entry for smaller players.
- Substitute Products: Traditional banks and other financial technology firms offering similar services pose significant competitive pressure. The increasing availability of digital payment platforms further adds to the competitive landscape.
- End-User Profiles: The target market includes millennials and Gen Z consumers who are digitally native and prefer convenient, personalized financial services. The report details the specific demographic trends fueling market growth.
- M&A Activities: Significant M&A activity has been observed in the past few years, with deal values totaling over $xx Million. These activities are reshaping the competitive landscape and driving consolidation. Specific deal examples are detailed within the report.
Challenger Banks In North America Industry Evolution
This section provides a comprehensive overview of the evolution of the North American challenger banking industry. It analyzes market growth trajectories, highlighting significant technological advancements that are transforming the industry. The analysis also considers shifts in consumer preferences and demands that have been key drivers for the industry. Specific data points illustrating growth rates and adoption metrics for key technologies are presented. The report also analyzes the impact of changing regulations and economic factors on industry growth. We detail the transition from traditional banking models to the digital-first approach adopted by challenger banks. The analysis examines the competitive landscape, encompassing both established players and emerging disruptors, and explores how the industry is adapting to evolving consumer needs.
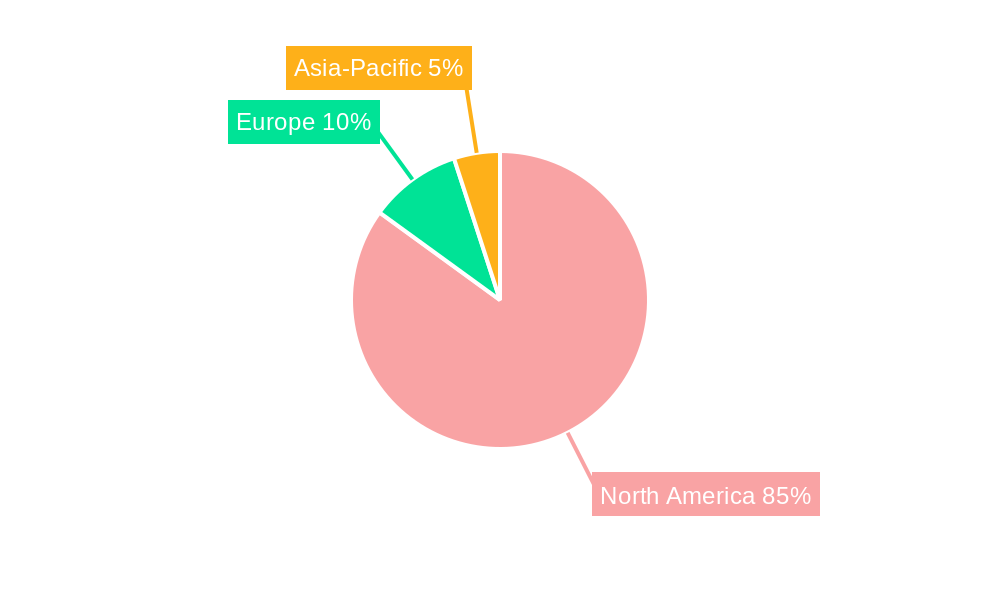
Leading Regions, Countries, or Segments in Challenger Banks In North America
This section pinpoints the dominant regions, countries, or segments within the North American challenger bank market. We provide a detailed analysis explaining the factors contributing to their leading positions.
- Key Drivers:
- Investment Trends: Significant venture capital and private equity investments have flowed into specific regions, particularly those with favorable regulatory environments and high concentrations of tech talent.
- Regulatory Support: Certain regions boast regulatory frameworks that are more conducive to innovation and the growth of challenger banks. This regulatory environment has fostered a more competitive and dynamic marketplace.
- Consumer Adoption: High levels of digital adoption and consumer demand for alternative financial services in certain regions have created favorable conditions for challenger banks to thrive.
- In-depth Analysis: The report analyzes specific regional and segmental variations and provides detailed explanations for variations in growth rates and market penetration among different areas of North America. The dominance of specific geographical markets is closely examined in relation to economic and demographic factors.
Challenger Banks In North America Product Innovations
This section details the innovative product offerings and applications driving growth within the sector. We examine the unique value propositions of challenger banks and the technological advancements underpinning their offerings. The analysis features key performance indicators and adoption rates for these innovative products and explores how these offerings are reshaping the financial services industry.
Propelling Factors for Challenger Banks In North America Growth
Several factors are driving the growth of challenger banks in North America. Technological advancements, such as mobile-first platforms and AI-powered personalized services, are key. Favorable economic conditions, including increased consumer disposable income and a growing demand for digital financial services, also contribute. Finally, supportive regulatory frameworks that encourage innovation and competition are crucial elements driving growth within the sector.
Obstacles in the Challenger Banks In North America Market
The North American challenger bank market faces several challenges. Regulatory hurdles, such as compliance costs and licensing requirements, pose significant barriers. Competition from established banks and other fintech companies also creates pressure. Further, attracting and retaining talent in a competitive tech landscape presents ongoing challenges to the industry.
Future Opportunities in Challenger Banks In North America
The future of the North American challenger bank market holds significant opportunities. Expansion into underserved markets, the adoption of emerging technologies (like blockchain and embedded finance), and catering to the evolving needs of digitally savvy consumers present key areas for growth.
Key Developments in Challenger Banks In North America Industry
- March 2023: US challenger Varo Bank reportedly raised USD 50 million at a USD 1.8 billion valuation, representing a 28% decline in value since its last fundraising round. This signifies a shift in investor sentiment towards challenger banks.
- October 2022: Aspiration launched its first credit card, the Aspiration Zero Credit Card. This product launch reflects the increasing diversification of product offerings within the challenger bank sector.
Strategic Challenger Banks In North America Market Forecast
The North American challenger bank market is poised for continued growth, driven by technological innovation, changing consumer preferences, and favorable regulatory environments. While challenges remain, the market's long-term potential is significant, with substantial opportunities for both established players and new entrants. We project significant expansion across multiple segments in the coming years, based on our analysis of current market trends and future growth drivers.
Challenger Banks In North America Segmentation
-
1. Service Type
- 1.1. Loans
- 1.2. Mobile Banking
- 1.3. Checking & Savings Account
- 1.4. Payment & Money Transfer
- 1.5. Others
-
2. End-User Type
- 2.1. Business
- 2.2. Personal
Challenger Banks In North America Segmentation By Geography
-
1. North America
- 1.1. United States
- 1.2. Canada
- 1.3. Mexico
-
2. South America
- 2.1. Brazil
- 2.2. Argentina
- 2.3. Rest of South America
-
3. Europe
- 3.1. United Kingdom
- 3.2. Germany
- 3.3. France
- 3.4. Italy
- 3.5. Spain
- 3.6. Russia
- 3.7. Benelux
- 3.8. Nordics
- 3.9. Rest of Europe
-
4. Middle East & Africa
- 4.1. Turkey
- 4.2. Israel
- 4.3. GCC
- 4.4. North Africa
- 4.5. South Africa
- 4.6. Rest of Middle East & Africa
-
5. Asia Pacific
- 5.1. China
- 5.2. India
- 5.3. Japan
- 5.4. South Korea
- 5.5. ASEAN
- 5.6. Oceania
- 5.7. Rest of Asia Pacific
Challenger Banks In North America Regional Market Share
Geographic Coverage of Challenger Banks In North America
Challenger Banks In North America REPORT HIGHLIGHTS
| Aspects | Details |
|---|---|
| Study Period | 2020-2034 |
| Base Year | 2025 |
| Estimated Year | 2026 |
| Forecast Period | 2026-2034 |
| Historical Period | 2020-2025 |
| Growth Rate | CAGR of 9.12% from 2020-2034 |
| Segmentation |
|
Table of Contents
- 1. Introduction
- 1.1. Research Scope
- 1.2. Market Segmentation
- 1.3. Research Objective
- 1.4. Definitions and Assumptions
- 2. Executive Summary
- 2.1. Market Snapshot
- 3. Market Dynamics
- 3.1. Market Drivers
- 3.2. Market Restrains
- 3.3. Market Trends
- 3.4. Market Opportunities
- 4. Market Factor Analysis
- 4.1. Porters Five Forces
- 4.1.1. Bargaining Power of Suppliers
- 4.1.2. Bargaining Power of Buyers
- 4.1.3. Threat of New Entrants
- 4.1.4. Threat of Substitutes
- 4.1.5. Competitive Rivalry
- 4.2. PESTEL analysis
- 4.3. BCG Analysis
- 4.3.1. Stars (High Growth, High Market Share)
- 4.3.2. Cash Cows (Low Growth, High Market Share)
- 4.3.3. Question Mark (High Growth, Low Market Share)
- 4.3.4. Dogs (Low Growth, Low Market Share)
- 4.4. Ansoff Matrix Analysis
- 4.5. Supply Chain Analysis
- 4.6. Regulatory Landscape
- 4.7. Current Market Potential and Opportunity Assessment (TAM–SAM–SOM Framework)
- 4.8. DMV Analyst Note
- 4.1. Porters Five Forces
- 5. Market Analysis, Insights and Forecast 2021-2033
- 5.1. Market Analysis, Insights and Forecast - by Service Type
- 5.1.1. Loans
- 5.1.2. Mobile Banking
- 5.1.3. Checking & Savings Account
- 5.1.4. Payment & Money Transfer
- 5.1.5. Others
- 5.2. Market Analysis, Insights and Forecast - by End-User Type
- 5.2.1. Business
- 5.2.2. Personal
- 5.3. Market Analysis, Insights and Forecast - by Region
- 5.3.1. North America
- 5.3.2. South America
- 5.3.3. Europe
- 5.3.4. Middle East & Africa
- 5.3.5. Asia Pacific
- 5.1. Market Analysis, Insights and Forecast - by Service Type
- 6. Global Challenger Banks In North America Analysis, Insights and Forecast, 2021-2033
- 6.1. Market Analysis, Insights and Forecast - by Service Type
- 6.1.1. Loans
- 6.1.2. Mobile Banking
- 6.1.3. Checking & Savings Account
- 6.1.4. Payment & Money Transfer
- 6.1.5. Others
- 6.2. Market Analysis, Insights and Forecast - by End-User Type
- 6.2.1. Business
- 6.2.2. Personal
- 6.1. Market Analysis, Insights and Forecast - by Service Type
- 7. North America Challenger Banks In North America Analysis, Insights and Forecast, 2020-2032
- 7.1. Market Analysis, Insights and Forecast - by Service Type
- 7.1.1. Loans
- 7.1.2. Mobile Banking
- 7.1.3. Checking & Savings Account
- 7.1.4. Payment & Money Transfer
- 7.1.5. Others
- 7.2. Market Analysis, Insights and Forecast - by End-User Type
- 7.2.1. Business
- 7.2.2. Personal
- 7.1. Market Analysis, Insights and Forecast - by Service Type
- 8. South America Challenger Banks In North America Analysis, Insights and Forecast, 2020-2032
- 8.1. Market Analysis, Insights and Forecast - by Service Type
- 8.1.1. Loans
- 8.1.2. Mobile Banking
- 8.1.3. Checking & Savings Account
- 8.1.4. Payment & Money Transfer
- 8.1.5. Others
- 8.2. Market Analysis, Insights and Forecast - by End-User Type
- 8.2.1. Business
- 8.2.2. Personal
- 8.1. Market Analysis, Insights and Forecast - by Service Type
- 9. Europe Challenger Banks In North America Analysis, Insights and Forecast, 2020-2032
- 9.1. Market Analysis, Insights and Forecast - by Service Type
- 9.1.1. Loans
- 9.1.2. Mobile Banking
- 9.1.3. Checking & Savings Account
- 9.1.4. Payment & Money Transfer
- 9.1.5. Others
- 9.2. Market Analysis, Insights and Forecast - by End-User Type
- 9.2.1. Business
- 9.2.2. Personal
- 9.1. Market Analysis, Insights and Forecast - by Service Type
- 10. Middle East & Africa Challenger Banks In North America Analysis, Insights and Forecast, 2020-2032
- 10.1. Market Analysis, Insights and Forecast - by Service Type
- 10.1.1. Loans
- 10.1.2. Mobile Banking
- 10.1.3. Checking & Savings Account
- 10.1.4. Payment & Money Transfer
- 10.1.5. Others
- 10.2. Market Analysis, Insights and Forecast - by End-User Type
- 10.2.1. Business
- 10.2.2. Personal
- 10.1. Market Analysis, Insights and Forecast - by Service Type
- 11. Asia Pacific Challenger Banks In North America Analysis, Insights and Forecast, 2020-2032
- 11.1. Market Analysis, Insights and Forecast - by Service Type
- 11.1.1. Loans
- 11.1.2. Mobile Banking
- 11.1.3. Checking & Savings Account
- 11.1.4. Payment & Money Transfer
- 11.1.5. Others
- 11.2. Market Analysis, Insights and Forecast - by End-User Type
- 11.2.1. Business
- 11.2.2. Personal
- 11.1. Market Analysis, Insights and Forecast - by Service Type
- 12. Competitive Analysis
- 12.1. Company Profiles
- 12.1.1 Chime
- 12.1.1.1. Company Overview
- 12.1.1.2. Products
- 12.1.1.3. Company Financials
- 12.1.1.4. SWOT Analysis
- 12.1.2 Varo
- 12.1.2.1. Company Overview
- 12.1.2.2. Products
- 12.1.2.3. Company Financials
- 12.1.2.4. SWOT Analysis
- 12.1.3 Aspiration
- 12.1.3.1. Company Overview
- 12.1.3.2. Products
- 12.1.3.3. Company Financials
- 12.1.3.4. SWOT Analysis
- 12.1.4 MoneyLion
- 12.1.4.1. Company Overview
- 12.1.4.2. Products
- 12.1.4.3. Company Financials
- 12.1.4.4. SWOT Analysis
- 12.1.5 Qapital
- 12.1.5.1. Company Overview
- 12.1.5.2. Products
- 12.1.5.3. Company Financials
- 12.1.5.4. SWOT Analysis
- 12.1.6 BankMobile
- 12.1.6.1. Company Overview
- 12.1.6.2. Products
- 12.1.6.3. Company Financials
- 12.1.6.4. SWOT Analysis
- 12.1.7 Upgrade
- 12.1.7.1. Company Overview
- 12.1.7.2. Products
- 12.1.7.3. Company Financials
- 12.1.7.4. SWOT Analysis
- 12.1.8 Dave
- 12.1.8.1. Company Overview
- 12.1.8.2. Products
- 12.1.8.3. Company Financials
- 12.1.8.4. SWOT Analysis
- 12.1.9 Zero
- 12.1.9.1. Company Overview
- 12.1.9.2. Products
- 12.1.9.3. Company Financials
- 12.1.9.4. SWOT Analysis
- 12.1.10 Stash
- 12.1.10.1. Company Overview
- 12.1.10.2. Products
- 12.1.10.3. Company Financials
- 12.1.10.4. SWOT Analysis
- 12.1.11 Deserve
- 12.1.11.1. Company Overview
- 12.1.11.2. Products
- 12.1.11.3. Company Financials
- 12.1.11.4. SWOT Analysis
- 12.1.12 Current**List Not Exhaustive
- 12.1.12.1. Company Overview
- 12.1.12.2. Products
- 12.1.12.3. Company Financials
- 12.1.12.4. SWOT Analysis
- 12.1.1 Chime
- 12.2. Market Entropy
- 12.2.1 Company's Key Areas Served
- 12.2.2 Recent Developments
- 12.3. Company Market Share Analysis 2025
- 12.3.1 Top 5 Companies Market Share Analysis
- 12.3.2 Top 3 Companies Market Share Analysis
- 12.4. List of Potential Customers
- 13. Research Methodology
List of Figures
- Figure 1: Global Challenger Banks In North America Revenue Breakdown (Million, %) by Region 2025 & 2033
- Figure 2: Global Challenger Banks In North America Volume Breakdown (Billion, %) by Region 2025 & 2033
- Figure 3: North America Challenger Banks In North America Revenue (Million), by Service Type 2025 & 2033
- Figure 4: North America Challenger Banks In North America Volume (Billion), by Service Type 2025 & 2033
- Figure 5: North America Challenger Banks In North America Revenue Share (%), by Service Type 2025 & 2033
- Figure 6: North America Challenger Banks In North America Volume Share (%), by Service Type 2025 & 2033
- Figure 7: North America Challenger Banks In North America Revenue (Million), by End-User Type 2025 & 2033
- Figure 8: North America Challenger Banks In North America Volume (Billion), by End-User Type 2025 & 2033
- Figure 9: North America Challenger Banks In North America Revenue Share (%), by End-User Type 2025 & 2033
- Figure 10: North America Challenger Banks In North America Volume Share (%), by End-User Type 2025 & 2033
- Figure 11: North America Challenger Banks In North America Revenue (Million), by Country 2025 & 2033
- Figure 12: North America Challenger Banks In North America Volume (Billion), by Country 2025 & 2033
- Figure 13: North America Challenger Banks In North America Revenue Share (%), by Country 2025 & 2033
- Figure 14: North America Challenger Banks In North America Volume Share (%), by Country 2025 & 2033
- Figure 15: South America Challenger Banks In North America Revenue (Million), by Service Type 2025 & 2033
- Figure 16: South America Challenger Banks In North America Volume (Billion), by Service Type 2025 & 2033
- Figure 17: South America Challenger Banks In North America Revenue Share (%), by Service Type 2025 & 2033
- Figure 18: South America Challenger Banks In North America Volume Share (%), by Service Type 2025 & 2033
- Figure 19: South America Challenger Banks In North America Revenue (Million), by End-User Type 2025 & 2033
- Figure 20: South America Challenger Banks In North America Volume (Billion), by End-User Type 2025 & 2033
- Figure 21: South America Challenger Banks In North America Revenue Share (%), by End-User Type 2025 & 2033
- Figure 22: South America Challenger Banks In North America Volume Share (%), by End-User Type 2025 & 2033
- Figure 23: South America Challenger Banks In North America Revenue (Million), by Country 2025 & 2033
- Figure 24: South America Challenger Banks In North America Volume (Billion), by Country 2025 & 2033
- Figure 25: South America Challenger Banks In North America Revenue Share (%), by Country 2025 & 2033
- Figure 26: South America Challenger Banks In North America Volume Share (%), by Country 2025 & 2033
- Figure 27: Europe Challenger Banks In North America Revenue (Million), by Service Type 2025 & 2033
- Figure 28: Europe Challenger Banks In North America Volume (Billion), by Service Type 2025 & 2033
- Figure 29: Europe Challenger Banks In North America Revenue Share (%), by Service Type 2025 & 2033
- Figure 30: Europe Challenger Banks In North America Volume Share (%), by Service Type 2025 & 2033
- Figure 31: Europe Challenger Banks In North America Revenue (Million), by End-User Type 2025 & 2033
- Figure 32: Europe Challenger Banks In North America Volume (Billion), by End-User Type 2025 & 2033
- Figure 33: Europe Challenger Banks In North America Revenue Share (%), by End-User Type 2025 & 2033
- Figure 34: Europe Challenger Banks In North America Volume Share (%), by End-User Type 2025 & 2033
- Figure 35: Europe Challenger Banks In North America Revenue (Million), by Country 2025 & 2033
- Figure 36: Europe Challenger Banks In North America Volume (Billion), by Country 2025 & 2033
- Figure 37: Europe Challenger Banks In North America Revenue Share (%), by Country 2025 & 2033
- Figure 38: Europe Challenger Banks In North America Volume Share (%), by Country 2025 & 2033
- Figure 39: Middle East & Africa Challenger Banks In North America Revenue (Million), by Service Type 2025 & 2033
- Figure 40: Middle East & Africa Challenger Banks In North America Volume (Billion), by Service Type 2025 & 2033
- Figure 41: Middle East & Africa Challenger Banks In North America Revenue Share (%), by Service Type 2025 & 2033
- Figure 42: Middle East & Africa Challenger Banks In North America Volume Share (%), by Service Type 2025 & 2033
- Figure 43: Middle East & Africa Challenger Banks In North America Revenue (Million), by End-User Type 2025 & 2033
- Figure 44: Middle East & Africa Challenger Banks In North America Volume (Billion), by End-User Type 2025 & 2033
- Figure 45: Middle East & Africa Challenger Banks In North America Revenue Share (%), by End-User Type 2025 & 2033
- Figure 46: Middle East & Africa Challenger Banks In North America Volume Share (%), by End-User Type 2025 & 2033
- Figure 47: Middle East & Africa Challenger Banks In North America Revenue (Million), by Country 2025 & 2033
- Figure 48: Middle East & Africa Challenger Banks In North America Volume (Billion), by Country 2025 & 2033
- Figure 49: Middle East & Africa Challenger Banks In North America Revenue Share (%), by Country 2025 & 2033
- Figure 50: Middle East & Africa Challenger Banks In North America Volume Share (%), by Country 2025 & 2033
- Figure 51: Asia Pacific Challenger Banks In North America Revenue (Million), by Service Type 2025 & 2033
- Figure 52: Asia Pacific Challenger Banks In North America Volume (Billion), by Service Type 2025 & 2033
- Figure 53: Asia Pacific Challenger Banks In North America Revenue Share (%), by Service Type 2025 & 2033
- Figure 54: Asia Pacific Challenger Banks In North America Volume Share (%), by Service Type 2025 & 2033
- Figure 55: Asia Pacific Challenger Banks In North America Revenue (Million), by End-User Type 2025 & 2033
- Figure 56: Asia Pacific Challenger Banks In North America Volume (Billion), by End-User Type 2025 & 2033
- Figure 57: Asia Pacific Challenger Banks In North America Revenue Share (%), by End-User Type 2025 & 2033
- Figure 58: Asia Pacific Challenger Banks In North America Volume Share (%), by End-User Type 2025 & 2033
- Figure 59: Asia Pacific Challenger Banks In North America Revenue (Million), by Country 2025 & 2033
- Figure 60: Asia Pacific Challenger Banks In North America Volume (Billion), by Country 2025 & 2033
- Figure 61: Asia Pacific Challenger Banks In North America Revenue Share (%), by Country 2025 & 2033
- Figure 62: Asia Pacific Challenger Banks In North America Volume Share (%), by Country 2025 & 2033
List of Tables
- Table 1: Global Challenger Banks In North America Revenue Million Forecast, by Service Type 2020 & 2033
- Table 2: Global Challenger Banks In North America Volume Billion Forecast, by Service Type 2020 & 2033
- Table 3: Global Challenger Banks In North America Revenue Million Forecast, by End-User Type 2020 & 2033
- Table 4: Global Challenger Banks In North America Volume Billion Forecast, by End-User Type 2020 & 2033
- Table 5: Global Challenger Banks In North America Revenue Million Forecast, by Region 2020 & 2033
- Table 6: Global Challenger Banks In North America Volume Billion Forecast, by Region 2020 & 2033
- Table 7: Global Challenger Banks In North America Revenue Million Forecast, by Service Type 2020 & 2033
- Table 8: Global Challenger Banks In North America Volume Billion Forecast, by Service Type 2020 & 2033
- Table 9: Global Challenger Banks In North America Revenue Million Forecast, by End-User Type 2020 & 2033
- Table 10: Global Challenger Banks In North America Volume Billion Forecast, by End-User Type 2020 & 2033
- Table 11: Global Challenger Banks In North America Revenue Million Forecast, by Country 2020 & 2033
- Table 12: Global Challenger Banks In North America Volume Billion Forecast, by Country 2020 & 2033
- Table 13: United States Challenger Banks In North America Revenue (Million) Forecast, by Application 2020 & 2033
- Table 14: United States Challenger Banks In North America Volume (Billion) Forecast, by Application 2020 & 2033
- Table 15: Canada Challenger Banks In North America Revenue (Million) Forecast, by Application 2020 & 2033
- Table 16: Canada Challenger Banks In North America Volume (Billion) Forecast, by Application 2020 & 2033
- Table 17: Mexico Challenger Banks In North America Revenue (Million) Forecast, by Application 2020 & 2033
- Table 18: Mexico Challenger Banks In North America Volume (Billion) Forecast, by Application 2020 & 2033
- Table 19: Global Challenger Banks In North America Revenue Million Forecast, by Service Type 2020 & 2033
- Table 20: Global Challenger Banks In North America Volume Billion Forecast, by Service Type 2020 & 2033
- Table 21: Global Challenger Banks In North America Revenue Million Forecast, by End-User Type 2020 & 2033
- Table 22: Global Challenger Banks In North America Volume Billion Forecast, by End-User Type 2020 & 2033
- Table 23: Global Challenger Banks In North America Revenue Million Forecast, by Country 2020 & 2033
- Table 24: Global Challenger Banks In North America Volume Billion Forecast, by Country 2020 & 2033
- Table 25: Brazil Challenger Banks In North America Revenue (Million) Forecast, by Application 2020 & 2033
- Table 26: Brazil Challenger Banks In North America Volume (Billion) Forecast, by Application 2020 & 2033
- Table 27: Argentina Challenger Banks In North America Revenue (Million) Forecast, by Application 2020 & 2033
- Table 28: Argentina Challenger Banks In North America Volume (Billion) Forecast, by Application 2020 & 2033
- Table 29: Rest of South America Challenger Banks In North America Revenue (Million) Forecast, by Application 2020 & 2033
- Table 30: Rest of South America Challenger Banks In North America Volume (Billion) Forecast, by Application 2020 & 2033
- Table 31: Global Challenger Banks In North America Revenue Million Forecast, by Service Type 2020 & 2033
- Table 32: Global Challenger Banks In North America Volume Billion Forecast, by Service Type 2020 & 2033
- Table 33: Global Challenger Banks In North America Revenue Million Forecast, by End-User Type 2020 & 2033
- Table 34: Global Challenger Banks In North America Volume Billion Forecast, by End-User Type 2020 & 2033
- Table 35: Global Challenger Banks In North America Revenue Million Forecast, by Country 2020 & 2033
- Table 36: Global Challenger Banks In North America Volume Billion Forecast, by Country 2020 & 2033
- Table 37: United Kingdom Challenger Banks In North America Revenue (Million) Forecast, by Application 2020 & 2033
- Table 38: United Kingdom Challenger Banks In North America Volume (Billion) Forecast, by Application 2020 & 2033
- Table 39: Germany Challenger Banks In North America Revenue (Million) Forecast, by Application 2020 & 2033
- Table 40: Germany Challenger Banks In North America Volume (Billion) Forecast, by Application 2020 & 2033
- Table 41: France Challenger Banks In North America Revenue (Million) Forecast, by Application 2020 & 2033
- Table 42: France Challenger Banks In North America Volume (Billion) Forecast, by Application 2020 & 2033
- Table 43: Italy Challenger Banks In North America Revenue (Million) Forecast, by Application 2020 & 2033
- Table 44: Italy Challenger Banks In North America Volume (Billion) Forecast, by Application 2020 & 2033
- Table 45: Spain Challenger Banks In North America Revenue (Million) Forecast, by Application 2020 & 2033
- Table 46: Spain Challenger Banks In North America Volume (Billion) Forecast, by Application 2020 & 2033
- Table 47: Russia Challenger Banks In North America Revenue (Million) Forecast, by Application 2020 & 2033
- Table 48: Russia Challenger Banks In North America Volume (Billion) Forecast, by Application 2020 & 2033
- Table 49: Benelux Challenger Banks In North America Revenue (Million) Forecast, by Application 2020 & 2033
- Table 50: Benelux Challenger Banks In North America Volume (Billion) Forecast, by Application 2020 & 2033
- Table 51: Nordics Challenger Banks In North America Revenue (Million) Forecast, by Application 2020 & 2033
- Table 52: Nordics Challenger Banks In North America Volume (Billion) Forecast, by Application 2020 & 2033
- Table 53: Rest of Europe Challenger Banks In North America Revenue (Million) Forecast, by Application 2020 & 2033
- Table 54: Rest of Europe Challenger Banks In North America Volume (Billion) Forecast, by Application 2020 & 2033
- Table 55: Global Challenger Banks In North America Revenue Million Forecast, by Service Type 2020 & 2033
- Table 56: Global Challenger Banks In North America Volume Billion Forecast, by Service Type 2020 & 2033
- Table 57: Global Challenger Banks In North America Revenue Million Forecast, by End-User Type 2020 & 2033
- Table 58: Global Challenger Banks In North America Volume Billion Forecast, by End-User Type 2020 & 2033
- Table 59: Global Challenger Banks In North America Revenue Million Forecast, by Country 2020 & 2033
- Table 60: Global Challenger Banks In North America Volume Billion Forecast, by Country 2020 & 2033
- Table 61: Turkey Challenger Banks In North America Revenue (Million) Forecast, by Application 2020 & 2033
- Table 62: Turkey Challenger Banks In North America Volume (Billion) Forecast, by Application 2020 & 2033
- Table 63: Israel Challenger Banks In North America Revenue (Million) Forecast, by Application 2020 & 2033
- Table 64: Israel Challenger Banks In North America Volume (Billion) Forecast, by Application 2020 & 2033
- Table 65: GCC Challenger Banks In North America Revenue (Million) Forecast, by Application 2020 & 2033
- Table 66: GCC Challenger Banks In North America Volume (Billion) Forecast, by Application 2020 & 2033
- Table 67: North Africa Challenger Banks In North America Revenue (Million) Forecast, by Application 2020 & 2033
- Table 68: North Africa Challenger Banks In North America Volume (Billion) Forecast, by Application 2020 & 2033
- Table 69: South Africa Challenger Banks In North America Revenue (Million) Forecast, by Application 2020 & 2033
- Table 70: South Africa Challenger Banks In North America Volume (Billion) Forecast, by Application 2020 & 2033
- Table 71: Rest of Middle East & Africa Challenger Banks In North America Revenue (Million) Forecast, by Application 2020 & 2033
- Table 72: Rest of Middle East & Africa Challenger Banks In North America Volume (Billion) Forecast, by Application 2020 & 2033
- Table 73: Global Challenger Banks In North America Revenue Million Forecast, by Service Type 2020 & 2033
- Table 74: Global Challenger Banks In North America Volume Billion Forecast, by Service Type 2020 & 2033
- Table 75: Global Challenger Banks In North America Revenue Million Forecast, by End-User Type 2020 & 2033
- Table 76: Global Challenger Banks In North America Volume Billion Forecast, by End-User Type 2020 & 2033
- Table 77: Global Challenger Banks In North America Revenue Million Forecast, by Country 2020 & 2033
- Table 78: Global Challenger Banks In North America Volume Billion Forecast, by Country 2020 & 2033
- Table 79: China Challenger Banks In North America Revenue (Million) Forecast, by Application 2020 & 2033
- Table 80: China Challenger Banks In North America Volume (Billion) Forecast, by Application 2020 & 2033
- Table 81: India Challenger Banks In North America Revenue (Million) Forecast, by Application 2020 & 2033
- Table 82: India Challenger Banks In North America Volume (Billion) Forecast, by Application 2020 & 2033
- Table 83: Japan Challenger Banks In North America Revenue (Million) Forecast, by Application 2020 & 2033
- Table 84: Japan Challenger Banks In North America Volume (Billion) Forecast, by Application 2020 & 2033
- Table 85: South Korea Challenger Banks In North America Revenue (Million) Forecast, by Application 2020 & 2033
- Table 86: South Korea Challenger Banks In North America Volume (Billion) Forecast, by Application 2020 & 2033
- Table 87: ASEAN Challenger Banks In North America Revenue (Million) Forecast, by Application 2020 & 2033
- Table 88: ASEAN Challenger Banks In North America Volume (Billion) Forecast, by Application 2020 & 2033
- Table 89: Oceania Challenger Banks In North America Revenue (Million) Forecast, by Application 2020 & 2033
- Table 90: Oceania Challenger Banks In North America Volume (Billion) Forecast, by Application 2020 & 2033
- Table 91: Rest of Asia Pacific Challenger Banks In North America Revenue (Million) Forecast, by Application 2020 & 2033
- Table 92: Rest of Asia Pacific Challenger Banks In North America Volume (Billion) Forecast, by Application 2020 & 2033
Frequently Asked Questions
1. What is the projected Compound Annual Growth Rate (CAGR) of the Challenger Banks In North America?
The projected CAGR is approximately 9.12%.
2. Which companies are prominent players in the Challenger Banks In North America?
Key companies in the market include Chime, Varo, Aspiration, MoneyLion, Qapital, BankMobile, Upgrade, Dave, Zero, Stash, Deserve, Current**List Not Exhaustive.
3. What are the main segments of the Challenger Banks In North America?
The market segments include Service Type, End-User Type.
4. Can you provide details about the market size?
The market size is estimated to be USD 10 Million as of 2022.
5. What are some drivers contributing to market growth?
N/A
6. What are the notable trends driving market growth?
Convenience Offered to Consumers Drives The Market.
7. Are there any restraints impacting market growth?
N/A
8. Can you provide examples of recent developments in the market?
March 2023: US challenger Varo Bank is reportedly raising USD 50 million at a USD 1.8 billion valuation, a 28% decline in value since its last fundraising. The firm was valued at USD 2.5 billion in September 2021 after raising USD 510 million in a Series E funding round led by Lone Pine Capital.
9. What pricing options are available for accessing the report?
Pricing options include single-user, multi-user, and enterprise licenses priced at USD 4750, USD 4950, and USD 6800 respectively.
10. Is the market size provided in terms of value or volume?
The market size is provided in terms of value, measured in Million and volume, measured in Billion.
11. Are there any specific market keywords associated with the report?
Yes, the market keyword associated with the report is "Challenger Banks In North America," which aids in identifying and referencing the specific market segment covered.
12. How do I determine which pricing option suits my needs best?
The pricing options vary based on user requirements and access needs. Individual users may opt for single-user licenses, while businesses requiring broader access may choose multi-user or enterprise licenses for cost-effective access to the report.
13. Are there any additional resources or data provided in the Challenger Banks In North America report?
While the report offers comprehensive insights, it's advisable to review the specific contents or supplementary materials provided to ascertain if additional resources or data are available.
14. How can I stay updated on further developments or reports in the Challenger Banks In North America?
To stay informed about further developments, trends, and reports in the Challenger Banks In North America, consider subscribing to industry newsletters, following relevant companies and organizations, or regularly checking reputable industry news sources and publications.
Methodology
Step 1 - Identification of Relevant Samples Size from Population Database


Step 2 - Approaches for Defining Global Market Size (Value, Volume* & Price*)

Note*: In applicable scenarios
Step 3 - Data Sources
Primary Research
- Web Analytics
- Survey Reports
- Research Institute
- Latest Research Reports
- Opinion Leaders
Secondary Research
- Annual Reports
- White Paper
- Latest Press Release
- Industry Association
- Paid Database
- Investor Presentations

Step 4 - Data Triangulation
Involves using different sources of information in order to increase the validity of a study
These sources are likely to be stakeholders in a program - participants, other researchers, program staff, other community members, and so on.
Then we put all data in single framework & apply various statistical tools to find out the dynamic on the market.
During the analysis stage, feedback from the stakeholder groups would be compared to determine areas of agreement as well as areas of divergence