

Key Insights
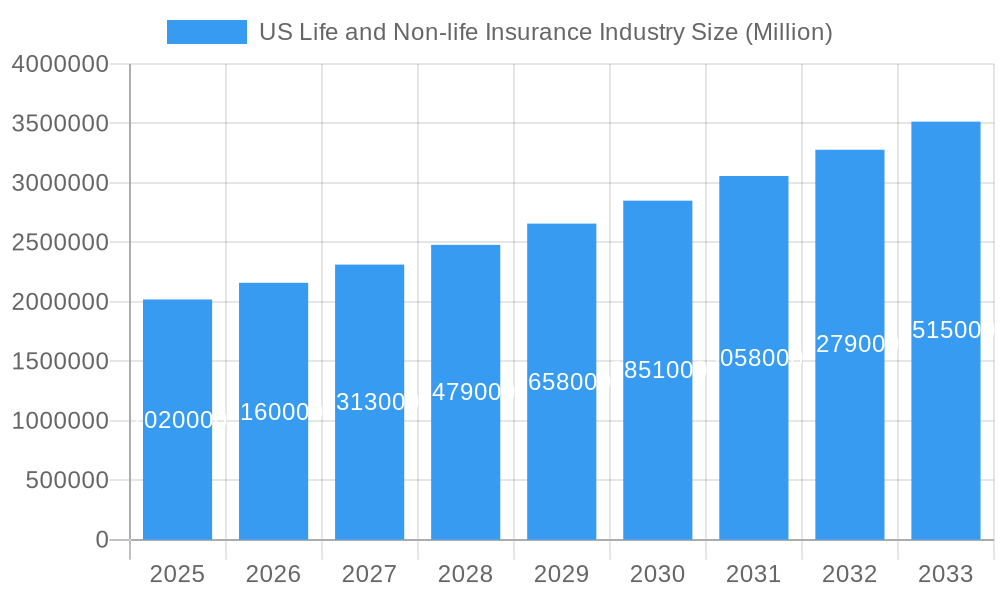
The US life and non-life insurance industry, currently valued at approximately $2.02 trillion (2025 estimated), exhibits robust growth potential, projected to expand at a Compound Annual Growth Rate (CAGR) of 6.95% from 2025 to 2033. This growth is driven by several key factors. An aging population necessitates increased demand for life insurance products, particularly long-term care and annuities. Simultaneously, rising awareness of financial security and the growing prevalence of chronic diseases fuel demand for health insurance coverage. Furthermore, increasing adoption of digital platforms and Insurtech solutions are streamlining processes, expanding accessibility, and enhancing customer experience. However, challenges remain. Stringent regulatory environments and increasing competition from both established players and innovative Insurtech startups put pressure on profit margins. Economic fluctuations can also significantly impact consumer demand, particularly for non-life insurance products. The industry is segmented based on product type (life, health, property & casualty, etc.), distribution channels (direct, agents, brokers), and customer demographics. Leading players like Massachusetts Mutual Life Insurance Company, UnitedHealth Group, Berkshire Hathaway, and others are constantly innovating and consolidating to maintain their market share within this dynamic landscape.
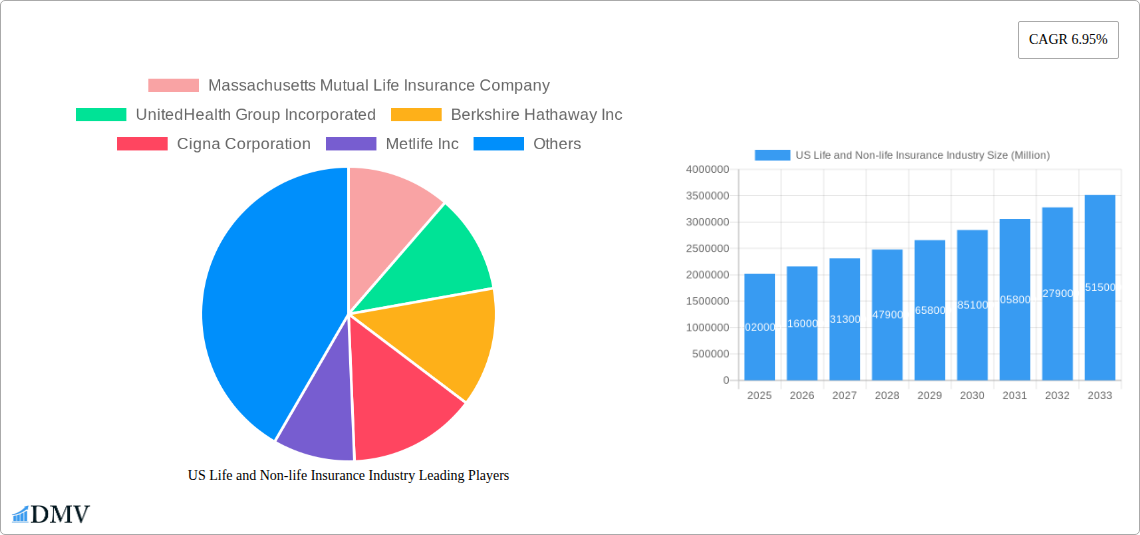
US Life and Non-life Insurance Industry Market Size (In Million)
The industry's future growth trajectory hinges on effective adaptation to changing consumer preferences and technological advancements. Companies successfully leveraging data analytics, personalized products, and seamless digital experiences are likely to thrive. Regulatory changes and macroeconomic factors will continue to shape the competitive dynamics, necessitating strategic flexibility and a focus on operational efficiency. A proactive approach to managing risk, embracing innovation, and building strong customer relationships will be critical for sustained success in the coming decade. The forecast period of 2025-2033 promises significant expansion, with the market likely exceeding $3.5 trillion by 2033, considering the projected CAGR and industry trends. This growth will be unevenly distributed across segments, with health insurance and specific niche life insurance products anticipated to experience particularly strong demand.
US Life and Non-life Insurance Industry Company Market Share
US Life and Non-life Insurance Industry: Market Analysis & Forecast (2019-2033)
This comprehensive report provides a detailed analysis of the US life and non-life insurance industry, encompassing market trends, competitive dynamics, and future growth prospects from 2019 to 2033. The report leverages extensive data analysis, covering historical performance (2019-2024), the base year (2025), and a robust forecast period (2025-2033). Key players like Massachusetts Mutual Life Insurance Company, UnitedHealth Group Incorporated, Berkshire Hathaway Inc, Cigna Corporation, Metlife Inc, Prudential Financial Inc, Aetna Inc, Centene Corporation, American International Group Inc, and State Farm (list not exhaustive) are profiled, providing invaluable insights for stakeholders.
US Life and Non-life Insurance Industry Market Composition & Trends
This section delves into the intricate structure of the US life and non-life insurance market. We analyze market concentration, revealing the market share distribution among key players, and explore the impact of mergers and acquisitions (M&A) activities, including deal values (estimated at xx Million USD in the historical period). Innovation catalysts are examined, highlighting technological advancements and their impact on product offerings. The regulatory landscape is thoroughly dissected, evaluating its influence on industry practices and future trajectories. Furthermore, we profile end-user segments and analyze the presence of substitute products and their competitive threat.
- Market Concentration: The market exhibits a moderately concentrated structure, with the top five players holding an estimated xx% market share in 2024.
- M&A Activity: The historical period (2019-2024) witnessed xx M&A deals, with a total estimated value of xx Million USD, primarily driven by consolidation efforts and expansion strategies.
- Innovation Catalysts: Advancements in AI, big data analytics, and digital distribution channels are reshaping the industry, fostering greater efficiency and personalized customer experiences.
- Regulatory Landscape: Evolving regulations regarding data privacy, solvency, and consumer protection present both challenges and opportunities for insurers.
US Life and Non-life Insurance Industry Industry Evolution
This section provides a detailed overview of the industry's evolution from 2019 to 2033. We analyze market growth trajectories, revealing a Compound Annual Growth Rate (CAGR) of xx% during the historical period and projecting a CAGR of xx% during the forecast period. This growth is fueled by factors such as increasing health awareness, rising disposable incomes, and the aging population. Technological advancements, including telematics and AI-powered risk assessment, are transforming operations and improving customer engagement. Shifting consumer demands toward personalized products and seamless digital experiences are reshaping the industry landscape. Specific data points on growth rates and the adoption of new technologies will be provided.
Leading Regions, Countries, or Segments in US Life and Non-life Insurance Industry
The report identifies the dominant regions and segments within the US life and non-life insurance market. In-depth analysis highlights the factors driving their leadership. Key drivers include investment trends, regulatory support, and demographic characteristics.
- Key Drivers of Dominance:
- California: Large population, high disposable income, and robust regulatory framework.
- Health Insurance Segment: Growing demand due to increasing healthcare costs and an aging population.
- Life Insurance Segment: Increased awareness of financial planning and estate management.
The analysis will delve deeper into the factors contributing to the dominance of each identified region and segment, providing a nuanced understanding of market dynamics.
US Life and Non-life Insurance Industry Product Innovations
The US life and non-life insurance industry is witnessing a surge in product innovation, driven by technological advancements and evolving consumer needs. Insurers are increasingly integrating digital technologies into their offerings, providing customers with personalized products, seamless online experiences, and greater transparency. This includes the utilization of AI-powered risk assessment tools, telematics for auto insurance, and mobile apps for policy management. These innovations translate to enhanced customer experience, improved operational efficiency, and potentially, better risk management for insurers.
Propelling Factors for US Life and Non-life Insurance Industry Growth
Several key factors are driving the growth of the US life and non-life insurance industry. Technological advancements such as AI and big data are improving efficiency, enabling personalized products, and enhancing customer experience. Economic factors, including rising disposable incomes and an aging population, fuel demand for insurance products. Favorable regulatory environments and government initiatives aimed at increasing insurance penetration also contribute to the sector's expansion. For example, incentives for health insurance coverage and regulations promoting financial literacy play a significant role.
Obstacles in the US Life and Non-life Insurance Industry Market
Despite positive growth projections, the US life and non-life insurance industry faces several challenges. Stringent regulatory compliance requirements can increase operational costs and limit flexibility. Supply chain disruptions, particularly in the aftermath of global events, can impact operations and profitability. Intense competition, both domestically and from international players, necessitates continuous innovation and strategic adaptation to maintain market share. These challenges necessitate proactive strategies to mitigate risk and ensure long-term sustainability.
Future Opportunities in US Life and Non-life Insurance Industry
Emerging opportunities abound for the US life and non-life insurance industry. The expansion of digital distribution channels presents opportunities for reaching new customer segments. The adoption of Insurtech solutions can lead to improved efficiency, enhanced customer experience, and the creation of innovative products. The growing demand for personalized insurance products, particularly in the health insurance segment, will continue to fuel growth. Furthermore, exploring new markets and product categories offers significant potential for expansion.
Major Players in the US Life and Non-life Insurance Industry Ecosystem
Key Developments in US Life and Non-life Insurance Industry Industry
- 2021 (July): Cigna introduced its Cigna ID card, providing clients with anytime, anywhere access to in-network doctors, care, and cost estimates. This enhanced customer experience and improved accessibility.
- 2022 (Year): UnitedHealth Group invested USD 100 Million in health worker diversity, advancing health equity and increasing access to affordable, high-quality care. This initiative showcases a commitment to social responsibility and improved health outcomes.
Strategic US Life and Non-life Insurance Industry Market Forecast
The US life and non-life insurance market is poised for continued growth, driven by technological advancements, demographic shifts, and evolving consumer needs. Opportunities lie in leveraging data analytics for personalized product offerings, expanding into underserved markets, and embracing innovative distribution channels. The industry's future success hinges on adapting to evolving regulatory landscapes, managing risk effectively, and prioritizing customer experience. The forecast period (2025-2033) anticipates significant growth, with a projected market value exceeding xx Million USD by 2033.
US Life and Non-life Insurance Industry Segmentation
-
1. Insurance type
-
1.1. Life Insurance
- 1.1.1. Individual
- 1.1.2. Group
-
1.2. Non-life Insurance
- 1.2.1. Home
- 1.2.2. Motor
- 1.2.3. Other Non-life Insurances
-
1.1. Life Insurance
-
2. Distribution Channel
- 2.1. Direct
- 2.2. Agency
- 2.3. Banks
- 2.4. Other Distribution Channels
US Life and Non-life Insurance Industry Segmentation By Geography
-
1. North America
- 1.1. United States
- 1.2. Canada
- 1.3. Mexico
-
2. South America
- 2.1. Brazil
- 2.2. Argentina
- 2.3. Rest of South America
-
3. Europe
- 3.1. United Kingdom
- 3.2. Germany
- 3.3. France
- 3.4. Italy
- 3.5. Spain
- 3.6. Russia
- 3.7. Benelux
- 3.8. Nordics
- 3.9. Rest of Europe
-
4. Middle East & Africa
- 4.1. Turkey
- 4.2. Israel
- 4.3. GCC
- 4.4. North Africa
- 4.5. South Africa
- 4.6. Rest of Middle East & Africa
-
5. Asia Pacific
- 5.1. China
- 5.2. India
- 5.3. Japan
- 5.4. South Korea
- 5.5. ASEAN
- 5.6. Oceania
- 5.7. Rest of Asia Pacific
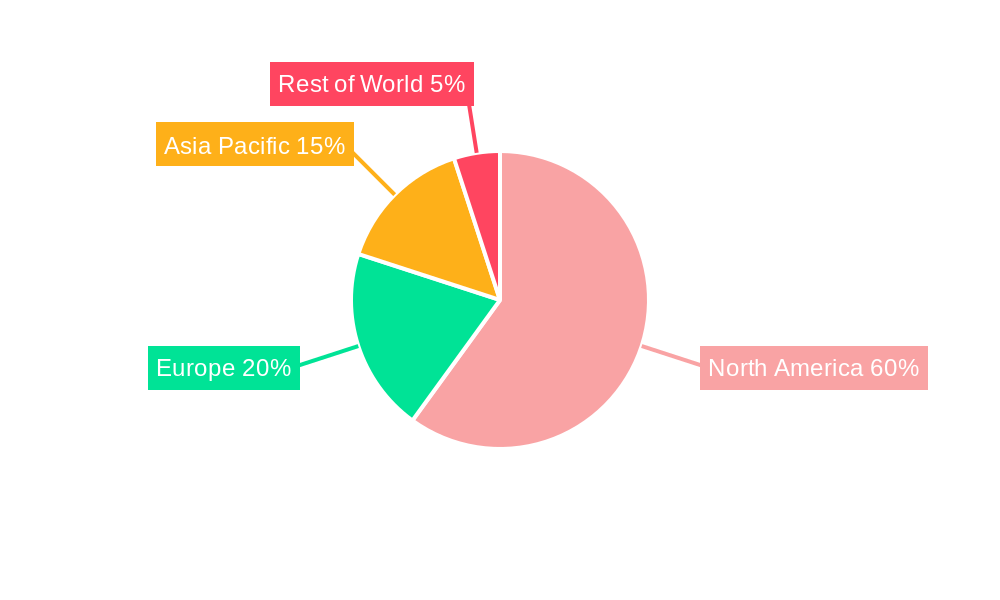
US Life and Non-life Insurance Industry Regional Market Share
Geographic Coverage of US Life and Non-life Insurance Industry
US Life and Non-life Insurance Industry REPORT HIGHLIGHTS
| Aspects | Details |
|---|---|
| Study Period | 2020-2034 |
| Base Year | 2025 |
| Estimated Year | 2026 |
| Forecast Period | 2026-2034 |
| Historical Period | 2020-2025 |
| Growth Rate | CAGR of 6.95% from 2020-2034 |
| Segmentation |
|
Table of Contents
- 1. Introduction
- 1.1. Research Scope
- 1.2. Market Segmentation
- 1.3. Research Methodology
- 1.4. Definitions and Assumptions
- 2. Executive Summary
- 2.1. Introduction
- 3. Market Dynamics
- 3.1. Introduction
- 3.2. Market Drivers
- 3.3. Market Restrains
- 3.4. Market Trends
- 3.4.1. Growing Insurtech in the United States is Driving the Market
- 4. Market Factor Analysis
- 4.1. Porters Five Forces
- 4.2. Supply/Value Chain
- 4.3. PESTEL analysis
- 4.4. Market Entropy
- 4.5. Patent/Trademark Analysis
- 5. Global US Life and Non-life Insurance Industry Analysis, Insights and Forecast, 2020-2032
- 5.1. Market Analysis, Insights and Forecast - by Insurance type
- 5.1.1. Life Insurance
- 5.1.1.1. Individual
- 5.1.1.2. Group
- 5.1.2. Non-life Insurance
- 5.1.2.1. Home
- 5.1.2.2. Motor
- 5.1.2.3. Other Non-life Insurances
- 5.1.1. Life Insurance
- 5.2. Market Analysis, Insights and Forecast - by Distribution Channel
- 5.2.1. Direct
- 5.2.2. Agency
- 5.2.3. Banks
- 5.2.4. Other Distribution Channels
- 5.3. Market Analysis, Insights and Forecast - by Region
- 5.3.1. North America
- 5.3.2. South America
- 5.3.3. Europe
- 5.3.4. Middle East & Africa
- 5.3.5. Asia Pacific
- 5.1. Market Analysis, Insights and Forecast - by Insurance type
- 6. North America US Life and Non-life Insurance Industry Analysis, Insights and Forecast, 2020-2032
- 6.1. Market Analysis, Insights and Forecast - by Insurance type
- 6.1.1. Life Insurance
- 6.1.1.1. Individual
- 6.1.1.2. Group
- 6.1.2. Non-life Insurance
- 6.1.2.1. Home
- 6.1.2.2. Motor
- 6.1.2.3. Other Non-life Insurances
- 6.1.1. Life Insurance
- 6.2. Market Analysis, Insights and Forecast - by Distribution Channel
- 6.2.1. Direct
- 6.2.2. Agency
- 6.2.3. Banks
- 6.2.4. Other Distribution Channels
- 6.1. Market Analysis, Insights and Forecast - by Insurance type
- 7. South America US Life and Non-life Insurance Industry Analysis, Insights and Forecast, 2020-2032
- 7.1. Market Analysis, Insights and Forecast - by Insurance type
- 7.1.1. Life Insurance
- 7.1.1.1. Individual
- 7.1.1.2. Group
- 7.1.2. Non-life Insurance
- 7.1.2.1. Home
- 7.1.2.2. Motor
- 7.1.2.3. Other Non-life Insurances
- 7.1.1. Life Insurance
- 7.2. Market Analysis, Insights and Forecast - by Distribution Channel
- 7.2.1. Direct
- 7.2.2. Agency
- 7.2.3. Banks
- 7.2.4. Other Distribution Channels
- 7.1. Market Analysis, Insights and Forecast - by Insurance type
- 8. Europe US Life and Non-life Insurance Industry Analysis, Insights and Forecast, 2020-2032
- 8.1. Market Analysis, Insights and Forecast - by Insurance type
- 8.1.1. Life Insurance
- 8.1.1.1. Individual
- 8.1.1.2. Group
- 8.1.2. Non-life Insurance
- 8.1.2.1. Home
- 8.1.2.2. Motor
- 8.1.2.3. Other Non-life Insurances
- 8.1.1. Life Insurance
- 8.2. Market Analysis, Insights and Forecast - by Distribution Channel
- 8.2.1. Direct
- 8.2.2. Agency
- 8.2.3. Banks
- 8.2.4. Other Distribution Channels
- 8.1. Market Analysis, Insights and Forecast - by Insurance type
- 9. Middle East & Africa US Life and Non-life Insurance Industry Analysis, Insights and Forecast, 2020-2032
- 9.1. Market Analysis, Insights and Forecast - by Insurance type
- 9.1.1. Life Insurance
- 9.1.1.1. Individual
- 9.1.1.2. Group
- 9.1.2. Non-life Insurance
- 9.1.2.1. Home
- 9.1.2.2. Motor
- 9.1.2.3. Other Non-life Insurances
- 9.1.1. Life Insurance
- 9.2. Market Analysis, Insights and Forecast - by Distribution Channel
- 9.2.1. Direct
- 9.2.2. Agency
- 9.2.3. Banks
- 9.2.4. Other Distribution Channels
- 9.1. Market Analysis, Insights and Forecast - by Insurance type
- 10. Asia Pacific US Life and Non-life Insurance Industry Analysis, Insights and Forecast, 2020-2032
- 10.1. Market Analysis, Insights and Forecast - by Insurance type
- 10.1.1. Life Insurance
- 10.1.1.1. Individual
- 10.1.1.2. Group
- 10.1.2. Non-life Insurance
- 10.1.2.1. Home
- 10.1.2.2. Motor
- 10.1.2.3. Other Non-life Insurances
- 10.1.1. Life Insurance
- 10.2. Market Analysis, Insights and Forecast - by Distribution Channel
- 10.2.1. Direct
- 10.2.2. Agency
- 10.2.3. Banks
- 10.2.4. Other Distribution Channels
- 10.1. Market Analysis, Insights and Forecast - by Insurance type
- 11. Competitive Analysis
- 11.1. Global Market Share Analysis 2025
- 11.2. Company Profiles
- 11.2.1 Massachusetts Mutual Life Insurance Company
- 11.2.1.1. Overview
- 11.2.1.2. Products
- 11.2.1.3. SWOT Analysis
- 11.2.1.4. Recent Developments
- 11.2.1.5. Financials (Based on Availability)
- 11.2.2 UnitedHealth Group Incorporated
- 11.2.2.1. Overview
- 11.2.2.2. Products
- 11.2.2.3. SWOT Analysis
- 11.2.2.4. Recent Developments
- 11.2.2.5. Financials (Based on Availability)
- 11.2.3 Berkshire Hathaway Inc
- 11.2.3.1. Overview
- 11.2.3.2. Products
- 11.2.3.3. SWOT Analysis
- 11.2.3.4. Recent Developments
- 11.2.3.5. Financials (Based on Availability)
- 11.2.4 Cigna Corporation
- 11.2.4.1. Overview
- 11.2.4.2. Products
- 11.2.4.3. SWOT Analysis
- 11.2.4.4. Recent Developments
- 11.2.4.5. Financials (Based on Availability)
- 11.2.5 Metlife Inc
- 11.2.5.1. Overview
- 11.2.5.2. Products
- 11.2.5.3. SWOT Analysis
- 11.2.5.4. Recent Developments
- 11.2.5.5. Financials (Based on Availability)
- 11.2.6 Prudential Financial Inc
- 11.2.6.1. Overview
- 11.2.6.2. Products
- 11.2.6.3. SWOT Analysis
- 11.2.6.4. Recent Developments
- 11.2.6.5. Financials (Based on Availability)
- 11.2.7 Aetna Inc
- 11.2.7.1. Overview
- 11.2.7.2. Products
- 11.2.7.3. SWOT Analysis
- 11.2.7.4. Recent Developments
- 11.2.7.5. Financials (Based on Availability)
- 11.2.8 Centene Corporation
- 11.2.8.1. Overview
- 11.2.8.2. Products
- 11.2.8.3. SWOT Analysis
- 11.2.8.4. Recent Developments
- 11.2.8.5. Financials (Based on Availability)
- 11.2.9 American International Group Inc
- 11.2.9.1. Overview
- 11.2.9.2. Products
- 11.2.9.3. SWOT Analysis
- 11.2.9.4. Recent Developments
- 11.2.9.5. Financials (Based on Availability)
- 11.2.10 State Farm**List Not Exhaustive
- 11.2.10.1. Overview
- 11.2.10.2. Products
- 11.2.10.3. SWOT Analysis
- 11.2.10.4. Recent Developments
- 11.2.10.5. Financials (Based on Availability)
- 11.2.1 Massachusetts Mutual Life Insurance Company
List of Figures
- Figure 1: Global US Life and Non-life Insurance Industry Revenue Breakdown (Million, %) by Region 2025 & 2033
- Figure 2: Global US Life and Non-life Insurance Industry Volume Breakdown (Trillion, %) by Region 2025 & 2033
- Figure 3: North America US Life and Non-life Insurance Industry Revenue (Million), by Insurance type 2025 & 2033
- Figure 4: North America US Life and Non-life Insurance Industry Volume (Trillion), by Insurance type 2025 & 2033
- Figure 5: North America US Life and Non-life Insurance Industry Revenue Share (%), by Insurance type 2025 & 2033
- Figure 6: North America US Life and Non-life Insurance Industry Volume Share (%), by Insurance type 2025 & 2033
- Figure 7: North America US Life and Non-life Insurance Industry Revenue (Million), by Distribution Channel 2025 & 2033
- Figure 8: North America US Life and Non-life Insurance Industry Volume (Trillion), by Distribution Channel 2025 & 2033
- Figure 9: North America US Life and Non-life Insurance Industry Revenue Share (%), by Distribution Channel 2025 & 2033
- Figure 10: North America US Life and Non-life Insurance Industry Volume Share (%), by Distribution Channel 2025 & 2033
- Figure 11: North America US Life and Non-life Insurance Industry Revenue (Million), by Country 2025 & 2033
- Figure 12: North America US Life and Non-life Insurance Industry Volume (Trillion), by Country 2025 & 2033
- Figure 13: North America US Life and Non-life Insurance Industry Revenue Share (%), by Country 2025 & 2033
- Figure 14: North America US Life and Non-life Insurance Industry Volume Share (%), by Country 2025 & 2033
- Figure 15: South America US Life and Non-life Insurance Industry Revenue (Million), by Insurance type 2025 & 2033
- Figure 16: South America US Life and Non-life Insurance Industry Volume (Trillion), by Insurance type 2025 & 2033
- Figure 17: South America US Life and Non-life Insurance Industry Revenue Share (%), by Insurance type 2025 & 2033
- Figure 18: South America US Life and Non-life Insurance Industry Volume Share (%), by Insurance type 2025 & 2033
- Figure 19: South America US Life and Non-life Insurance Industry Revenue (Million), by Distribution Channel 2025 & 2033
- Figure 20: South America US Life and Non-life Insurance Industry Volume (Trillion), by Distribution Channel 2025 & 2033
- Figure 21: South America US Life and Non-life Insurance Industry Revenue Share (%), by Distribution Channel 2025 & 2033
- Figure 22: South America US Life and Non-life Insurance Industry Volume Share (%), by Distribution Channel 2025 & 2033
- Figure 23: South America US Life and Non-life Insurance Industry Revenue (Million), by Country 2025 & 2033
- Figure 24: South America US Life and Non-life Insurance Industry Volume (Trillion), by Country 2025 & 2033
- Figure 25: South America US Life and Non-life Insurance Industry Revenue Share (%), by Country 2025 & 2033
- Figure 26: South America US Life and Non-life Insurance Industry Volume Share (%), by Country 2025 & 2033
- Figure 27: Europe US Life and Non-life Insurance Industry Revenue (Million), by Insurance type 2025 & 2033
- Figure 28: Europe US Life and Non-life Insurance Industry Volume (Trillion), by Insurance type 2025 & 2033
- Figure 29: Europe US Life and Non-life Insurance Industry Revenue Share (%), by Insurance type 2025 & 2033
- Figure 30: Europe US Life and Non-life Insurance Industry Volume Share (%), by Insurance type 2025 & 2033
- Figure 31: Europe US Life and Non-life Insurance Industry Revenue (Million), by Distribution Channel 2025 & 2033
- Figure 32: Europe US Life and Non-life Insurance Industry Volume (Trillion), by Distribution Channel 2025 & 2033
- Figure 33: Europe US Life and Non-life Insurance Industry Revenue Share (%), by Distribution Channel 2025 & 2033
- Figure 34: Europe US Life and Non-life Insurance Industry Volume Share (%), by Distribution Channel 2025 & 2033
- Figure 35: Europe US Life and Non-life Insurance Industry Revenue (Million), by Country 2025 & 2033
- Figure 36: Europe US Life and Non-life Insurance Industry Volume (Trillion), by Country 2025 & 2033
- Figure 37: Europe US Life and Non-life Insurance Industry Revenue Share (%), by Country 2025 & 2033
- Figure 38: Europe US Life and Non-life Insurance Industry Volume Share (%), by Country 2025 & 2033
- Figure 39: Middle East & Africa US Life and Non-life Insurance Industry Revenue (Million), by Insurance type 2025 & 2033
- Figure 40: Middle East & Africa US Life and Non-life Insurance Industry Volume (Trillion), by Insurance type 2025 & 2033
- Figure 41: Middle East & Africa US Life and Non-life Insurance Industry Revenue Share (%), by Insurance type 2025 & 2033
- Figure 42: Middle East & Africa US Life and Non-life Insurance Industry Volume Share (%), by Insurance type 2025 & 2033
- Figure 43: Middle East & Africa US Life and Non-life Insurance Industry Revenue (Million), by Distribution Channel 2025 & 2033
- Figure 44: Middle East & Africa US Life and Non-life Insurance Industry Volume (Trillion), by Distribution Channel 2025 & 2033
- Figure 45: Middle East & Africa US Life and Non-life Insurance Industry Revenue Share (%), by Distribution Channel 2025 & 2033
- Figure 46: Middle East & Africa US Life and Non-life Insurance Industry Volume Share (%), by Distribution Channel 2025 & 2033
- Figure 47: Middle East & Africa US Life and Non-life Insurance Industry Revenue (Million), by Country 2025 & 2033
- Figure 48: Middle East & Africa US Life and Non-life Insurance Industry Volume (Trillion), by Country 2025 & 2033
- Figure 49: Middle East & Africa US Life and Non-life Insurance Industry Revenue Share (%), by Country 2025 & 2033
- Figure 50: Middle East & Africa US Life and Non-life Insurance Industry Volume Share (%), by Country 2025 & 2033
- Figure 51: Asia Pacific US Life and Non-life Insurance Industry Revenue (Million), by Insurance type 2025 & 2033
- Figure 52: Asia Pacific US Life and Non-life Insurance Industry Volume (Trillion), by Insurance type 2025 & 2033
- Figure 53: Asia Pacific US Life and Non-life Insurance Industry Revenue Share (%), by Insurance type 2025 & 2033
- Figure 54: Asia Pacific US Life and Non-life Insurance Industry Volume Share (%), by Insurance type 2025 & 2033
- Figure 55: Asia Pacific US Life and Non-life Insurance Industry Revenue (Million), by Distribution Channel 2025 & 2033
- Figure 56: Asia Pacific US Life and Non-life Insurance Industry Volume (Trillion), by Distribution Channel 2025 & 2033
- Figure 57: Asia Pacific US Life and Non-life Insurance Industry Revenue Share (%), by Distribution Channel 2025 & 2033
- Figure 58: Asia Pacific US Life and Non-life Insurance Industry Volume Share (%), by Distribution Channel 2025 & 2033
- Figure 59: Asia Pacific US Life and Non-life Insurance Industry Revenue (Million), by Country 2025 & 2033
- Figure 60: Asia Pacific US Life and Non-life Insurance Industry Volume (Trillion), by Country 2025 & 2033
- Figure 61: Asia Pacific US Life and Non-life Insurance Industry Revenue Share (%), by Country 2025 & 2033
- Figure 62: Asia Pacific US Life and Non-life Insurance Industry Volume Share (%), by Country 2025 & 2033
List of Tables
- Table 1: Global US Life and Non-life Insurance Industry Revenue Million Forecast, by Insurance type 2020 & 2033
- Table 2: Global US Life and Non-life Insurance Industry Volume Trillion Forecast, by Insurance type 2020 & 2033
- Table 3: Global US Life and Non-life Insurance Industry Revenue Million Forecast, by Distribution Channel 2020 & 2033
- Table 4: Global US Life and Non-life Insurance Industry Volume Trillion Forecast, by Distribution Channel 2020 & 2033
- Table 5: Global US Life and Non-life Insurance Industry Revenue Million Forecast, by Region 2020 & 2033
- Table 6: Global US Life and Non-life Insurance Industry Volume Trillion Forecast, by Region 2020 & 2033
- Table 7: Global US Life and Non-life Insurance Industry Revenue Million Forecast, by Insurance type 2020 & 2033
- Table 8: Global US Life and Non-life Insurance Industry Volume Trillion Forecast, by Insurance type 2020 & 2033
- Table 9: Global US Life and Non-life Insurance Industry Revenue Million Forecast, by Distribution Channel 2020 & 2033
- Table 10: Global US Life and Non-life Insurance Industry Volume Trillion Forecast, by Distribution Channel 2020 & 2033
- Table 11: Global US Life and Non-life Insurance Industry Revenue Million Forecast, by Country 2020 & 2033
- Table 12: Global US Life and Non-life Insurance Industry Volume Trillion Forecast, by Country 2020 & 2033
- Table 13: United States US Life and Non-life Insurance Industry Revenue (Million) Forecast, by Application 2020 & 2033
- Table 14: United States US Life and Non-life Insurance Industry Volume (Trillion) Forecast, by Application 2020 & 2033
- Table 15: Canada US Life and Non-life Insurance Industry Revenue (Million) Forecast, by Application 2020 & 2033
- Table 16: Canada US Life and Non-life Insurance Industry Volume (Trillion) Forecast, by Application 2020 & 2033
- Table 17: Mexico US Life and Non-life Insurance Industry Revenue (Million) Forecast, by Application 2020 & 2033
- Table 18: Mexico US Life and Non-life Insurance Industry Volume (Trillion) Forecast, by Application 2020 & 2033
- Table 19: Global US Life and Non-life Insurance Industry Revenue Million Forecast, by Insurance type 2020 & 2033
- Table 20: Global US Life and Non-life Insurance Industry Volume Trillion Forecast, by Insurance type 2020 & 2033
- Table 21: Global US Life and Non-life Insurance Industry Revenue Million Forecast, by Distribution Channel 2020 & 2033
- Table 22: Global US Life and Non-life Insurance Industry Volume Trillion Forecast, by Distribution Channel 2020 & 2033
- Table 23: Global US Life and Non-life Insurance Industry Revenue Million Forecast, by Country 2020 & 2033
- Table 24: Global US Life and Non-life Insurance Industry Volume Trillion Forecast, by Country 2020 & 2033
- Table 25: Brazil US Life and Non-life Insurance Industry Revenue (Million) Forecast, by Application 2020 & 2033
- Table 26: Brazil US Life and Non-life Insurance Industry Volume (Trillion) Forecast, by Application 2020 & 2033
- Table 27: Argentina US Life and Non-life Insurance Industry Revenue (Million) Forecast, by Application 2020 & 2033
- Table 28: Argentina US Life and Non-life Insurance Industry Volume (Trillion) Forecast, by Application 2020 & 2033
- Table 29: Rest of South America US Life and Non-life Insurance Industry Revenue (Million) Forecast, by Application 2020 & 2033
- Table 30: Rest of South America US Life and Non-life Insurance Industry Volume (Trillion) Forecast, by Application 2020 & 2033
- Table 31: Global US Life and Non-life Insurance Industry Revenue Million Forecast, by Insurance type 2020 & 2033
- Table 32: Global US Life and Non-life Insurance Industry Volume Trillion Forecast, by Insurance type 2020 & 2033
- Table 33: Global US Life and Non-life Insurance Industry Revenue Million Forecast, by Distribution Channel 2020 & 2033
- Table 34: Global US Life and Non-life Insurance Industry Volume Trillion Forecast, by Distribution Channel 2020 & 2033
- Table 35: Global US Life and Non-life Insurance Industry Revenue Million Forecast, by Country 2020 & 2033
- Table 36: Global US Life and Non-life Insurance Industry Volume Trillion Forecast, by Country 2020 & 2033
- Table 37: United Kingdom US Life and Non-life Insurance Industry Revenue (Million) Forecast, by Application 2020 & 2033
- Table 38: United Kingdom US Life and Non-life Insurance Industry Volume (Trillion) Forecast, by Application 2020 & 2033
- Table 39: Germany US Life and Non-life Insurance Industry Revenue (Million) Forecast, by Application 2020 & 2033
- Table 40: Germany US Life and Non-life Insurance Industry Volume (Trillion) Forecast, by Application 2020 & 2033
- Table 41: France US Life and Non-life Insurance Industry Revenue (Million) Forecast, by Application 2020 & 2033
- Table 42: France US Life and Non-life Insurance Industry Volume (Trillion) Forecast, by Application 2020 & 2033
- Table 43: Italy US Life and Non-life Insurance Industry Revenue (Million) Forecast, by Application 2020 & 2033
- Table 44: Italy US Life and Non-life Insurance Industry Volume (Trillion) Forecast, by Application 2020 & 2033
- Table 45: Spain US Life and Non-life Insurance Industry Revenue (Million) Forecast, by Application 2020 & 2033
- Table 46: Spain US Life and Non-life Insurance Industry Volume (Trillion) Forecast, by Application 2020 & 2033
- Table 47: Russia US Life and Non-life Insurance Industry Revenue (Million) Forecast, by Application 2020 & 2033
- Table 48: Russia US Life and Non-life Insurance Industry Volume (Trillion) Forecast, by Application 2020 & 2033
- Table 49: Benelux US Life and Non-life Insurance Industry Revenue (Million) Forecast, by Application 2020 & 2033
- Table 50: Benelux US Life and Non-life Insurance Industry Volume (Trillion) Forecast, by Application 2020 & 2033
- Table 51: Nordics US Life and Non-life Insurance Industry Revenue (Million) Forecast, by Application 2020 & 2033
- Table 52: Nordics US Life and Non-life Insurance Industry Volume (Trillion) Forecast, by Application 2020 & 2033
- Table 53: Rest of Europe US Life and Non-life Insurance Industry Revenue (Million) Forecast, by Application 2020 & 2033
- Table 54: Rest of Europe US Life and Non-life Insurance Industry Volume (Trillion) Forecast, by Application 2020 & 2033
- Table 55: Global US Life and Non-life Insurance Industry Revenue Million Forecast, by Insurance type 2020 & 2033
- Table 56: Global US Life and Non-life Insurance Industry Volume Trillion Forecast, by Insurance type 2020 & 2033
- Table 57: Global US Life and Non-life Insurance Industry Revenue Million Forecast, by Distribution Channel 2020 & 2033
- Table 58: Global US Life and Non-life Insurance Industry Volume Trillion Forecast, by Distribution Channel 2020 & 2033
- Table 59: Global US Life and Non-life Insurance Industry Revenue Million Forecast, by Country 2020 & 2033
- Table 60: Global US Life and Non-life Insurance Industry Volume Trillion Forecast, by Country 2020 & 2033
- Table 61: Turkey US Life and Non-life Insurance Industry Revenue (Million) Forecast, by Application 2020 & 2033
- Table 62: Turkey US Life and Non-life Insurance Industry Volume (Trillion) Forecast, by Application 2020 & 2033
- Table 63: Israel US Life and Non-life Insurance Industry Revenue (Million) Forecast, by Application 2020 & 2033
- Table 64: Israel US Life and Non-life Insurance Industry Volume (Trillion) Forecast, by Application 2020 & 2033
- Table 65: GCC US Life and Non-life Insurance Industry Revenue (Million) Forecast, by Application 2020 & 2033
- Table 66: GCC US Life and Non-life Insurance Industry Volume (Trillion) Forecast, by Application 2020 & 2033
- Table 67: North Africa US Life and Non-life Insurance Industry Revenue (Million) Forecast, by Application 2020 & 2033
- Table 68: North Africa US Life and Non-life Insurance Industry Volume (Trillion) Forecast, by Application 2020 & 2033
- Table 69: South Africa US Life and Non-life Insurance Industry Revenue (Million) Forecast, by Application 2020 & 2033
- Table 70: South Africa US Life and Non-life Insurance Industry Volume (Trillion) Forecast, by Application 2020 & 2033
- Table 71: Rest of Middle East & Africa US Life and Non-life Insurance Industry Revenue (Million) Forecast, by Application 2020 & 2033
- Table 72: Rest of Middle East & Africa US Life and Non-life Insurance Industry Volume (Trillion) Forecast, by Application 2020 & 2033
- Table 73: Global US Life and Non-life Insurance Industry Revenue Million Forecast, by Insurance type 2020 & 2033
- Table 74: Global US Life and Non-life Insurance Industry Volume Trillion Forecast, by Insurance type 2020 & 2033
- Table 75: Global US Life and Non-life Insurance Industry Revenue Million Forecast, by Distribution Channel 2020 & 2033
- Table 76: Global US Life and Non-life Insurance Industry Volume Trillion Forecast, by Distribution Channel 2020 & 2033
- Table 77: Global US Life and Non-life Insurance Industry Revenue Million Forecast, by Country 2020 & 2033
- Table 78: Global US Life and Non-life Insurance Industry Volume Trillion Forecast, by Country 2020 & 2033
- Table 79: China US Life and Non-life Insurance Industry Revenue (Million) Forecast, by Application 2020 & 2033
- Table 80: China US Life and Non-life Insurance Industry Volume (Trillion) Forecast, by Application 2020 & 2033
- Table 81: India US Life and Non-life Insurance Industry Revenue (Million) Forecast, by Application 2020 & 2033
- Table 82: India US Life and Non-life Insurance Industry Volume (Trillion) Forecast, by Application 2020 & 2033
- Table 83: Japan US Life and Non-life Insurance Industry Revenue (Million) Forecast, by Application 2020 & 2033
- Table 84: Japan US Life and Non-life Insurance Industry Volume (Trillion) Forecast, by Application 2020 & 2033
- Table 85: South Korea US Life and Non-life Insurance Industry Revenue (Million) Forecast, by Application 2020 & 2033
- Table 86: South Korea US Life and Non-life Insurance Industry Volume (Trillion) Forecast, by Application 2020 & 2033
- Table 87: ASEAN US Life and Non-life Insurance Industry Revenue (Million) Forecast, by Application 2020 & 2033
- Table 88: ASEAN US Life and Non-life Insurance Industry Volume (Trillion) Forecast, by Application 2020 & 2033
- Table 89: Oceania US Life and Non-life Insurance Industry Revenue (Million) Forecast, by Application 2020 & 2033
- Table 90: Oceania US Life and Non-life Insurance Industry Volume (Trillion) Forecast, by Application 2020 & 2033
- Table 91: Rest of Asia Pacific US Life and Non-life Insurance Industry Revenue (Million) Forecast, by Application 2020 & 2033
- Table 92: Rest of Asia Pacific US Life and Non-life Insurance Industry Volume (Trillion) Forecast, by Application 2020 & 2033
Frequently Asked Questions
1. What is the projected Compound Annual Growth Rate (CAGR) of the US Life and Non-life Insurance Industry?
The projected CAGR is approximately 6.95%.
2. Which companies are prominent players in the US Life and Non-life Insurance Industry?
Key companies in the market include Massachusetts Mutual Life Insurance Company, UnitedHealth Group Incorporated, Berkshire Hathaway Inc, Cigna Corporation, Metlife Inc, Prudential Financial Inc, Aetna Inc, Centene Corporation, American International Group Inc, State Farm**List Not Exhaustive.
3. What are the main segments of the US Life and Non-life Insurance Industry?
The market segments include Insurance type, Distribution Channel.
4. Can you provide details about the market size?
The market size is estimated to be USD 2.02 Million as of 2022.
5. What are some drivers contributing to market growth?
N/A
6. What are the notable trends driving market growth?
Growing Insurtech in the United States is Driving the Market.
7. Are there any restraints impacting market growth?
N/A
8. Can you provide examples of recent developments in the market?
In 2022, With a USD100 million investment in health worker diversity, United Health Group advanced health equity and fulfilling its objectives to increase access to care, make it more affordable, and produce better health outcomes.
9. What pricing options are available for accessing the report?
Pricing options include single-user, multi-user, and enterprise licenses priced at USD 3800, USD 4500, and USD 5800 respectively.
10. Is the market size provided in terms of value or volume?
The market size is provided in terms of value, measured in Million and volume, measured in Trillion.
11. Are there any specific market keywords associated with the report?
Yes, the market keyword associated with the report is "US Life and Non-life Insurance Industry," which aids in identifying and referencing the specific market segment covered.
12. How do I determine which pricing option suits my needs best?
The pricing options vary based on user requirements and access needs. Individual users may opt for single-user licenses, while businesses requiring broader access may choose multi-user or enterprise licenses for cost-effective access to the report.
13. Are there any additional resources or data provided in the US Life and Non-life Insurance Industry report?
While the report offers comprehensive insights, it's advisable to review the specific contents or supplementary materials provided to ascertain if additional resources or data are available.
14. How can I stay updated on further developments or reports in the US Life and Non-life Insurance Industry?
To stay informed about further developments, trends, and reports in the US Life and Non-life Insurance Industry, consider subscribing to industry newsletters, following relevant companies and organizations, or regularly checking reputable industry news sources and publications.
Methodology
Step 1 - Identification of Relevant Samples Size from Population Database


Step 2 - Approaches for Defining Global Market Size (Value, Volume* & Price*)

Note*: In applicable scenarios
Step 3 - Data Sources
Primary Research
- Web Analytics
- Survey Reports
- Research Institute
- Latest Research Reports
- Opinion Leaders
Secondary Research
- Annual Reports
- White Paper
- Latest Press Release
- Industry Association
- Paid Database
- Investor Presentations

Step 4 - Data Triangulation
Involves using different sources of information in order to increase the validity of a study
These sources are likely to be stakeholders in a program - participants, other researchers, program staff, other community members, and so on.
Then we put all data in single framework & apply various statistical tools to find out the dynamic on the market.
During the analysis stage, feedback from the stakeholder groups would be compared to determine areas of agreement as well as areas of divergence