

Key Insights
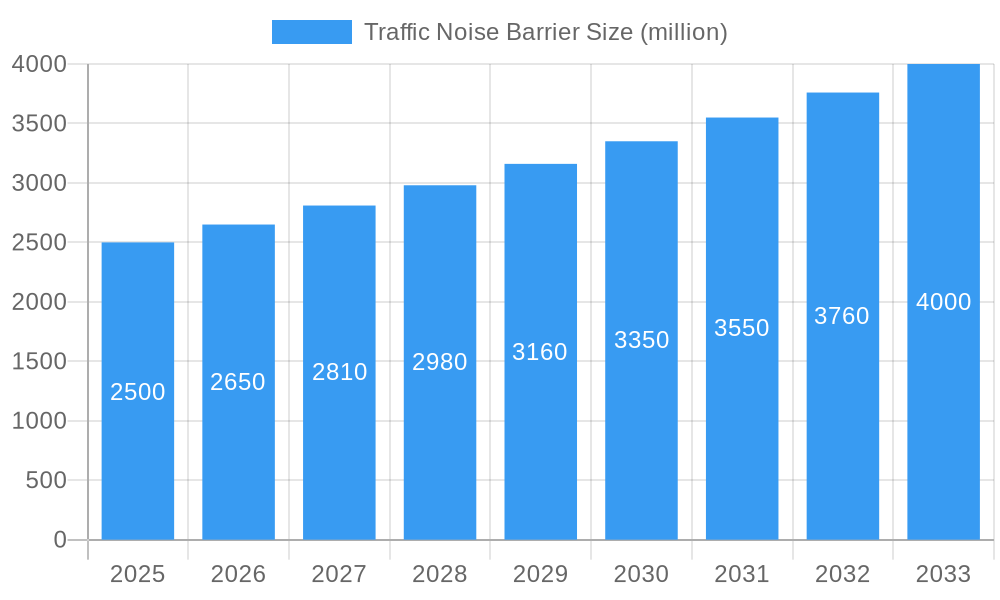
The global traffic noise barrier market is experiencing robust growth, driven by increasing urbanization, expanding transportation networks, and stringent environmental regulations aimed at reducing noise pollution. The market, estimated at $2.5 billion in 2025, is projected to witness a Compound Annual Growth Rate (CAGR) of 6% from 2025 to 2033, reaching approximately $4.2 billion by 2033. This expansion is fueled by several key factors. Firstly, governments worldwide are investing heavily in infrastructure development, including roads and railways, leading to a heightened demand for effective noise mitigation solutions. Secondly, growing public awareness of the detrimental health effects of prolonged noise exposure is driving demand for noise barriers in residential areas near busy transportation routes. Thirdly, advancements in barrier technology, such as the development of lighter, more durable, and aesthetically pleasing materials like melamine foam composite barriers and polyurethane foam composite barriers, are contributing to market growth. The segment of high-speed rail applications is expected to show particularly strong growth due to the high noise levels generated by these trains.
Traffic Noise Barrier Market Size (In Billion)
The market is segmented by application (high-speed rail, highways, bridges, and others) and by type (vinyl barrier, melamine foam composite barrier, polyurethane foam composite barrier, PVC barrier, and others). While vinyl barriers currently hold a significant market share due to their cost-effectiveness, the adoption of more advanced composite materials is expected to increase considerably over the forecast period. Regional growth will be diverse; North America and Europe are expected to retain substantial market shares due to established infrastructure and stringent regulations. However, rapidly developing economies in Asia-Pacific are poised for significant growth due to increasing infrastructure investments and urbanization. Challenges facing market growth include high initial investment costs associated with barrier installation and potential aesthetic concerns regarding the visual impact of barriers in urban landscapes. Nevertheless, the overall market outlook remains positive, driven by the overarching need for noise reduction in increasingly populated and interconnected urban environments.
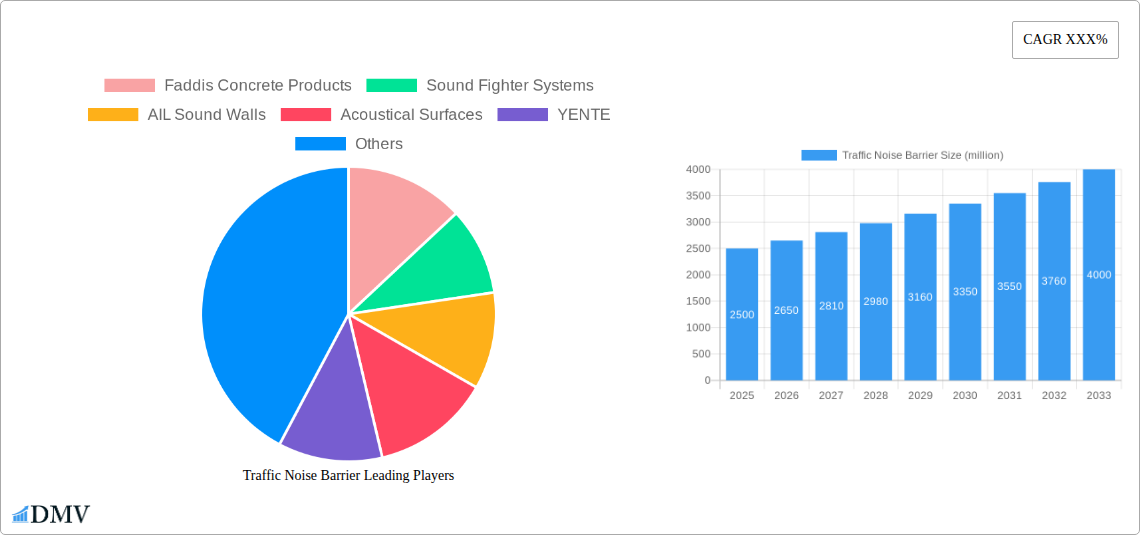
Traffic Noise Barrier Company Market Share
Traffic Noise Barrier Market Report: 2019-2033
This comprehensive report provides a detailed analysis of the global Traffic Noise Barrier market, projecting a market value exceeding $xx million by 2033. The study period covers 2019-2033, with 2025 as the base and estimated year. This in-depth analysis is crucial for stakeholders, investors, and industry professionals seeking to navigate this dynamic market. The report offers a granular view of market segmentation, competitive landscape, and future growth potential, providing actionable insights for strategic decision-making.
Traffic Noise Barrier Market Composition & Trends
This section dissects the current state of the Traffic Noise Barrier market, examining its concentration, innovation drivers, regulatory influences, substitute products, key end-users, and mergers & acquisitions (M&A) activities. The market is characterized by a moderately concentrated landscape, with the top five players holding an estimated xx% market share in 2025. Innovation is fueled by the increasing demand for aesthetically pleasing and environmentally friendly barrier solutions, alongside stringent noise pollution regulations. Key substitute products include landscaping and berms, but their effectiveness is limited compared to purpose-built barriers. End-users predominantly include government agencies, highway departments, and private construction companies.
- Market Share Distribution (2025): Top 5 players: xx%; Remaining players: xx%.
- M&A Activity (2019-2024): xx deals totaling an estimated $xx million in value. Notable transactions include [Insert example if available, otherwise state "no significant publicly reported transactions"].
- Regulatory Landscape: Stringent noise regulations in developed nations are driving market growth. Varied regional standards influence product selection and adoption.
Traffic Noise Barrier Industry Evolution
The Traffic Noise Barrier market has witnessed robust growth over the historical period (2019-2024), exhibiting a CAGR of xx%. This growth trajectory is expected to continue during the forecast period (2025-2033), driven by expanding infrastructure projects globally, increasing urbanization, and heightened environmental awareness. Technological advancements, such as the introduction of lighter, more durable, and aesthetically enhanced barrier materials, are significantly impacting market dynamics. Consumer demand is shifting towards eco-friendly, sustainable solutions, with a notable increase in the adoption of recycled materials and reduced-impact manufacturing processes. Furthermore, smart barrier technologies incorporating noise monitoring and data analytics are emerging, impacting future market growth. The market is projected to grow to $xx million by 2033.
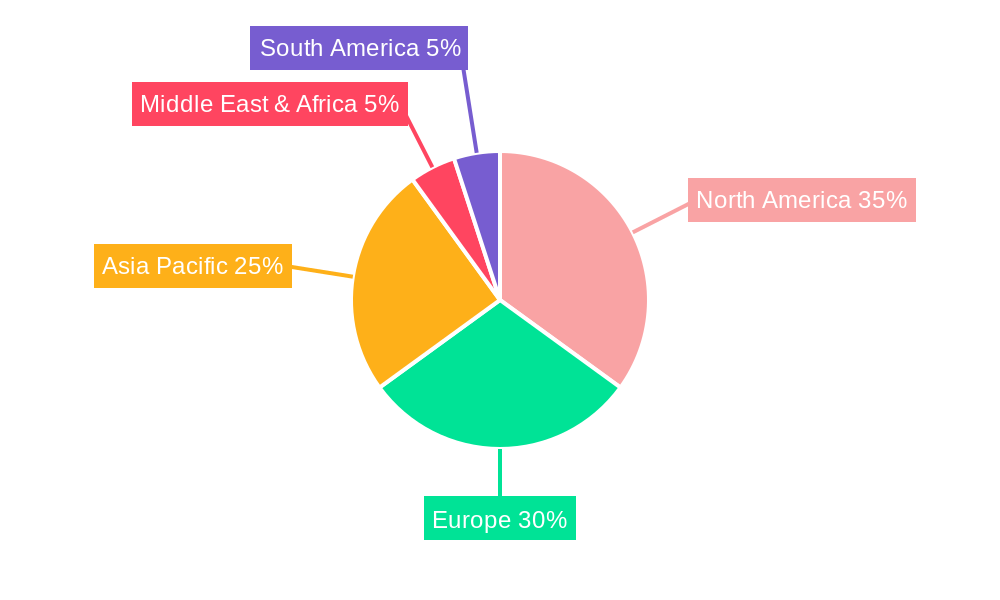
Leading Regions, Countries, or Segments in Traffic Noise Barrier
The North American region holds the largest market share in 2025, driven by extensive highway networks and robust infrastructure development spending. Within applications, the High-Speed Rail segment is experiencing the fastest growth, fueled by significant investments in high-speed rail projects globally. In terms of barrier type, Polyurethane Foam Composite Barriers are witnessing increased adoption due to their superior noise reduction capabilities and longevity.
- Key Drivers for North American Dominance: High government spending on infrastructure, stringent noise pollution regulations, and a well-established construction industry.
- High-Speed Rail Segment Growth Drivers: Significant government investments in high-speed rail infrastructure projects worldwide.
- Polyurethane Foam Composite Barrier Adoption: Superior noise reduction, durability, and longevity compared to other barrier types.
- Other Key Segments: While the Bridge segment displays a steady growth, the 'Other' application and barrier type segments are expected to exhibit significant growth due to emerging infrastructure development, particularly within urban environments.
Traffic Noise Barrier Product Innovations
Recent innovations focus on enhancing aesthetic appeal, improving sound absorption, and integrating smart technologies. New materials such as recycled plastics and composite materials are gaining traction due to their sustainability benefits. Manufacturers are also incorporating features such as integrated lighting, landscaping options, and smart sensors for real-time noise monitoring and data analysis. This results in improved functionality, cost savings and a more sustainable product offering.
Propelling Factors for Traffic Noise Barrier Growth
Several factors contribute to the growth of the Traffic Noise Barrier market. Increased urbanization and expanding highway networks necessitate noise mitigation solutions. Stringent government regulations on noise pollution are mandating the installation of noise barriers in various infrastructure projects. Technological advancements resulting in lighter, stronger, and more aesthetically pleasing barrier materials further drive market expansion. Finally, growing environmental concerns are pushing the demand for eco-friendly barrier solutions, resulting in greater product diversity.
Obstacles in the Traffic Noise Barrier Market
Despite strong growth prospects, the market faces challenges. Fluctuations in raw material prices can impact production costs and profitability. Supply chain disruptions, particularly those related to specialized materials, can lead to project delays. Intense competition among established and emerging players creates pricing pressures. Furthermore, variations in regional regulations and differing approval processes can complicate market entry and expansion.
Future Opportunities in Traffic Noise Barrier
Emerging opportunities lie in the development of innovative materials with enhanced sound absorption properties and sustainable features. Integration of smart technologies for real-time noise monitoring and data analytics presents a significant growth avenue. Expanding into new markets, particularly in developing economies with growing infrastructure investments, offers substantial potential. Finally, addressing the aesthetic concerns associated with traditional barriers creates opportunities for designers to incorporate more visually appealing and integrated solutions.
Major Players in the Traffic Noise Barrier Ecosystem
- Faddis Concrete Products
- Sound Fighter Systems
- AIL Sound Walls
- Acoustical Surfaces
- YENTE
- Hatko
- ERAM Engineering Services
- NOISE srl
- AFTEC, LLC
- IAC Acoustics
- Accurate Perforating
- J & R Slaw, Inc.
- Victory Awning
- South Bend Modern Molding
- Fibergrate Composite Structures
- Hoover Treated Wood Products, Inc.
- Steel Guard Safety Corp.
- Soundown Corp.
Key Developments in Traffic Noise Barrier Industry
- 2022 Q4: Introduction of a new recycled plastic barrier by [Company Name, if available].
- 2023 Q1: Merger between [Company Name] and [Company Name], creating a larger market player. [Insert other relevant developments, including specific companies if possible]
Strategic Traffic Noise Barrier Market Forecast
The Traffic Noise Barrier market is poised for continued robust growth, driven by ongoing infrastructure development, stringent environmental regulations, and technological advancements. The market will likely be shaped by innovation in materials, design, and smart technologies. The increasing focus on sustainable practices will further drive demand for environmentally friendly barrier solutions, leading to significant market expansion throughout the forecast period. The predicted market value of $xx million by 2033 underscores the substantial investment and growth opportunities in this sector.
Traffic Noise Barrier Segmentation
-
1. Application
- 1.1. High Speed
- 1.2. The Way
- 1.3. Bridge
- 1.4. Other
-
2. Type
- 2.1. Vinyl Barrier
- 2.2. Melamine Foam Composite Barrier
- 2.3. Polyurethane Foam Composite Barrier
- 2.4. PVC Barrier
- 2.5. Other
Traffic Noise Barrier Segmentation By Geography
-
1. North America
- 1.1. United States
- 1.2. Canada
- 1.3. Mexico
-
2. South America
- 2.1. Brazil
- 2.2. Argentina
- 2.3. Rest of South America
-
3. Europe
- 3.1. United Kingdom
- 3.2. Germany
- 3.3. France
- 3.4. Italy
- 3.5. Spain
- 3.6. Russia
- 3.7. Benelux
- 3.8. Nordics
- 3.9. Rest of Europe
-
4. Middle East & Africa
- 4.1. Turkey
- 4.2. Israel
- 4.3. GCC
- 4.4. North Africa
- 4.5. South Africa
- 4.6. Rest of Middle East & Africa
-
5. Asia Pacific
- 5.1. China
- 5.2. India
- 5.3. Japan
- 5.4. South Korea
- 5.5. ASEAN
- 5.6. Oceania
- 5.7. Rest of Asia Pacific
Traffic Noise Barrier Regional Market Share
Geographic Coverage of Traffic Noise Barrier
Traffic Noise Barrier REPORT HIGHLIGHTS
| Aspects | Details |
|---|---|
| Study Period | 2020-2034 |
| Base Year | 2025 |
| Estimated Year | 2026 |
| Forecast Period | 2026-2034 |
| Historical Period | 2020-2025 |
| Growth Rate | CAGR of XXX% from 2020-2034 |
| Segmentation |
|
Table of Contents
- 1. Introduction
- 1.1. Research Scope
- 1.2. Market Segmentation
- 1.3. Research Methodology
- 1.4. Definitions and Assumptions
- 2. Executive Summary
- 2.1. Introduction
- 3. Market Dynamics
- 3.1. Introduction
- 3.2. Market Drivers
- 3.3. Market Restrains
- 3.4. Market Trends
- 4. Market Factor Analysis
- 4.1. Porters Five Forces
- 4.2. Supply/Value Chain
- 4.3. PESTEL analysis
- 4.4. Market Entropy
- 4.5. Patent/Trademark Analysis
- 5. Global Traffic Noise Barrier Analysis, Insights and Forecast, 2020-2032
- 5.1. Market Analysis, Insights and Forecast - by Application
- 5.1.1. High Speed
- 5.1.2. The Way
- 5.1.3. Bridge
- 5.1.4. Other
- 5.2. Market Analysis, Insights and Forecast - by Type
- 5.2.1. Vinyl Barrier
- 5.2.2. Melamine Foam Composite Barrier
- 5.2.3. Polyurethane Foam Composite Barrier
- 5.2.4. PVC Barrier
- 5.2.5. Other
- 5.3. Market Analysis, Insights and Forecast - by Region
- 5.3.1. North America
- 5.3.2. South America
- 5.3.3. Europe
- 5.3.4. Middle East & Africa
- 5.3.5. Asia Pacific
- 5.1. Market Analysis, Insights and Forecast - by Application
- 6. North America Traffic Noise Barrier Analysis, Insights and Forecast, 2020-2032
- 6.1. Market Analysis, Insights and Forecast - by Application
- 6.1.1. High Speed
- 6.1.2. The Way
- 6.1.3. Bridge
- 6.1.4. Other
- 6.2. Market Analysis, Insights and Forecast - by Type
- 6.2.1. Vinyl Barrier
- 6.2.2. Melamine Foam Composite Barrier
- 6.2.3. Polyurethane Foam Composite Barrier
- 6.2.4. PVC Barrier
- 6.2.5. Other
- 6.1. Market Analysis, Insights and Forecast - by Application
- 7. South America Traffic Noise Barrier Analysis, Insights and Forecast, 2020-2032
- 7.1. Market Analysis, Insights and Forecast - by Application
- 7.1.1. High Speed
- 7.1.2. The Way
- 7.1.3. Bridge
- 7.1.4. Other
- 7.2. Market Analysis, Insights and Forecast - by Type
- 7.2.1. Vinyl Barrier
- 7.2.2. Melamine Foam Composite Barrier
- 7.2.3. Polyurethane Foam Composite Barrier
- 7.2.4. PVC Barrier
- 7.2.5. Other
- 7.1. Market Analysis, Insights and Forecast - by Application
- 8. Europe Traffic Noise Barrier Analysis, Insights and Forecast, 2020-2032
- 8.1. Market Analysis, Insights and Forecast - by Application
- 8.1.1. High Speed
- 8.1.2. The Way
- 8.1.3. Bridge
- 8.1.4. Other
- 8.2. Market Analysis, Insights and Forecast - by Type
- 8.2.1. Vinyl Barrier
- 8.2.2. Melamine Foam Composite Barrier
- 8.2.3. Polyurethane Foam Composite Barrier
- 8.2.4. PVC Barrier
- 8.2.5. Other
- 8.1. Market Analysis, Insights and Forecast - by Application
- 9. Middle East & Africa Traffic Noise Barrier Analysis, Insights and Forecast, 2020-2032
- 9.1. Market Analysis, Insights and Forecast - by Application
- 9.1.1. High Speed
- 9.1.2. The Way
- 9.1.3. Bridge
- 9.1.4. Other
- 9.2. Market Analysis, Insights and Forecast - by Type
- 9.2.1. Vinyl Barrier
- 9.2.2. Melamine Foam Composite Barrier
- 9.2.3. Polyurethane Foam Composite Barrier
- 9.2.4. PVC Barrier
- 9.2.5. Other
- 9.1. Market Analysis, Insights and Forecast - by Application
- 10. Asia Pacific Traffic Noise Barrier Analysis, Insights and Forecast, 2020-2032
- 10.1. Market Analysis, Insights and Forecast - by Application
- 10.1.1. High Speed
- 10.1.2. The Way
- 10.1.3. Bridge
- 10.1.4. Other
- 10.2. Market Analysis, Insights and Forecast - by Type
- 10.2.1. Vinyl Barrier
- 10.2.2. Melamine Foam Composite Barrier
- 10.2.3. Polyurethane Foam Composite Barrier
- 10.2.4. PVC Barrier
- 10.2.5. Other
- 10.1. Market Analysis, Insights and Forecast - by Application
- 11. Competitive Analysis
- 11.1. Global Market Share Analysis 2025
- 11.2. Company Profiles
- 11.2.1 Faddis Concrete Products
- 11.2.1.1. Overview
- 11.2.1.2. Products
- 11.2.1.3. SWOT Analysis
- 11.2.1.4. Recent Developments
- 11.2.1.5. Financials (Based on Availability)
- 11.2.2 Sound Fighter Systems
- 11.2.2.1. Overview
- 11.2.2.2. Products
- 11.2.2.3. SWOT Analysis
- 11.2.2.4. Recent Developments
- 11.2.2.5. Financials (Based on Availability)
- 11.2.3 AIL Sound Walls
- 11.2.3.1. Overview
- 11.2.3.2. Products
- 11.2.3.3. SWOT Analysis
- 11.2.3.4. Recent Developments
- 11.2.3.5. Financials (Based on Availability)
- 11.2.4 Acoustical Surfaces
- 11.2.4.1. Overview
- 11.2.4.2. Products
- 11.2.4.3. SWOT Analysis
- 11.2.4.4. Recent Developments
- 11.2.4.5. Financials (Based on Availability)
- 11.2.5 YENTE
- 11.2.5.1. Overview
- 11.2.5.2. Products
- 11.2.5.3. SWOT Analysis
- 11.2.5.4. Recent Developments
- 11.2.5.5. Financials (Based on Availability)
- 11.2.6 Hatko
- 11.2.6.1. Overview
- 11.2.6.2. Products
- 11.2.6.3. SWOT Analysis
- 11.2.6.4. Recent Developments
- 11.2.6.5. Financials (Based on Availability)
- 11.2.7 ERAM Engineering Services
- 11.2.7.1. Overview
- 11.2.7.2. Products
- 11.2.7.3. SWOT Analysis
- 11.2.7.4. Recent Developments
- 11.2.7.5. Financials (Based on Availability)
- 11.2.8 NOISE srl
- 11.2.8.1. Overview
- 11.2.8.2. Products
- 11.2.8.3. SWOT Analysis
- 11.2.8.4. Recent Developments
- 11.2.8.5. Financials (Based on Availability)
- 11.2.9 AFTEC LLC
- 11.2.9.1. Overview
- 11.2.9.2. Products
- 11.2.9.3. SWOT Analysis
- 11.2.9.4. Recent Developments
- 11.2.9.5. Financials (Based on Availability)
- 11.2.10 IAC Acoustics
- 11.2.10.1. Overview
- 11.2.10.2. Products
- 11.2.10.3. SWOT Analysis
- 11.2.10.4. Recent Developments
- 11.2.10.5. Financials (Based on Availability)
- 11.2.11 Accurate Perforating
- 11.2.11.1. Overview
- 11.2.11.2. Products
- 11.2.11.3. SWOT Analysis
- 11.2.11.4. Recent Developments
- 11.2.11.5. Financials (Based on Availability)
- 11.2.12 J & R Slaw Inc.
- 11.2.12.1. Overview
- 11.2.12.2. Products
- 11.2.12.3. SWOT Analysis
- 11.2.12.4. Recent Developments
- 11.2.12.5. Financials (Based on Availability)
- 11.2.13 Victory Awning
- 11.2.13.1. Overview
- 11.2.13.2. Products
- 11.2.13.3. SWOT Analysis
- 11.2.13.4. Recent Developments
- 11.2.13.5. Financials (Based on Availability)
- 11.2.14 South Bend Modern Molding
- 11.2.14.1. Overview
- 11.2.14.2. Products
- 11.2.14.3. SWOT Analysis
- 11.2.14.4. Recent Developments
- 11.2.14.5. Financials (Based on Availability)
- 11.2.15 Fibergrate Composite Structures
- 11.2.15.1. Overview
- 11.2.15.2. Products
- 11.2.15.3. SWOT Analysis
- 11.2.15.4. Recent Developments
- 11.2.15.5. Financials (Based on Availability)
- 11.2.16 Hoover Treated Wood Products Inc.
- 11.2.16.1. Overview
- 11.2.16.2. Products
- 11.2.16.3. SWOT Analysis
- 11.2.16.4. Recent Developments
- 11.2.16.5. Financials (Based on Availability)
- 11.2.17 Steel Guard Safety Corp.
- 11.2.17.1. Overview
- 11.2.17.2. Products
- 11.2.17.3. SWOT Analysis
- 11.2.17.4. Recent Developments
- 11.2.17.5. Financials (Based on Availability)
- 11.2.18 Soundown Corp.
- 11.2.18.1. Overview
- 11.2.18.2. Products
- 11.2.18.3. SWOT Analysis
- 11.2.18.4. Recent Developments
- 11.2.18.5. Financials (Based on Availability)
- 11.2.1 Faddis Concrete Products
List of Figures
- Figure 1: Global Traffic Noise Barrier Revenue Breakdown (million, %) by Region 2025 & 2033
- Figure 2: North America Traffic Noise Barrier Revenue (million), by Application 2025 & 2033
- Figure 3: North America Traffic Noise Barrier Revenue Share (%), by Application 2025 & 2033
- Figure 4: North America Traffic Noise Barrier Revenue (million), by Type 2025 & 2033
- Figure 5: North America Traffic Noise Barrier Revenue Share (%), by Type 2025 & 2033
- Figure 6: North America Traffic Noise Barrier Revenue (million), by Country 2025 & 2033
- Figure 7: North America Traffic Noise Barrier Revenue Share (%), by Country 2025 & 2033
- Figure 8: South America Traffic Noise Barrier Revenue (million), by Application 2025 & 2033
- Figure 9: South America Traffic Noise Barrier Revenue Share (%), by Application 2025 & 2033
- Figure 10: South America Traffic Noise Barrier Revenue (million), by Type 2025 & 2033
- Figure 11: South America Traffic Noise Barrier Revenue Share (%), by Type 2025 & 2033
- Figure 12: South America Traffic Noise Barrier Revenue (million), by Country 2025 & 2033
- Figure 13: South America Traffic Noise Barrier Revenue Share (%), by Country 2025 & 2033
- Figure 14: Europe Traffic Noise Barrier Revenue (million), by Application 2025 & 2033
- Figure 15: Europe Traffic Noise Barrier Revenue Share (%), by Application 2025 & 2033
- Figure 16: Europe Traffic Noise Barrier Revenue (million), by Type 2025 & 2033
- Figure 17: Europe Traffic Noise Barrier Revenue Share (%), by Type 2025 & 2033
- Figure 18: Europe Traffic Noise Barrier Revenue (million), by Country 2025 & 2033
- Figure 19: Europe Traffic Noise Barrier Revenue Share (%), by Country 2025 & 2033
- Figure 20: Middle East & Africa Traffic Noise Barrier Revenue (million), by Application 2025 & 2033
- Figure 21: Middle East & Africa Traffic Noise Barrier Revenue Share (%), by Application 2025 & 2033
- Figure 22: Middle East & Africa Traffic Noise Barrier Revenue (million), by Type 2025 & 2033
- Figure 23: Middle East & Africa Traffic Noise Barrier Revenue Share (%), by Type 2025 & 2033
- Figure 24: Middle East & Africa Traffic Noise Barrier Revenue (million), by Country 2025 & 2033
- Figure 25: Middle East & Africa Traffic Noise Barrier Revenue Share (%), by Country 2025 & 2033
- Figure 26: Asia Pacific Traffic Noise Barrier Revenue (million), by Application 2025 & 2033
- Figure 27: Asia Pacific Traffic Noise Barrier Revenue Share (%), by Application 2025 & 2033
- Figure 28: Asia Pacific Traffic Noise Barrier Revenue (million), by Type 2025 & 2033
- Figure 29: Asia Pacific Traffic Noise Barrier Revenue Share (%), by Type 2025 & 2033
- Figure 30: Asia Pacific Traffic Noise Barrier Revenue (million), by Country 2025 & 2033
- Figure 31: Asia Pacific Traffic Noise Barrier Revenue Share (%), by Country 2025 & 2033
List of Tables
- Table 1: Global Traffic Noise Barrier Revenue million Forecast, by Application 2020 & 2033
- Table 2: Global Traffic Noise Barrier Revenue million Forecast, by Type 2020 & 2033
- Table 3: Global Traffic Noise Barrier Revenue million Forecast, by Region 2020 & 2033
- Table 4: Global Traffic Noise Barrier Revenue million Forecast, by Application 2020 & 2033
- Table 5: Global Traffic Noise Barrier Revenue million Forecast, by Type 2020 & 2033
- Table 6: Global Traffic Noise Barrier Revenue million Forecast, by Country 2020 & 2033
- Table 7: United States Traffic Noise Barrier Revenue (million) Forecast, by Application 2020 & 2033
- Table 8: Canada Traffic Noise Barrier Revenue (million) Forecast, by Application 2020 & 2033
- Table 9: Mexico Traffic Noise Barrier Revenue (million) Forecast, by Application 2020 & 2033
- Table 10: Global Traffic Noise Barrier Revenue million Forecast, by Application 2020 & 2033
- Table 11: Global Traffic Noise Barrier Revenue million Forecast, by Type 2020 & 2033
- Table 12: Global Traffic Noise Barrier Revenue million Forecast, by Country 2020 & 2033
- Table 13: Brazil Traffic Noise Barrier Revenue (million) Forecast, by Application 2020 & 2033
- Table 14: Argentina Traffic Noise Barrier Revenue (million) Forecast, by Application 2020 & 2033
- Table 15: Rest of South America Traffic Noise Barrier Revenue (million) Forecast, by Application 2020 & 2033
- Table 16: Global Traffic Noise Barrier Revenue million Forecast, by Application 2020 & 2033
- Table 17: Global Traffic Noise Barrier Revenue million Forecast, by Type 2020 & 2033
- Table 18: Global Traffic Noise Barrier Revenue million Forecast, by Country 2020 & 2033
- Table 19: United Kingdom Traffic Noise Barrier Revenue (million) Forecast, by Application 2020 & 2033
- Table 20: Germany Traffic Noise Barrier Revenue (million) Forecast, by Application 2020 & 2033
- Table 21: France Traffic Noise Barrier Revenue (million) Forecast, by Application 2020 & 2033
- Table 22: Italy Traffic Noise Barrier Revenue (million) Forecast, by Application 2020 & 2033
- Table 23: Spain Traffic Noise Barrier Revenue (million) Forecast, by Application 2020 & 2033
- Table 24: Russia Traffic Noise Barrier Revenue (million) Forecast, by Application 2020 & 2033
- Table 25: Benelux Traffic Noise Barrier Revenue (million) Forecast, by Application 2020 & 2033
- Table 26: Nordics Traffic Noise Barrier Revenue (million) Forecast, by Application 2020 & 2033
- Table 27: Rest of Europe Traffic Noise Barrier Revenue (million) Forecast, by Application 2020 & 2033
- Table 28: Global Traffic Noise Barrier Revenue million Forecast, by Application 2020 & 2033
- Table 29: Global Traffic Noise Barrier Revenue million Forecast, by Type 2020 & 2033
- Table 30: Global Traffic Noise Barrier Revenue million Forecast, by Country 2020 & 2033
- Table 31: Turkey Traffic Noise Barrier Revenue (million) Forecast, by Application 2020 & 2033
- Table 32: Israel Traffic Noise Barrier Revenue (million) Forecast, by Application 2020 & 2033
- Table 33: GCC Traffic Noise Barrier Revenue (million) Forecast, by Application 2020 & 2033
- Table 34: North Africa Traffic Noise Barrier Revenue (million) Forecast, by Application 2020 & 2033
- Table 35: South Africa Traffic Noise Barrier Revenue (million) Forecast, by Application 2020 & 2033
- Table 36: Rest of Middle East & Africa Traffic Noise Barrier Revenue (million) Forecast, by Application 2020 & 2033
- Table 37: Global Traffic Noise Barrier Revenue million Forecast, by Application 2020 & 2033
- Table 38: Global Traffic Noise Barrier Revenue million Forecast, by Type 2020 & 2033
- Table 39: Global Traffic Noise Barrier Revenue million Forecast, by Country 2020 & 2033
- Table 40: China Traffic Noise Barrier Revenue (million) Forecast, by Application 2020 & 2033
- Table 41: India Traffic Noise Barrier Revenue (million) Forecast, by Application 2020 & 2033
- Table 42: Japan Traffic Noise Barrier Revenue (million) Forecast, by Application 2020 & 2033
- Table 43: South Korea Traffic Noise Barrier Revenue (million) Forecast, by Application 2020 & 2033
- Table 44: ASEAN Traffic Noise Barrier Revenue (million) Forecast, by Application 2020 & 2033
- Table 45: Oceania Traffic Noise Barrier Revenue (million) Forecast, by Application 2020 & 2033
- Table 46: Rest of Asia Pacific Traffic Noise Barrier Revenue (million) Forecast, by Application 2020 & 2033
Frequently Asked Questions
1. What is the projected Compound Annual Growth Rate (CAGR) of the Traffic Noise Barrier?
The projected CAGR is approximately XXX%.
2. Which companies are prominent players in the Traffic Noise Barrier?
Key companies in the market include Faddis Concrete Products, Sound Fighter Systems, AIL Sound Walls, Acoustical Surfaces, YENTE, Hatko, ERAM Engineering Services, NOISE srl, AFTEC, LLC, IAC Acoustics, Accurate Perforating, J & R Slaw, Inc., Victory Awning, South Bend Modern Molding, Fibergrate Composite Structures, Hoover Treated Wood Products, Inc., Steel Guard Safety Corp., Soundown Corp..
3. What are the main segments of the Traffic Noise Barrier?
The market segments include Application, Type.
4. Can you provide details about the market size?
The market size is estimated to be USD XXX million as of 2022.
5. What are some drivers contributing to market growth?
N/A
6. What are the notable trends driving market growth?
N/A
7. Are there any restraints impacting market growth?
N/A
8. Can you provide examples of recent developments in the market?
N/A
9. What pricing options are available for accessing the report?
Pricing options include single-user, multi-user, and enterprise licenses priced at USD 4250.00, USD 6375.00, and USD 8500.00 respectively.
10. Is the market size provided in terms of value or volume?
The market size is provided in terms of value, measured in million.
11. Are there any specific market keywords associated with the report?
Yes, the market keyword associated with the report is "Traffic Noise Barrier," which aids in identifying and referencing the specific market segment covered.
12. How do I determine which pricing option suits my needs best?
The pricing options vary based on user requirements and access needs. Individual users may opt for single-user licenses, while businesses requiring broader access may choose multi-user or enterprise licenses for cost-effective access to the report.
13. Are there any additional resources or data provided in the Traffic Noise Barrier report?
While the report offers comprehensive insights, it's advisable to review the specific contents or supplementary materials provided to ascertain if additional resources or data are available.
14. How can I stay updated on further developments or reports in the Traffic Noise Barrier?
To stay informed about further developments, trends, and reports in the Traffic Noise Barrier, consider subscribing to industry newsletters, following relevant companies and organizations, or regularly checking reputable industry news sources and publications.
Methodology
Step 1 - Identification of Relevant Samples Size from Population Database


Step 2 - Approaches for Defining Global Market Size (Value, Volume* & Price*)

Note*: In applicable scenarios
Step 3 - Data Sources
Primary Research
- Web Analytics
- Survey Reports
- Research Institute
- Latest Research Reports
- Opinion Leaders
Secondary Research
- Annual Reports
- White Paper
- Latest Press Release
- Industry Association
- Paid Database
- Investor Presentations

Step 4 - Data Triangulation
Involves using different sources of information in order to increase the validity of a study
These sources are likely to be stakeholders in a program - participants, other researchers, program staff, other community members, and so on.
Then we put all data in single framework & apply various statistical tools to find out the dynamic on the market.
During the analysis stage, feedback from the stakeholder groups would be compared to determine areas of agreement as well as areas of divergence