

Key Insights
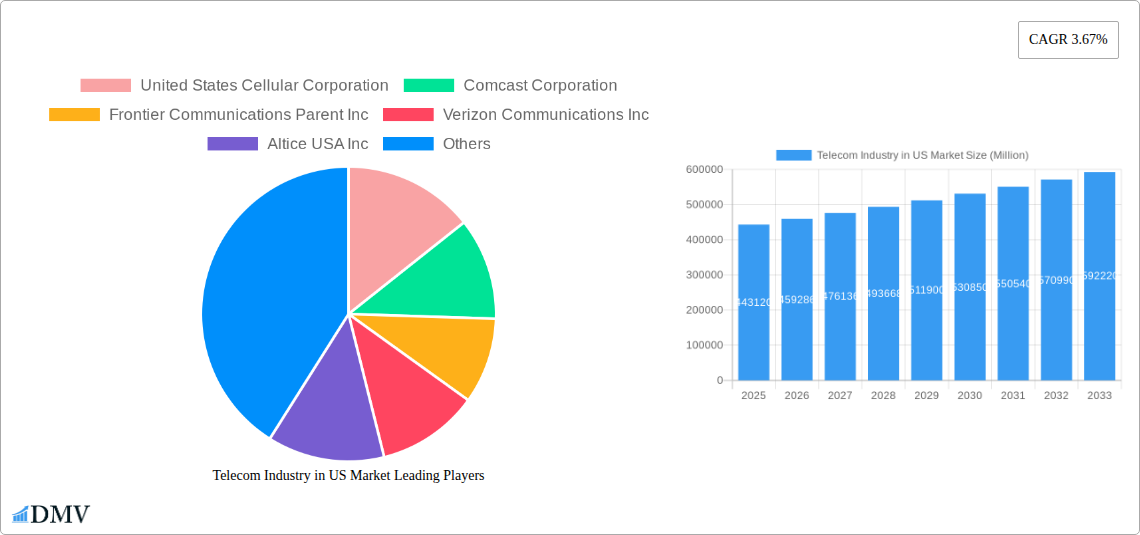
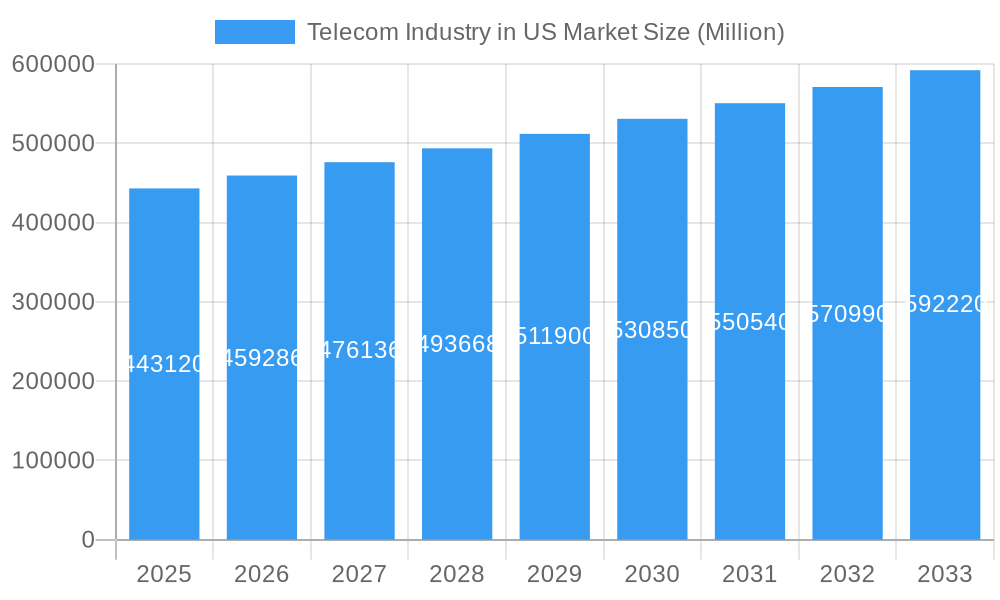
The US telecom industry, a $443.12 billion market in 2025, is projected to experience steady growth, exhibiting a Compound Annual Growth Rate (CAGR) of 3.67% from 2025 to 2033. This growth is fueled by several key drivers. The increasing demand for high-speed internet, driven by the proliferation of smart devices and the rise of remote work and entertainment streaming, significantly contributes to the expansion of data and messaging services. Furthermore, the ongoing deployment of 5G networks promises enhanced connectivity speeds and capacity, creating new opportunities for service providers to offer innovative and premium services, such as enhanced mobile broadband packages and IoT applications. While the market faces restraints like increasing competition and the need for continuous network infrastructure investments, the persistent demand for reliable connectivity across residential, commercial, and enterprise sectors ensures sustained growth. The segmentation reveals a dynamic landscape with significant contributions from Voice services, Wireless data & messaging services (including lucrative internet and handset data packages), and the rapidly expanding Over-the-Top (OTT) and Pay TV sectors, each offering varying revenue streams and growth potential. Key players such as Verizon, AT&T, T-Mobile, Comcast, and others continue to compete aggressively through strategic partnerships, technological advancements, and targeted marketing campaigns, aiming to capture market share within this evolving environment.
Telecom Industry in US Market Market Size (In Billion)
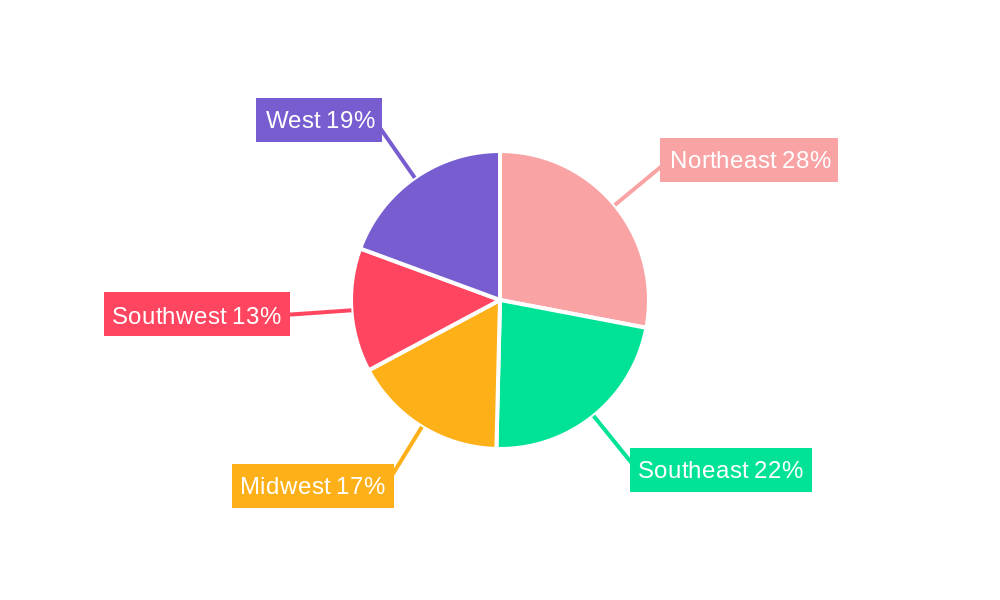
The regional breakdown further illustrates the diverse nature of the US telecom market. While detailed data is not provided for individual regions, it’s reasonable to assume that population density and economic activity influence regional market size. Areas with higher population concentrations, such as the Northeast and West, likely command larger market shares than less densely populated regions. However, the ongoing infrastructure investments and competitive strategies of telecom providers are steadily bridging the digital divide and expanding connectivity across all regions of the US. This balanced growth across diverse segments and geographies signifies the robust and resilient nature of the US telecom industry, ensuring its continued prominence in the global market. The forecast period of 2025-2033 promises further opportunities for innovation and growth, with the potential for new technologies and services to further reshape the industry.
Telecom Industry in US Market Company Market Share
Telecom Industry in US Market: A Comprehensive Market Report (2019-2033)
This insightful report provides a comprehensive analysis of the US Telecom market, covering its evolution, key players, and future prospects. With a study period spanning 2019-2033, a base year of 2025, and a forecast period of 2025-2033, this report offers crucial insights for stakeholders seeking to understand and capitalize on the dynamic US telecom landscape. The report meticulously analyzes market segments, including Voice Services, Wireless Data & Messaging Services, and OTT & Pay TV, providing detailed market size estimates (in Millions) and ARPU analysis for the period 2020-2027. Key players like AT&T, Verizon, T-Mobile, Comcast, and others are profiled, assessing their strategies and market positions.
Telecom Industry in US Market Market Composition & Trends
This section evaluates the competitive landscape of the US Telecom market, delving into market concentration, innovation drivers, regulatory frameworks, substitute products, end-user demographics, and merger & acquisition (M&A) activities. The report analyzes the market share distribution among major players, highlighting the dominant companies and their strategies. Further analysis explores the impact of regulatory changes on market dynamics, the influence of substitute products like VoIP and OTT services, and the evolving needs of end-users. M&A activity is examined, with analysis of deal values and their impact on market consolidation.
- Market Concentration: The US Telecom market is characterized by a concentrated landscape with a few dominant players controlling significant market share. XX% of the market is controlled by the top 5 players.
- Innovation Catalysts: 5G rollout, IoT adoption, and advancements in cloud computing are major drivers of innovation.
- Regulatory Landscape: The FCC's regulations significantly impact market competition and investment decisions.
- Substitute Products: The rise of OTT services and VoIP poses a competitive challenge to traditional telecom offerings.
- End-User Profiles: The report segments end-users based on demographics and usage patterns.
- M&A Activity: The report analyzes significant M&A deals, with aggregate deal values estimated at $XX Million in the past five years.
Telecom Industry in US Market Industry Evolution
This section provides a detailed analysis of the US Telecom market's evolution over the study period (2019-2033). The report explores market growth trajectories, examining historical growth rates (2019-2024) and projecting future growth rates (2025-2033). Technological advancements, such as the widespread adoption of 5G and fiber optics, are examined along with their impact on market dynamics. The report also analyzes shifting consumer demands, including the increasing preference for data-intensive services and the rise of bundled offerings. Detailed analysis of ARPU trends across various segments is included. The impact of technological innovations like AI and machine learning on service delivery and efficiency is discussed.
Leading Regions, Countries, or Segments in Telecom Industry in US Market
This section identifies the leading regions, countries, or segments within the US Telecom market. Focus is placed on the Services segment, encompassing Voice Services, Wireless Data & Messaging Services (including internet & handset data packages and package discounts), and OTT & Pay TV. The report utilizes detailed market size estimations (in Millions) for each segment from 2020 to 2027 to showcase market leadership. ARPU trends are analyzed for the overall services segment, identifying growth drivers and challenges in each segment.
- Wireless Data & Messaging Services: This segment dominates the market due to the increasing demand for high-speed data and mobile internet access. Key drivers include increasing smartphone penetration and the growing adoption of data-intensive applications. The average revenue per user (ARPU) for this segment is projected to reach $XX in 2027. Market size is estimated at $XX Million in 2027.
- OTT & Pay TV: This segment is experiencing significant growth due to increasing competition and the adoption of streaming services. Market size is estimated at $XX Million in 2027.
- Voice Services: While declining, the voice services market still holds a significant share, driven by bundled offerings with data and other services. Market size is estimated at $XX Million in 2027.
Telecom Industry in US Market Product Innovations
The US Telecom market is characterized by continuous product innovation. Recent years have witnessed the introduction of advanced data packages, bundled services incorporating voice, data, and entertainment options, and enhanced network capabilities to support the increasing demand for high-bandwidth applications. 5G network deployments and advancements in network infrastructure are driving improved speed, reliability, and capacity. The increasing adoption of cloud-based solutions and AI-driven network management systems enhance operational efficiency. Unique selling propositions frequently center on superior network coverage, faster speeds, and competitive pricing strategies.
Propelling Factors for Telecom Industry in US Market Growth
Several factors drive growth in the US Telecom market. Technological advancements, such as the deployment of 5G networks and fiber optics, are expanding network capacity and improving service quality, fueling demand for data-intensive services. Economic factors, including rising disposable incomes and increasing smartphone penetration, support increased spending on telecom services. Favorable regulatory environments encourage investment in infrastructure upgrades and innovation.
Obstacles in the Telecom Industry in US Market Market
Despite the growth opportunities, the US Telecom market faces several challenges. Stringent regulatory requirements and associated compliance costs can constrain profitability. Supply chain disruptions can impact the timely deployment of new technologies and network infrastructure upgrades. Intense competition among established players and emerging market entrants creates pressure on pricing and margins. These obstacles contribute to the cost of providing high-quality services.
Future Opportunities in Telecom Industry in US Market
The US Telecom market presents several promising opportunities. The expansion of 5G networks unlocks potential in IoT, enhancing the prospects for machine-to-machine communication and smart city initiatives. The growth of edge computing promises to facilitate low-latency applications, such as AR/VR, and autonomous vehicles. The rise of new consumer trends, such as the demand for bundled services and personalized offerings, create opportunities for innovative service packages.
Major Players in the Telecom Industry in US Market Ecosystem
Key Developments in Telecom Industry in US Market Industry
- September 2022: AT&T partnered with Ford to deliver 5G connectivity to 2023 heavy-duty Ford models, enabling faster navigation, mapping, and software upgrades. This enhances the vehicle's functionality and user experience, boosting 5G adoption in the automotive sector.
- August 2022: T-Mobile collaborated with Canva and Meta to offer free marketing resources to small businesses, including Canva Pro and $200 in Facebook/Instagram advertising. This initiative boosts T-Mobile's brand image and expands its reach into the small business market.
Strategic Telecom Industry in US Market Market Forecast
The US Telecom market is poised for continued growth, driven by ongoing 5G deployment, the expanding adoption of IoT devices, and the increasing demand for high-bandwidth applications. The convergence of telecom and technology sectors will further unlock new market opportunities. Investment in infrastructure upgrades and technological advancements will be crucial to maintaining competitiveness and fulfilling future consumer demands. The market is expected to maintain a healthy growth trajectory throughout the forecast period, with significant potential for innovation and expansion.
Telecom Industry in US Market Segmentation
-
1. Services
- 1.1. Voice Services
- 1.2. Data and
- 1.3. OTT and Pay TV
Telecom Industry in US Market Segmentation By Geography
-
1. North America
- 1.1. United States
- 1.2. Canada
- 1.3. Mexico
-
2. South America
- 2.1. Brazil
- 2.2. Argentina
- 2.3. Rest of South America
-
3. Europe
- 3.1. United Kingdom
- 3.2. Germany
- 3.3. France
- 3.4. Italy
- 3.5. Spain
- 3.6. Russia
- 3.7. Benelux
- 3.8. Nordics
- 3.9. Rest of Europe
-
4. Middle East & Africa
- 4.1. Turkey
- 4.2. Israel
- 4.3. GCC
- 4.4. North Africa
- 4.5. South Africa
- 4.6. Rest of Middle East & Africa
-
5. Asia Pacific
- 5.1. China
- 5.2. India
- 5.3. Japan
- 5.4. South Korea
- 5.5. ASEAN
- 5.6. Oceania
- 5.7. Rest of Asia Pacific
Telecom Industry in US Market Regional Market Share
Geographic Coverage of Telecom Industry in US Market
Telecom Industry in US Market REPORT HIGHLIGHTS
| Aspects | Details |
|---|---|
| Study Period | 2020-2034 |
| Base Year | 2025 |
| Estimated Year | 2026 |
| Forecast Period | 2026-2034 |
| Historical Period | 2020-2025 |
| Growth Rate | CAGR of 3.67% from 2020-2034 |
| Segmentation |
|
Table of Contents
- 1. Introduction
- 1.1. Research Scope
- 1.2. Market Segmentation
- 1.3. Research Methodology
- 1.4. Definitions and Assumptions
- 2. Executive Summary
- 2.1. Introduction
- 3. Market Dynamics
- 3.1. Introduction
- 3.2. Market Drivers
- 3.2.1. Growth of Mobile Internet Connection; Deployment of 5G network in the United States
- 3.3. Market Restrains
- 3.3.1. ; Lack of Control over Operations and Cost Visibility
- 3.4. Market Trends
- 3.4.1. Deployment of 5G Networks in the United States
- 4. Market Factor Analysis
- 4.1. Porters Five Forces
- 4.2. Supply/Value Chain
- 4.3. PESTEL analysis
- 4.4. Market Entropy
- 4.5. Patent/Trademark Analysis
- 5. Global Telecom Industry in US Market Analysis, Insights and Forecast, 2020-2032
- 5.1. Market Analysis, Insights and Forecast - by Services
- 5.1.1. Voice Services
- 5.1.2. Data and
- 5.1.3. OTT and Pay TV
- 5.2. Market Analysis, Insights and Forecast - by Region
- 5.2.1. North America
- 5.2.2. South America
- 5.2.3. Europe
- 5.2.4. Middle East & Africa
- 5.2.5. Asia Pacific
- 5.1. Market Analysis, Insights and Forecast - by Services
- 6. North America Telecom Industry in US Market Analysis, Insights and Forecast, 2020-2032
- 6.1. Market Analysis, Insights and Forecast - by Services
- 6.1.1. Voice Services
- 6.1.2. Data and
- 6.1.3. OTT and Pay TV
- 6.1. Market Analysis, Insights and Forecast - by Services
- 7. South America Telecom Industry in US Market Analysis, Insights and Forecast, 2020-2032
- 7.1. Market Analysis, Insights and Forecast - by Services
- 7.1.1. Voice Services
- 7.1.2. Data and
- 7.1.3. OTT and Pay TV
- 7.1. Market Analysis, Insights and Forecast - by Services
- 8. Europe Telecom Industry in US Market Analysis, Insights and Forecast, 2020-2032
- 8.1. Market Analysis, Insights and Forecast - by Services
- 8.1.1. Voice Services
- 8.1.2. Data and
- 8.1.3. OTT and Pay TV
- 8.1. Market Analysis, Insights and Forecast - by Services
- 9. Middle East & Africa Telecom Industry in US Market Analysis, Insights and Forecast, 2020-2032
- 9.1. Market Analysis, Insights and Forecast - by Services
- 9.1.1. Voice Services
- 9.1.2. Data and
- 9.1.3. OTT and Pay TV
- 9.1. Market Analysis, Insights and Forecast - by Services
- 10. Asia Pacific Telecom Industry in US Market Analysis, Insights and Forecast, 2020-2032
- 10.1. Market Analysis, Insights and Forecast - by Services
- 10.1.1. Voice Services
- 10.1.2. Data and
- 10.1.3. OTT and Pay TV
- 10.1. Market Analysis, Insights and Forecast - by Services
- 11. Competitive Analysis
- 11.1. Global Market Share Analysis 2025
- 11.2. Company Profiles
- 11.2.1 United States Cellular Corporation
- 11.2.1.1. Overview
- 11.2.1.2. Products
- 11.2.1.3. SWOT Analysis
- 11.2.1.4. Recent Developments
- 11.2.1.5. Financials (Based on Availability)
- 11.2.2 Comcast Corporation
- 11.2.2.1. Overview
- 11.2.2.2. Products
- 11.2.2.3. SWOT Analysis
- 11.2.2.4. Recent Developments
- 11.2.2.5. Financials (Based on Availability)
- 11.2.3 Frontier Communications Parent Inc
- 11.2.3.1. Overview
- 11.2.3.2. Products
- 11.2.3.3. SWOT Analysis
- 11.2.3.4. Recent Developments
- 11.2.3.5. Financials (Based on Availability)
- 11.2.4 Verizon Communications Inc
- 11.2.4.1. Overview
- 11.2.4.2. Products
- 11.2.4.3. SWOT Analysis
- 11.2.4.4. Recent Developments
- 11.2.4.5. Financials (Based on Availability)
- 11.2.5 Altice USA Inc
- 11.2.5.1. Overview
- 11.2.5.2. Products
- 11.2.5.3. SWOT Analysis
- 11.2.5.4. Recent Developments
- 11.2.5.5. Financials (Based on Availability)
- 11.2.6 DISH Network Corporation
- 11.2.6.1. Overview
- 11.2.6.2. Products
- 11.2.6.3. SWOT Analysis
- 11.2.6.4. Recent Developments
- 11.2.6.5. Financials (Based on Availability)
- 11.2.7 Charter Communications Inc
- 11.2.7.1. Overview
- 11.2.7.2. Products
- 11.2.7.3. SWOT Analysis
- 11.2.7.4. Recent Developments
- 11.2.7.5. Financials (Based on Availability)
- 11.2.8 Lumen Technologies Inc
- 11.2.8.1. Overview
- 11.2.8.2. Products
- 11.2.8.3. SWOT Analysis
- 11.2.8.4. Recent Developments
- 11.2.8.5. Financials (Based on Availability)
- 11.2.9 Windstream Holdings Inc
- 11.2.9.1. Overview
- 11.2.9.2. Products
- 11.2.9.3. SWOT Analysis
- 11.2.9.4. Recent Developments
- 11.2.9.5. Financials (Based on Availability)
- 11.2.10 Cox Communications Inc
- 11.2.10.1. Overview
- 11.2.10.2. Products
- 11.2.10.3. SWOT Analysis
- 11.2.10.4. Recent Developments
- 11.2.10.5. Financials (Based on Availability)
- 11.2.11 AT&T Inc
- 11.2.11.1. Overview
- 11.2.11.2. Products
- 11.2.11.3. SWOT Analysis
- 11.2.11.4. Recent Developments
- 11.2.11.5. Financials (Based on Availability)
- 11.2.12 T-Mobile US Inc
- 11.2.12.1. Overview
- 11.2.12.2. Products
- 11.2.12.3. SWOT Analysis
- 11.2.12.4. Recent Developments
- 11.2.12.5. Financials (Based on Availability)
- 11.2.1 United States Cellular Corporation
List of Figures
- Figure 1: Global Telecom Industry in US Market Revenue Breakdown (Million, %) by Region 2025 & 2033
- Figure 2: Global Telecom Industry in US Market Volume Breakdown (K Unit, %) by Region 2025 & 2033
- Figure 3: North America Telecom Industry in US Market Revenue (Million), by Services 2025 & 2033
- Figure 4: North America Telecom Industry in US Market Volume (K Unit), by Services 2025 & 2033
- Figure 5: North America Telecom Industry in US Market Revenue Share (%), by Services 2025 & 2033
- Figure 6: North America Telecom Industry in US Market Volume Share (%), by Services 2025 & 2033
- Figure 7: North America Telecom Industry in US Market Revenue (Million), by Country 2025 & 2033
- Figure 8: North America Telecom Industry in US Market Volume (K Unit), by Country 2025 & 2033
- Figure 9: North America Telecom Industry in US Market Revenue Share (%), by Country 2025 & 2033
- Figure 10: North America Telecom Industry in US Market Volume Share (%), by Country 2025 & 2033
- Figure 11: South America Telecom Industry in US Market Revenue (Million), by Services 2025 & 2033
- Figure 12: South America Telecom Industry in US Market Volume (K Unit), by Services 2025 & 2033
- Figure 13: South America Telecom Industry in US Market Revenue Share (%), by Services 2025 & 2033
- Figure 14: South America Telecom Industry in US Market Volume Share (%), by Services 2025 & 2033
- Figure 15: South America Telecom Industry in US Market Revenue (Million), by Country 2025 & 2033
- Figure 16: South America Telecom Industry in US Market Volume (K Unit), by Country 2025 & 2033
- Figure 17: South America Telecom Industry in US Market Revenue Share (%), by Country 2025 & 2033
- Figure 18: South America Telecom Industry in US Market Volume Share (%), by Country 2025 & 2033
- Figure 19: Europe Telecom Industry in US Market Revenue (Million), by Services 2025 & 2033
- Figure 20: Europe Telecom Industry in US Market Volume (K Unit), by Services 2025 & 2033
- Figure 21: Europe Telecom Industry in US Market Revenue Share (%), by Services 2025 & 2033
- Figure 22: Europe Telecom Industry in US Market Volume Share (%), by Services 2025 & 2033
- Figure 23: Europe Telecom Industry in US Market Revenue (Million), by Country 2025 & 2033
- Figure 24: Europe Telecom Industry in US Market Volume (K Unit), by Country 2025 & 2033
- Figure 25: Europe Telecom Industry in US Market Revenue Share (%), by Country 2025 & 2033
- Figure 26: Europe Telecom Industry in US Market Volume Share (%), by Country 2025 & 2033
- Figure 27: Middle East & Africa Telecom Industry in US Market Revenue (Million), by Services 2025 & 2033
- Figure 28: Middle East & Africa Telecom Industry in US Market Volume (K Unit), by Services 2025 & 2033
- Figure 29: Middle East & Africa Telecom Industry in US Market Revenue Share (%), by Services 2025 & 2033
- Figure 30: Middle East & Africa Telecom Industry in US Market Volume Share (%), by Services 2025 & 2033
- Figure 31: Middle East & Africa Telecom Industry in US Market Revenue (Million), by Country 2025 & 2033
- Figure 32: Middle East & Africa Telecom Industry in US Market Volume (K Unit), by Country 2025 & 2033
- Figure 33: Middle East & Africa Telecom Industry in US Market Revenue Share (%), by Country 2025 & 2033
- Figure 34: Middle East & Africa Telecom Industry in US Market Volume Share (%), by Country 2025 & 2033
- Figure 35: Asia Pacific Telecom Industry in US Market Revenue (Million), by Services 2025 & 2033
- Figure 36: Asia Pacific Telecom Industry in US Market Volume (K Unit), by Services 2025 & 2033
- Figure 37: Asia Pacific Telecom Industry in US Market Revenue Share (%), by Services 2025 & 2033
- Figure 38: Asia Pacific Telecom Industry in US Market Volume Share (%), by Services 2025 & 2033
- Figure 39: Asia Pacific Telecom Industry in US Market Revenue (Million), by Country 2025 & 2033
- Figure 40: Asia Pacific Telecom Industry in US Market Volume (K Unit), by Country 2025 & 2033
- Figure 41: Asia Pacific Telecom Industry in US Market Revenue Share (%), by Country 2025 & 2033
- Figure 42: Asia Pacific Telecom Industry in US Market Volume Share (%), by Country 2025 & 2033
List of Tables
- Table 1: Global Telecom Industry in US Market Revenue Million Forecast, by Services 2020 & 2033
- Table 2: Global Telecom Industry in US Market Volume K Unit Forecast, by Services 2020 & 2033
- Table 3: Global Telecom Industry in US Market Revenue Million Forecast, by Region 2020 & 2033
- Table 4: Global Telecom Industry in US Market Volume K Unit Forecast, by Region 2020 & 2033
- Table 5: Global Telecom Industry in US Market Revenue Million Forecast, by Services 2020 & 2033
- Table 6: Global Telecom Industry in US Market Volume K Unit Forecast, by Services 2020 & 2033
- Table 7: Global Telecom Industry in US Market Revenue Million Forecast, by Country 2020 & 2033
- Table 8: Global Telecom Industry in US Market Volume K Unit Forecast, by Country 2020 & 2033
- Table 9: United States Telecom Industry in US Market Revenue (Million) Forecast, by Application 2020 & 2033
- Table 10: United States Telecom Industry in US Market Volume (K Unit) Forecast, by Application 2020 & 2033
- Table 11: Canada Telecom Industry in US Market Revenue (Million) Forecast, by Application 2020 & 2033
- Table 12: Canada Telecom Industry in US Market Volume (K Unit) Forecast, by Application 2020 & 2033
- Table 13: Mexico Telecom Industry in US Market Revenue (Million) Forecast, by Application 2020 & 2033
- Table 14: Mexico Telecom Industry in US Market Volume (K Unit) Forecast, by Application 2020 & 2033
- Table 15: Global Telecom Industry in US Market Revenue Million Forecast, by Services 2020 & 2033
- Table 16: Global Telecom Industry in US Market Volume K Unit Forecast, by Services 2020 & 2033
- Table 17: Global Telecom Industry in US Market Revenue Million Forecast, by Country 2020 & 2033
- Table 18: Global Telecom Industry in US Market Volume K Unit Forecast, by Country 2020 & 2033
- Table 19: Brazil Telecom Industry in US Market Revenue (Million) Forecast, by Application 2020 & 2033
- Table 20: Brazil Telecom Industry in US Market Volume (K Unit) Forecast, by Application 2020 & 2033
- Table 21: Argentina Telecom Industry in US Market Revenue (Million) Forecast, by Application 2020 & 2033
- Table 22: Argentina Telecom Industry in US Market Volume (K Unit) Forecast, by Application 2020 & 2033
- Table 23: Rest of South America Telecom Industry in US Market Revenue (Million) Forecast, by Application 2020 & 2033
- Table 24: Rest of South America Telecom Industry in US Market Volume (K Unit) Forecast, by Application 2020 & 2033
- Table 25: Global Telecom Industry in US Market Revenue Million Forecast, by Services 2020 & 2033
- Table 26: Global Telecom Industry in US Market Volume K Unit Forecast, by Services 2020 & 2033
- Table 27: Global Telecom Industry in US Market Revenue Million Forecast, by Country 2020 & 2033
- Table 28: Global Telecom Industry in US Market Volume K Unit Forecast, by Country 2020 & 2033
- Table 29: United Kingdom Telecom Industry in US Market Revenue (Million) Forecast, by Application 2020 & 2033
- Table 30: United Kingdom Telecom Industry in US Market Volume (K Unit) Forecast, by Application 2020 & 2033
- Table 31: Germany Telecom Industry in US Market Revenue (Million) Forecast, by Application 2020 & 2033
- Table 32: Germany Telecom Industry in US Market Volume (K Unit) Forecast, by Application 2020 & 2033
- Table 33: France Telecom Industry in US Market Revenue (Million) Forecast, by Application 2020 & 2033
- Table 34: France Telecom Industry in US Market Volume (K Unit) Forecast, by Application 2020 & 2033
- Table 35: Italy Telecom Industry in US Market Revenue (Million) Forecast, by Application 2020 & 2033
- Table 36: Italy Telecom Industry in US Market Volume (K Unit) Forecast, by Application 2020 & 2033
- Table 37: Spain Telecom Industry in US Market Revenue (Million) Forecast, by Application 2020 & 2033
- Table 38: Spain Telecom Industry in US Market Volume (K Unit) Forecast, by Application 2020 & 2033
- Table 39: Russia Telecom Industry in US Market Revenue (Million) Forecast, by Application 2020 & 2033
- Table 40: Russia Telecom Industry in US Market Volume (K Unit) Forecast, by Application 2020 & 2033
- Table 41: Benelux Telecom Industry in US Market Revenue (Million) Forecast, by Application 2020 & 2033
- Table 42: Benelux Telecom Industry in US Market Volume (K Unit) Forecast, by Application 2020 & 2033
- Table 43: Nordics Telecom Industry in US Market Revenue (Million) Forecast, by Application 2020 & 2033
- Table 44: Nordics Telecom Industry in US Market Volume (K Unit) Forecast, by Application 2020 & 2033
- Table 45: Rest of Europe Telecom Industry in US Market Revenue (Million) Forecast, by Application 2020 & 2033
- Table 46: Rest of Europe Telecom Industry in US Market Volume (K Unit) Forecast, by Application 2020 & 2033
- Table 47: Global Telecom Industry in US Market Revenue Million Forecast, by Services 2020 & 2033
- Table 48: Global Telecom Industry in US Market Volume K Unit Forecast, by Services 2020 & 2033
- Table 49: Global Telecom Industry in US Market Revenue Million Forecast, by Country 2020 & 2033
- Table 50: Global Telecom Industry in US Market Volume K Unit Forecast, by Country 2020 & 2033
- Table 51: Turkey Telecom Industry in US Market Revenue (Million) Forecast, by Application 2020 & 2033
- Table 52: Turkey Telecom Industry in US Market Volume (K Unit) Forecast, by Application 2020 & 2033
- Table 53: Israel Telecom Industry in US Market Revenue (Million) Forecast, by Application 2020 & 2033
- Table 54: Israel Telecom Industry in US Market Volume (K Unit) Forecast, by Application 2020 & 2033
- Table 55: GCC Telecom Industry in US Market Revenue (Million) Forecast, by Application 2020 & 2033
- Table 56: GCC Telecom Industry in US Market Volume (K Unit) Forecast, by Application 2020 & 2033
- Table 57: North Africa Telecom Industry in US Market Revenue (Million) Forecast, by Application 2020 & 2033
- Table 58: North Africa Telecom Industry in US Market Volume (K Unit) Forecast, by Application 2020 & 2033
- Table 59: South Africa Telecom Industry in US Market Revenue (Million) Forecast, by Application 2020 & 2033
- Table 60: South Africa Telecom Industry in US Market Volume (K Unit) Forecast, by Application 2020 & 2033
- Table 61: Rest of Middle East & Africa Telecom Industry in US Market Revenue (Million) Forecast, by Application 2020 & 2033
- Table 62: Rest of Middle East & Africa Telecom Industry in US Market Volume (K Unit) Forecast, by Application 2020 & 2033
- Table 63: Global Telecom Industry in US Market Revenue Million Forecast, by Services 2020 & 2033
- Table 64: Global Telecom Industry in US Market Volume K Unit Forecast, by Services 2020 & 2033
- Table 65: Global Telecom Industry in US Market Revenue Million Forecast, by Country 2020 & 2033
- Table 66: Global Telecom Industry in US Market Volume K Unit Forecast, by Country 2020 & 2033
- Table 67: China Telecom Industry in US Market Revenue (Million) Forecast, by Application 2020 & 2033
- Table 68: China Telecom Industry in US Market Volume (K Unit) Forecast, by Application 2020 & 2033
- Table 69: India Telecom Industry in US Market Revenue (Million) Forecast, by Application 2020 & 2033
- Table 70: India Telecom Industry in US Market Volume (K Unit) Forecast, by Application 2020 & 2033
- Table 71: Japan Telecom Industry in US Market Revenue (Million) Forecast, by Application 2020 & 2033
- Table 72: Japan Telecom Industry in US Market Volume (K Unit) Forecast, by Application 2020 & 2033
- Table 73: South Korea Telecom Industry in US Market Revenue (Million) Forecast, by Application 2020 & 2033
- Table 74: South Korea Telecom Industry in US Market Volume (K Unit) Forecast, by Application 2020 & 2033
- Table 75: ASEAN Telecom Industry in US Market Revenue (Million) Forecast, by Application 2020 & 2033
- Table 76: ASEAN Telecom Industry in US Market Volume (K Unit) Forecast, by Application 2020 & 2033
- Table 77: Oceania Telecom Industry in US Market Revenue (Million) Forecast, by Application 2020 & 2033
- Table 78: Oceania Telecom Industry in US Market Volume (K Unit) Forecast, by Application 2020 & 2033
- Table 79: Rest of Asia Pacific Telecom Industry in US Market Revenue (Million) Forecast, by Application 2020 & 2033
- Table 80: Rest of Asia Pacific Telecom Industry in US Market Volume (K Unit) Forecast, by Application 2020 & 2033
Frequently Asked Questions
1. What is the projected Compound Annual Growth Rate (CAGR) of the Telecom Industry in US Market?
The projected CAGR is approximately 3.67%.
2. Which companies are prominent players in the Telecom Industry in US Market?
Key companies in the market include United States Cellular Corporation, Comcast Corporation, Frontier Communications Parent Inc, Verizon Communications Inc, Altice USA Inc, DISH Network Corporation, Charter Communications Inc, Lumen Technologies Inc, Windstream Holdings Inc, Cox Communications Inc, AT&T Inc, T-Mobile US Inc.
3. What are the main segments of the Telecom Industry in US Market?
The market segments include Services.
4. Can you provide details about the market size?
The market size is estimated to be USD 443.12 Million as of 2022.
5. What are some drivers contributing to market growth?
Growth of Mobile Internet Connection; Deployment of 5G network in the United States.
6. What are the notable trends driving market growth?
Deployment of 5G Networks in the United States.
7. Are there any restraints impacting market growth?
; Lack of Control over Operations and Cost Visibility.
8. Can you provide examples of recent developments in the market?
September 2022: AT&T unveiled its collaboration with Ford, thereby promising to deliver 5G Connectivity to the heavy-duty 2023 models of Ford. This ensures faster navigation, mapping, and audio downloads with AT&T 5G and enables Ford Power-Up software upgrades to be downloaded easily. This development will help the vehicle get better over time.
9. What pricing options are available for accessing the report?
Pricing options include single-user, multi-user, and enterprise licenses priced at USD 3800, USD 4500, and USD 5800 respectively.
10. Is the market size provided in terms of value or volume?
The market size is provided in terms of value, measured in Million and volume, measured in K Unit.
11. Are there any specific market keywords associated with the report?
Yes, the market keyword associated with the report is "Telecom Industry in US Market," which aids in identifying and referencing the specific market segment covered.
12. How do I determine which pricing option suits my needs best?
The pricing options vary based on user requirements and access needs. Individual users may opt for single-user licenses, while businesses requiring broader access may choose multi-user or enterprise licenses for cost-effective access to the report.
13. Are there any additional resources or data provided in the Telecom Industry in US Market report?
While the report offers comprehensive insights, it's advisable to review the specific contents or supplementary materials provided to ascertain if additional resources or data are available.
14. How can I stay updated on further developments or reports in the Telecom Industry in US Market?
To stay informed about further developments, trends, and reports in the Telecom Industry in US Market, consider subscribing to industry newsletters, following relevant companies and organizations, or regularly checking reputable industry news sources and publications.
Methodology
Step 1 - Identification of Relevant Samples Size from Population Database


Step 2 - Approaches for Defining Global Market Size (Value, Volume* & Price*)

Note*: In applicable scenarios
Step 3 - Data Sources
Primary Research
- Web Analytics
- Survey Reports
- Research Institute
- Latest Research Reports
- Opinion Leaders
Secondary Research
- Annual Reports
- White Paper
- Latest Press Release
- Industry Association
- Paid Database
- Investor Presentations

Step 4 - Data Triangulation
Involves using different sources of information in order to increase the validity of a study
These sources are likely to be stakeholders in a program - participants, other researchers, program staff, other community members, and so on.
Then we put all data in single framework & apply various statistical tools to find out the dynamic on the market.
During the analysis stage, feedback from the stakeholder groups would be compared to determine areas of agreement as well as areas of divergence