

Key Insights
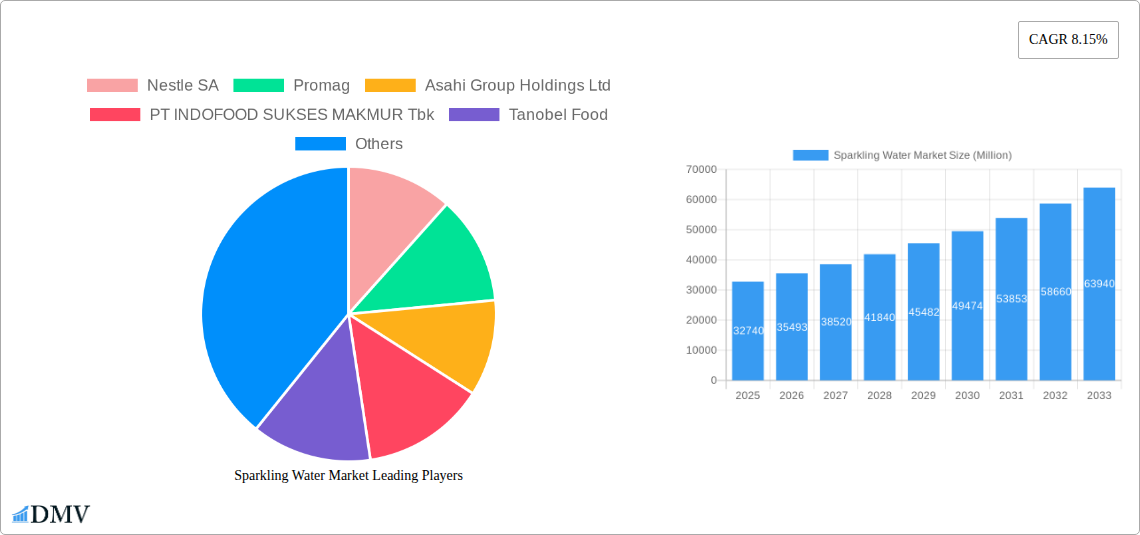
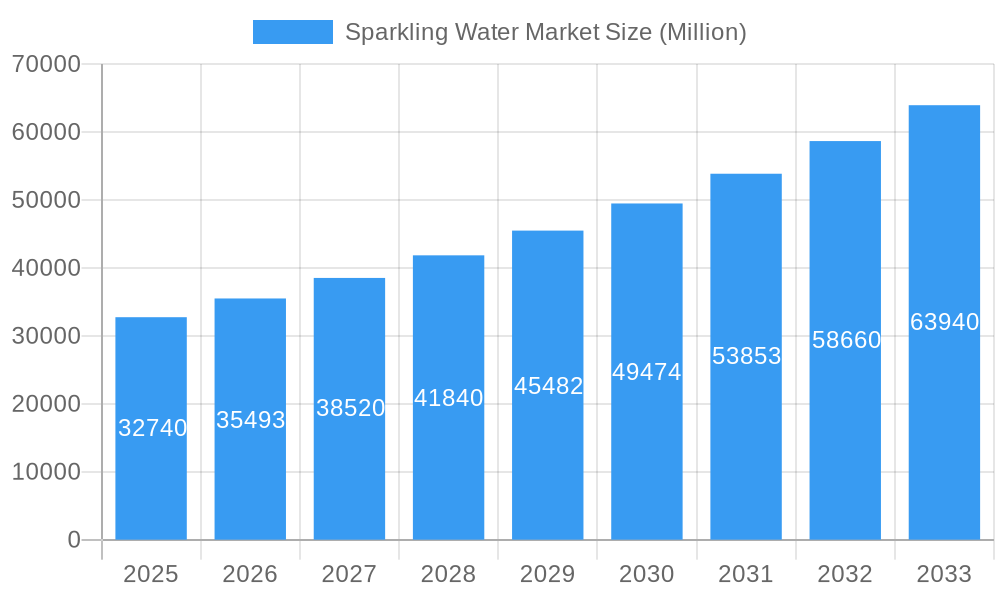
The global sparkling water market, valued at $32,740 million in 2025, is projected to experience robust growth, driven by a rising consumer preference for healthier beverages and increasing health consciousness. The market's Compound Annual Growth Rate (CAGR) of 8.15% from 2019 to 2033 signifies a substantial expansion over the forecast period (2025-2033). This growth is fueled by several key factors. Firstly, the increasing awareness of the negative health impacts associated with sugary drinks is prompting consumers to switch to healthier alternatives, with sparkling water emerging as a popular choice. Secondly, the diverse range of flavors and functional additions available in the market caters to varied consumer preferences, boosting product appeal. The rising popularity of online retail channels also contributes significantly to market expansion, providing convenient access to a wider range of sparkling water brands. Furthermore, strategic marketing initiatives focusing on the health and wellness benefits of sparkling water are further propelling market growth.
Sparkling Water Market Market Size (In Billion)
Segmentation analysis reveals that supermarkets/hypermarkets dominate the distribution channels, reflecting the high purchase frequency of sparkling water. However, the convenience store and online retail segments are also experiencing significant growth, indicative of the increasing demand for on-the-go consumption and home delivery options. Major players like Nestle SA, Coca-Cola, and Danone are leveraging their established distribution networks and brand recognition to capture significant market share. Despite the positive outlook, the market faces some challenges. Price fluctuations in raw materials and potential regulatory changes could impact profitability. Competition from other beverage categories and the emergence of new entrants also pose challenges for existing players. Nevertheless, the overall market forecast remains positive, indicating a promising future for the sparkling water industry.
Sparkling Water Market Company Market Share
Sparkling Water Market: A Comprehensive Report (2019-2033)
This insightful report provides a detailed analysis of the global Sparkling Water Market, offering a comprehensive overview of market trends, competitive landscape, and future growth prospects. Covering the period from 2019 to 2033, with a base year of 2025 and a forecast period spanning 2025-2033, this report is an essential resource for stakeholders seeking to understand and capitalize on the opportunities within this dynamic market. The total market value is estimated at xx Million in 2025 and is projected to reach xx Million by 2033.
Sparkling Water Market Composition & Trends
This section delves into the intricate dynamics of the sparkling water market, examining its concentration, innovation drivers, regulatory environment, substitute products, end-user profiles, and merger & acquisition (M&A) activities. The market is characterized by a moderately concentrated structure, with key players like Nestle SA, The Coca-Cola Company, and Danone S.A. holding significant market shares. However, the presence of numerous regional and smaller players indicates a competitive landscape. Innovation is driven by consumer demand for healthier alternatives and unique flavor profiles, leading to the development of functional waters and infused sparkling waters.
- Market Share Distribution (2025): Nestle SA (xx%), The Coca-Cola Company (xx%), Danone S.A. (xx%), Others (xx%).
- M&A Activity (2019-2024): A total of xx M&A deals were recorded, with a total value of approximately xx Million. These deals primarily focused on expanding product portfolios and geographic reach.
- Regulatory Landscape: Varies across regions, with increasing focus on labeling, health claims, and sustainability.
- Substitute Products: Still water, carbonated soft drinks, and juices pose competitive challenges.
- End-User Profiles: Health-conscious consumers, millennials, and those seeking healthier alternatives to sugary drinks are key drivers.
Sparkling Water Market Industry Evolution
The sparkling water market has witnessed significant growth over the past few years, fueled by changing consumer preferences and technological advancements. The historical period (2019-2024) showed a Compound Annual Growth Rate (CAGR) of xx%, driven by increasing health awareness and a shift away from sugary drinks. Technological advancements in packaging, such as the use of sustainable materials (as seen in Danone-AQUA's AQUA LIFE launch), are contributing to market expansion. Consumer demand for natural and functional sparkling waters, with added vitamins or electrolytes, is also a significant growth factor. The forecast period (2025-2033) is expected to see a CAGR of xx%, with continued growth driven by product innovation, market penetration in emerging economies, and increasing health consciousness among consumers.
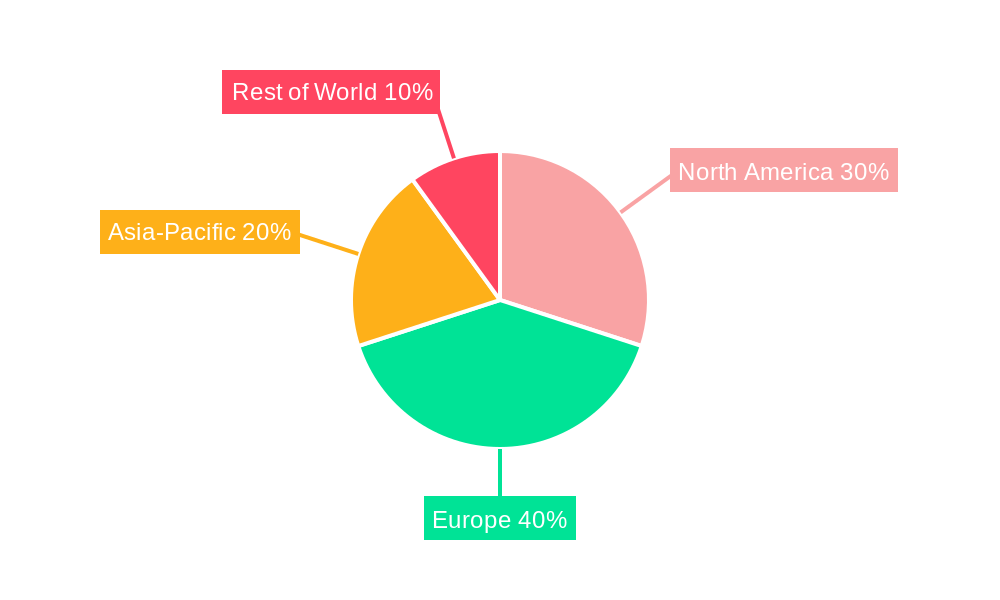
Leading Regions, Countries, or Segments in Sparkling Water Market
The North American market currently dominates the global sparkling water market, driven by high consumer spending on health and wellness products, strong brand recognition, and established distribution channels. However, Asia-Pacific is expected to witness significant growth in the coming years, fuelled by rising disposable incomes and increasing urbanization.
- Dominant Region: North America
- Key Drivers (North America): High disposable income, established distribution networks, strong consumer demand for health and wellness products.
- Key Drivers (Asia-Pacific): Rising disposable incomes, increasing urbanization, and growing health consciousness.
- Type Segment Dominance: Sparkling water holds the largest market share within the type segment due to its refreshing taste and perception as a healthier alternative to sugary drinks.
- Distribution Channel Dominance: Supermarkets/Hypermarkets currently dominate the distribution channel due to their widespread presence and established supply chains. However, online retailers are showing rapid growth, driven by convenience and increasing internet penetration.
Sparkling Water Market Product Innovations
Recent innovations have focused on enhanced flavors, functional benefits (e.g., added electrolytes or vitamins), and sustainable packaging. The introduction of products with unique flavor profiles, such as fruit infusions and herbal blends, has broadened the appeal of sparkling water beyond its traditional, plain offering. The use of recycled PET bottles and other eco-friendly packaging materials also appeals to an increasingly environmentally conscious consumer base.
Propelling Factors for Sparkling Water Market Growth
Several factors are driving the growth of the sparkling water market:
- Health and Wellness Trend: Consumers are increasingly seeking healthier alternatives to sugary drinks.
- Product Innovation: The introduction of new flavors, functional benefits, and sustainable packaging is attracting new customers.
- Growing Disposable Incomes: In developing economies, rising disposable incomes are increasing the demand for premium beverages.
Obstacles in the Sparkling Water Market Market
Challenges faced by the sparkling water market include:
- Intense Competition: The market is highly competitive, with both large multinational companies and smaller regional players vying for market share.
- Supply Chain Disruptions: Global events such as pandemics and geopolitical instability can disrupt the supply chain, leading to production delays and price increases.
- Regulatory Scrutiny: Regulations regarding labeling, health claims, and sustainability can vary across different regions and impact businesses.
Future Opportunities in Sparkling Water Market
Future opportunities lie in:
- Expanding into Emerging Markets: Untapped potential exists in developing countries with growing middle classes.
- Developing Innovative Products: Creating new flavors, functional benefits, and sustainable packaging options will attract consumers.
- Leveraging E-commerce: Online retailers offer a rapidly growing distribution channel for the market.
Major Players in the Sparkling Water Market Ecosystem
- Nestle SA
- Promag
- Asahi Group Holdings Ltd
- PT INDOFOOD SUKSES MAKMUR Tbk
- Tanobel Food
- Fraser and Neave Limited
- Danone S A
- Blue Band
- The Coca-Cola Company
- Indo Food
- Kosme Group
Key Developments in Sparkling Water Market Industry
- June 2021: Nestlé Waters announced its commitment to responsible water management and collaborative regional solutions, aiming for a positive impact on the water cycle by 2025.
- January 2022: Danone-AQUA launched AQUA LIFE, using 100% recycled PET bottles, highlighting a commitment to sustainability.
- August 2022: Kosme Group launched Jiwater in Indonesia, a natural artesian water with Japanese technological processing and a pH range of 7.5-8. This launch expands the market in Indonesia and highlights innovative production techniques.
Strategic Sparkling Water Market Forecast
The sparkling water market is poised for continued growth, driven by increasing health consciousness, innovation in product offerings, and expansion into new markets. The forecast period (2025-2033) suggests robust growth, with significant opportunities for companies that can adapt to changing consumer preferences and leverage technological advancements to create sustainable and innovative products. The market is expected to benefit from the growing demand for healthier alternatives, the focus on sustainability, and the continued rise in disposable incomes worldwide.
Sparkling Water Market Segmentation
-
1. Type
- 1.1. Still Water
- 1.2. Sparkling Water
- 1.3. Functional Water
-
2. Distribution Channel
- 2.1. Supermarkets/Hypermarkets
- 2.2. Convenience Stores
- 2.3. Online Retailers
- 2.4. On-trade
- 2.5. Other Distribution Channels
Sparkling Water Market Segmentation By Geography
-
1. North America
- 1.1. United States
- 1.2. Canada
- 1.3. Mexico
-
2. South America
- 2.1. Brazil
- 2.2. Argentina
- 2.3. Rest of South America
-
3. Europe
- 3.1. United Kingdom
- 3.2. Germany
- 3.3. France
- 3.4. Italy
- 3.5. Spain
- 3.6. Russia
- 3.7. Benelux
- 3.8. Nordics
- 3.9. Rest of Europe
-
4. Middle East & Africa
- 4.1. Turkey
- 4.2. Israel
- 4.3. GCC
- 4.4. North Africa
- 4.5. South Africa
- 4.6. Rest of Middle East & Africa
-
5. Asia Pacific
- 5.1. China
- 5.2. India
- 5.3. Japan
- 5.4. South Korea
- 5.5. ASEAN
- 5.6. Oceania
- 5.7. Rest of Asia Pacific
Sparkling Water Market Regional Market Share
Geographic Coverage of Sparkling Water Market
Sparkling Water Market REPORT HIGHLIGHTS
| Aspects | Details |
|---|---|
| Study Period | 2020-2034 |
| Base Year | 2025 |
| Estimated Year | 2026 |
| Forecast Period | 2026-2034 |
| Historical Period | 2020-2025 |
| Growth Rate | CAGR of 8.15% from 2020-2034 |
| Segmentation |
|
Table of Contents
- 1. Introduction
- 1.1. Research Scope
- 1.2. Market Segmentation
- 1.3. Research Objective
- 1.4. Definitions and Assumptions
- 2. Executive Summary
- 2.1. Market Snapshot
- 3. Market Dynamics
- 3.1. Market Drivers
- 3.2. Market Restrains
- 3.3. Market Trends
- 3.4. Market Opportunities
- 4. Market Factor Analysis
- 4.1. Porters Five Forces
- 4.1.1. Bargaining Power of Suppliers
- 4.1.2. Bargaining Power of Buyers
- 4.1.3. Threat of New Entrants
- 4.1.4. Threat of Substitutes
- 4.1.5. Competitive Rivalry
- 4.2. PESTEL analysis
- 4.3. BCG Analysis
- 4.3.1. Stars (High Growth, High Market Share)
- 4.3.2. Cash Cows (Low Growth, High Market Share)
- 4.3.3. Question Mark (High Growth, Low Market Share)
- 4.3.4. Dogs (Low Growth, Low Market Share)
- 4.4. Ansoff Matrix Analysis
- 4.5. Supply Chain Analysis
- 4.6. Regulatory Landscape
- 4.7. Current Market Potential and Opportunity Assessment (TAM–SAM–SOM Framework)
- 4.8. DMV Analyst Note
- 4.1. Porters Five Forces
- 5. Market Analysis, Insights and Forecast 2021-2033
- 5.1. Market Analysis, Insights and Forecast - by Type
- 5.1.1. Still Water
- 5.1.2. Sparkling Water
- 5.1.3. Functional Water
- 5.2. Market Analysis, Insights and Forecast - by Distribution Channel
- 5.2.1. Supermarkets/Hypermarkets
- 5.2.2. Convenience Stores
- 5.2.3. Online Retailers
- 5.2.4. On-trade
- 5.2.5. Other Distribution Channels
- 5.3. Market Analysis, Insights and Forecast - by Region
- 5.3.1. North America
- 5.3.2. South America
- 5.3.3. Europe
- 5.3.4. Middle East & Africa
- 5.3.5. Asia Pacific
- 5.1. Market Analysis, Insights and Forecast - by Type
- 6. Global Sparkling Water Market Analysis, Insights and Forecast, 2021-2033
- 6.1. Market Analysis, Insights and Forecast - by Type
- 6.1.1. Still Water
- 6.1.2. Sparkling Water
- 6.1.3. Functional Water
- 6.2. Market Analysis, Insights and Forecast - by Distribution Channel
- 6.2.1. Supermarkets/Hypermarkets
- 6.2.2. Convenience Stores
- 6.2.3. Online Retailers
- 6.2.4. On-trade
- 6.2.5. Other Distribution Channels
- 6.1. Market Analysis, Insights and Forecast - by Type
- 7. North America Sparkling Water Market Analysis, Insights and Forecast, 2020-2032
- 7.1. Market Analysis, Insights and Forecast - by Type
- 7.1.1. Still Water
- 7.1.2. Sparkling Water
- 7.1.3. Functional Water
- 7.2. Market Analysis, Insights and Forecast - by Distribution Channel
- 7.2.1. Supermarkets/Hypermarkets
- 7.2.2. Convenience Stores
- 7.2.3. Online Retailers
- 7.2.4. On-trade
- 7.2.5. Other Distribution Channels
- 7.1. Market Analysis, Insights and Forecast - by Type
- 8. South America Sparkling Water Market Analysis, Insights and Forecast, 2020-2032
- 8.1. Market Analysis, Insights and Forecast - by Type
- 8.1.1. Still Water
- 8.1.2. Sparkling Water
- 8.1.3. Functional Water
- 8.2. Market Analysis, Insights and Forecast - by Distribution Channel
- 8.2.1. Supermarkets/Hypermarkets
- 8.2.2. Convenience Stores
- 8.2.3. Online Retailers
- 8.2.4. On-trade
- 8.2.5. Other Distribution Channels
- 8.1. Market Analysis, Insights and Forecast - by Type
- 9. Europe Sparkling Water Market Analysis, Insights and Forecast, 2020-2032
- 9.1. Market Analysis, Insights and Forecast - by Type
- 9.1.1. Still Water
- 9.1.2. Sparkling Water
- 9.1.3. Functional Water
- 9.2. Market Analysis, Insights and Forecast - by Distribution Channel
- 9.2.1. Supermarkets/Hypermarkets
- 9.2.2. Convenience Stores
- 9.2.3. Online Retailers
- 9.2.4. On-trade
- 9.2.5. Other Distribution Channels
- 9.1. Market Analysis, Insights and Forecast - by Type
- 10. Middle East & Africa Sparkling Water Market Analysis, Insights and Forecast, 2020-2032
- 10.1. Market Analysis, Insights and Forecast - by Type
- 10.1.1. Still Water
- 10.1.2. Sparkling Water
- 10.1.3. Functional Water
- 10.2. Market Analysis, Insights and Forecast - by Distribution Channel
- 10.2.1. Supermarkets/Hypermarkets
- 10.2.2. Convenience Stores
- 10.2.3. Online Retailers
- 10.2.4. On-trade
- 10.2.5. Other Distribution Channels
- 10.1. Market Analysis, Insights and Forecast - by Type
- 11. Asia Pacific Sparkling Water Market Analysis, Insights and Forecast, 2020-2032
- 11.1. Market Analysis, Insights and Forecast - by Type
- 11.1.1. Still Water
- 11.1.2. Sparkling Water
- 11.1.3. Functional Water
- 11.2. Market Analysis, Insights and Forecast - by Distribution Channel
- 11.2.1. Supermarkets/Hypermarkets
- 11.2.2. Convenience Stores
- 11.2.3. Online Retailers
- 11.2.4. On-trade
- 11.2.5. Other Distribution Channels
- 11.1. Market Analysis, Insights and Forecast - by Type
- 12. Competitive Analysis
- 12.1. Company Profiles
- 12.1.1 Nestle SA
- 12.1.1.1. Company Overview
- 12.1.1.2. Products
- 12.1.1.3. Company Financials
- 12.1.1.4. SWOT Analysis
- 12.1.2 Promag
- 12.1.2.1. Company Overview
- 12.1.2.2. Products
- 12.1.2.3. Company Financials
- 12.1.2.4. SWOT Analysis
- 12.1.3 Asahi Group Holdings Ltd
- 12.1.3.1. Company Overview
- 12.1.3.2. Products
- 12.1.3.3. Company Financials
- 12.1.3.4. SWOT Analysis
- 12.1.4 PT INDOFOOD SUKSES MAKMUR Tbk
- 12.1.4.1. Company Overview
- 12.1.4.2. Products
- 12.1.4.3. Company Financials
- 12.1.4.4. SWOT Analysis
- 12.1.5 Tanobel Food
- 12.1.5.1. Company Overview
- 12.1.5.2. Products
- 12.1.5.3. Company Financials
- 12.1.5.4. SWOT Analysis
- 12.1.6 Fraser and Neave Limited
- 12.1.6.1. Company Overview
- 12.1.6.2. Products
- 12.1.6.3. Company Financials
- 12.1.6.4. SWOT Analysis
- 12.1.7 Danone S A
- 12.1.7.1. Company Overview
- 12.1.7.2. Products
- 12.1.7.3. Company Financials
- 12.1.7.4. SWOT Analysis
- 12.1.8 Blue Band
- 12.1.8.1. Company Overview
- 12.1.8.2. Products
- 12.1.8.3. Company Financials
- 12.1.8.4. SWOT Analysis
- 12.1.9 The Coca-Cola Company
- 12.1.9.1. Company Overview
- 12.1.9.2. Products
- 12.1.9.3. Company Financials
- 12.1.9.4. SWOT Analysis
- 12.1.10 Indo Food
- 12.1.10.1. Company Overview
- 12.1.10.2. Products
- 12.1.10.3. Company Financials
- 12.1.10.4. SWOT Analysis
- 12.1.11 Kosme Group*List Not Exhaustive
- 12.1.11.1. Company Overview
- 12.1.11.2. Products
- 12.1.11.3. Company Financials
- 12.1.11.4. SWOT Analysis
- 12.1.1 Nestle SA
- 12.2. Market Entropy
- 12.2.1 Company's Key Areas Served
- 12.2.2 Recent Developments
- 12.3. Company Market Share Analysis 2025
- 12.3.1 Top 5 Companies Market Share Analysis
- 12.3.2 Top 3 Companies Market Share Analysis
- 12.4. List of Potential Customers
- 13. Research Methodology
List of Figures
- Figure 1: Global Sparkling Water Market Revenue Breakdown (Million, %) by Region 2025 & 2033
- Figure 2: Global Sparkling Water Market Volume Breakdown (liter , %) by Region 2025 & 2033
- Figure 3: North America Sparkling Water Market Revenue (Million), by Type 2025 & 2033
- Figure 4: North America Sparkling Water Market Volume (liter ), by Type 2025 & 2033
- Figure 5: North America Sparkling Water Market Revenue Share (%), by Type 2025 & 2033
- Figure 6: North America Sparkling Water Market Volume Share (%), by Type 2025 & 2033
- Figure 7: North America Sparkling Water Market Revenue (Million), by Distribution Channel 2025 & 2033
- Figure 8: North America Sparkling Water Market Volume (liter ), by Distribution Channel 2025 & 2033
- Figure 9: North America Sparkling Water Market Revenue Share (%), by Distribution Channel 2025 & 2033
- Figure 10: North America Sparkling Water Market Volume Share (%), by Distribution Channel 2025 & 2033
- Figure 11: North America Sparkling Water Market Revenue (Million), by Country 2025 & 2033
- Figure 12: North America Sparkling Water Market Volume (liter ), by Country 2025 & 2033
- Figure 13: North America Sparkling Water Market Revenue Share (%), by Country 2025 & 2033
- Figure 14: North America Sparkling Water Market Volume Share (%), by Country 2025 & 2033
- Figure 15: South America Sparkling Water Market Revenue (Million), by Type 2025 & 2033
- Figure 16: South America Sparkling Water Market Volume (liter ), by Type 2025 & 2033
- Figure 17: South America Sparkling Water Market Revenue Share (%), by Type 2025 & 2033
- Figure 18: South America Sparkling Water Market Volume Share (%), by Type 2025 & 2033
- Figure 19: South America Sparkling Water Market Revenue (Million), by Distribution Channel 2025 & 2033
- Figure 20: South America Sparkling Water Market Volume (liter ), by Distribution Channel 2025 & 2033
- Figure 21: South America Sparkling Water Market Revenue Share (%), by Distribution Channel 2025 & 2033
- Figure 22: South America Sparkling Water Market Volume Share (%), by Distribution Channel 2025 & 2033
- Figure 23: South America Sparkling Water Market Revenue (Million), by Country 2025 & 2033
- Figure 24: South America Sparkling Water Market Volume (liter ), by Country 2025 & 2033
- Figure 25: South America Sparkling Water Market Revenue Share (%), by Country 2025 & 2033
- Figure 26: South America Sparkling Water Market Volume Share (%), by Country 2025 & 2033
- Figure 27: Europe Sparkling Water Market Revenue (Million), by Type 2025 & 2033
- Figure 28: Europe Sparkling Water Market Volume (liter ), by Type 2025 & 2033
- Figure 29: Europe Sparkling Water Market Revenue Share (%), by Type 2025 & 2033
- Figure 30: Europe Sparkling Water Market Volume Share (%), by Type 2025 & 2033
- Figure 31: Europe Sparkling Water Market Revenue (Million), by Distribution Channel 2025 & 2033
- Figure 32: Europe Sparkling Water Market Volume (liter ), by Distribution Channel 2025 & 2033
- Figure 33: Europe Sparkling Water Market Revenue Share (%), by Distribution Channel 2025 & 2033
- Figure 34: Europe Sparkling Water Market Volume Share (%), by Distribution Channel 2025 & 2033
- Figure 35: Europe Sparkling Water Market Revenue (Million), by Country 2025 & 2033
- Figure 36: Europe Sparkling Water Market Volume (liter ), by Country 2025 & 2033
- Figure 37: Europe Sparkling Water Market Revenue Share (%), by Country 2025 & 2033
- Figure 38: Europe Sparkling Water Market Volume Share (%), by Country 2025 & 2033
- Figure 39: Middle East & Africa Sparkling Water Market Revenue (Million), by Type 2025 & 2033
- Figure 40: Middle East & Africa Sparkling Water Market Volume (liter ), by Type 2025 & 2033
- Figure 41: Middle East & Africa Sparkling Water Market Revenue Share (%), by Type 2025 & 2033
- Figure 42: Middle East & Africa Sparkling Water Market Volume Share (%), by Type 2025 & 2033
- Figure 43: Middle East & Africa Sparkling Water Market Revenue (Million), by Distribution Channel 2025 & 2033
- Figure 44: Middle East & Africa Sparkling Water Market Volume (liter ), by Distribution Channel 2025 & 2033
- Figure 45: Middle East & Africa Sparkling Water Market Revenue Share (%), by Distribution Channel 2025 & 2033
- Figure 46: Middle East & Africa Sparkling Water Market Volume Share (%), by Distribution Channel 2025 & 2033
- Figure 47: Middle East & Africa Sparkling Water Market Revenue (Million), by Country 2025 & 2033
- Figure 48: Middle East & Africa Sparkling Water Market Volume (liter ), by Country 2025 & 2033
- Figure 49: Middle East & Africa Sparkling Water Market Revenue Share (%), by Country 2025 & 2033
- Figure 50: Middle East & Africa Sparkling Water Market Volume Share (%), by Country 2025 & 2033
- Figure 51: Asia Pacific Sparkling Water Market Revenue (Million), by Type 2025 & 2033
- Figure 52: Asia Pacific Sparkling Water Market Volume (liter ), by Type 2025 & 2033
- Figure 53: Asia Pacific Sparkling Water Market Revenue Share (%), by Type 2025 & 2033
- Figure 54: Asia Pacific Sparkling Water Market Volume Share (%), by Type 2025 & 2033
- Figure 55: Asia Pacific Sparkling Water Market Revenue (Million), by Distribution Channel 2025 & 2033
- Figure 56: Asia Pacific Sparkling Water Market Volume (liter ), by Distribution Channel 2025 & 2033
- Figure 57: Asia Pacific Sparkling Water Market Revenue Share (%), by Distribution Channel 2025 & 2033
- Figure 58: Asia Pacific Sparkling Water Market Volume Share (%), by Distribution Channel 2025 & 2033
- Figure 59: Asia Pacific Sparkling Water Market Revenue (Million), by Country 2025 & 2033
- Figure 60: Asia Pacific Sparkling Water Market Volume (liter ), by Country 2025 & 2033
- Figure 61: Asia Pacific Sparkling Water Market Revenue Share (%), by Country 2025 & 2033
- Figure 62: Asia Pacific Sparkling Water Market Volume Share (%), by Country 2025 & 2033
List of Tables
- Table 1: Global Sparkling Water Market Revenue Million Forecast, by Type 2020 & 2033
- Table 2: Global Sparkling Water Market Volume liter Forecast, by Type 2020 & 2033
- Table 3: Global Sparkling Water Market Revenue Million Forecast, by Distribution Channel 2020 & 2033
- Table 4: Global Sparkling Water Market Volume liter Forecast, by Distribution Channel 2020 & 2033
- Table 5: Global Sparkling Water Market Revenue Million Forecast, by Region 2020 & 2033
- Table 6: Global Sparkling Water Market Volume liter Forecast, by Region 2020 & 2033
- Table 7: Global Sparkling Water Market Revenue Million Forecast, by Type 2020 & 2033
- Table 8: Global Sparkling Water Market Volume liter Forecast, by Type 2020 & 2033
- Table 9: Global Sparkling Water Market Revenue Million Forecast, by Distribution Channel 2020 & 2033
- Table 10: Global Sparkling Water Market Volume liter Forecast, by Distribution Channel 2020 & 2033
- Table 11: Global Sparkling Water Market Revenue Million Forecast, by Country 2020 & 2033
- Table 12: Global Sparkling Water Market Volume liter Forecast, by Country 2020 & 2033
- Table 13: United States Sparkling Water Market Revenue (Million) Forecast, by Application 2020 & 2033
- Table 14: United States Sparkling Water Market Volume (liter ) Forecast, by Application 2020 & 2033
- Table 15: Canada Sparkling Water Market Revenue (Million) Forecast, by Application 2020 & 2033
- Table 16: Canada Sparkling Water Market Volume (liter ) Forecast, by Application 2020 & 2033
- Table 17: Mexico Sparkling Water Market Revenue (Million) Forecast, by Application 2020 & 2033
- Table 18: Mexico Sparkling Water Market Volume (liter ) Forecast, by Application 2020 & 2033
- Table 19: Global Sparkling Water Market Revenue Million Forecast, by Type 2020 & 2033
- Table 20: Global Sparkling Water Market Volume liter Forecast, by Type 2020 & 2033
- Table 21: Global Sparkling Water Market Revenue Million Forecast, by Distribution Channel 2020 & 2033
- Table 22: Global Sparkling Water Market Volume liter Forecast, by Distribution Channel 2020 & 2033
- Table 23: Global Sparkling Water Market Revenue Million Forecast, by Country 2020 & 2033
- Table 24: Global Sparkling Water Market Volume liter Forecast, by Country 2020 & 2033
- Table 25: Brazil Sparkling Water Market Revenue (Million) Forecast, by Application 2020 & 2033
- Table 26: Brazil Sparkling Water Market Volume (liter ) Forecast, by Application 2020 & 2033
- Table 27: Argentina Sparkling Water Market Revenue (Million) Forecast, by Application 2020 & 2033
- Table 28: Argentina Sparkling Water Market Volume (liter ) Forecast, by Application 2020 & 2033
- Table 29: Rest of South America Sparkling Water Market Revenue (Million) Forecast, by Application 2020 & 2033
- Table 30: Rest of South America Sparkling Water Market Volume (liter ) Forecast, by Application 2020 & 2033
- Table 31: Global Sparkling Water Market Revenue Million Forecast, by Type 2020 & 2033
- Table 32: Global Sparkling Water Market Volume liter Forecast, by Type 2020 & 2033
- Table 33: Global Sparkling Water Market Revenue Million Forecast, by Distribution Channel 2020 & 2033
- Table 34: Global Sparkling Water Market Volume liter Forecast, by Distribution Channel 2020 & 2033
- Table 35: Global Sparkling Water Market Revenue Million Forecast, by Country 2020 & 2033
- Table 36: Global Sparkling Water Market Volume liter Forecast, by Country 2020 & 2033
- Table 37: United Kingdom Sparkling Water Market Revenue (Million) Forecast, by Application 2020 & 2033
- Table 38: United Kingdom Sparkling Water Market Volume (liter ) Forecast, by Application 2020 & 2033
- Table 39: Germany Sparkling Water Market Revenue (Million) Forecast, by Application 2020 & 2033
- Table 40: Germany Sparkling Water Market Volume (liter ) Forecast, by Application 2020 & 2033
- Table 41: France Sparkling Water Market Revenue (Million) Forecast, by Application 2020 & 2033
- Table 42: France Sparkling Water Market Volume (liter ) Forecast, by Application 2020 & 2033
- Table 43: Italy Sparkling Water Market Revenue (Million) Forecast, by Application 2020 & 2033
- Table 44: Italy Sparkling Water Market Volume (liter ) Forecast, by Application 2020 & 2033
- Table 45: Spain Sparkling Water Market Revenue (Million) Forecast, by Application 2020 & 2033
- Table 46: Spain Sparkling Water Market Volume (liter ) Forecast, by Application 2020 & 2033
- Table 47: Russia Sparkling Water Market Revenue (Million) Forecast, by Application 2020 & 2033
- Table 48: Russia Sparkling Water Market Volume (liter ) Forecast, by Application 2020 & 2033
- Table 49: Benelux Sparkling Water Market Revenue (Million) Forecast, by Application 2020 & 2033
- Table 50: Benelux Sparkling Water Market Volume (liter ) Forecast, by Application 2020 & 2033
- Table 51: Nordics Sparkling Water Market Revenue (Million) Forecast, by Application 2020 & 2033
- Table 52: Nordics Sparkling Water Market Volume (liter ) Forecast, by Application 2020 & 2033
- Table 53: Rest of Europe Sparkling Water Market Revenue (Million) Forecast, by Application 2020 & 2033
- Table 54: Rest of Europe Sparkling Water Market Volume (liter ) Forecast, by Application 2020 & 2033
- Table 55: Global Sparkling Water Market Revenue Million Forecast, by Type 2020 & 2033
- Table 56: Global Sparkling Water Market Volume liter Forecast, by Type 2020 & 2033
- Table 57: Global Sparkling Water Market Revenue Million Forecast, by Distribution Channel 2020 & 2033
- Table 58: Global Sparkling Water Market Volume liter Forecast, by Distribution Channel 2020 & 2033
- Table 59: Global Sparkling Water Market Revenue Million Forecast, by Country 2020 & 2033
- Table 60: Global Sparkling Water Market Volume liter Forecast, by Country 2020 & 2033
- Table 61: Turkey Sparkling Water Market Revenue (Million) Forecast, by Application 2020 & 2033
- Table 62: Turkey Sparkling Water Market Volume (liter ) Forecast, by Application 2020 & 2033
- Table 63: Israel Sparkling Water Market Revenue (Million) Forecast, by Application 2020 & 2033
- Table 64: Israel Sparkling Water Market Volume (liter ) Forecast, by Application 2020 & 2033
- Table 65: GCC Sparkling Water Market Revenue (Million) Forecast, by Application 2020 & 2033
- Table 66: GCC Sparkling Water Market Volume (liter ) Forecast, by Application 2020 & 2033
- Table 67: North Africa Sparkling Water Market Revenue (Million) Forecast, by Application 2020 & 2033
- Table 68: North Africa Sparkling Water Market Volume (liter ) Forecast, by Application 2020 & 2033
- Table 69: South Africa Sparkling Water Market Revenue (Million) Forecast, by Application 2020 & 2033
- Table 70: South Africa Sparkling Water Market Volume (liter ) Forecast, by Application 2020 & 2033
- Table 71: Rest of Middle East & Africa Sparkling Water Market Revenue (Million) Forecast, by Application 2020 & 2033
- Table 72: Rest of Middle East & Africa Sparkling Water Market Volume (liter ) Forecast, by Application 2020 & 2033
- Table 73: Global Sparkling Water Market Revenue Million Forecast, by Type 2020 & 2033
- Table 74: Global Sparkling Water Market Volume liter Forecast, by Type 2020 & 2033
- Table 75: Global Sparkling Water Market Revenue Million Forecast, by Distribution Channel 2020 & 2033
- Table 76: Global Sparkling Water Market Volume liter Forecast, by Distribution Channel 2020 & 2033
- Table 77: Global Sparkling Water Market Revenue Million Forecast, by Country 2020 & 2033
- Table 78: Global Sparkling Water Market Volume liter Forecast, by Country 2020 & 2033
- Table 79: China Sparkling Water Market Revenue (Million) Forecast, by Application 2020 & 2033
- Table 80: China Sparkling Water Market Volume (liter ) Forecast, by Application 2020 & 2033
- Table 81: India Sparkling Water Market Revenue (Million) Forecast, by Application 2020 & 2033
- Table 82: India Sparkling Water Market Volume (liter ) Forecast, by Application 2020 & 2033
- Table 83: Japan Sparkling Water Market Revenue (Million) Forecast, by Application 2020 & 2033
- Table 84: Japan Sparkling Water Market Volume (liter ) Forecast, by Application 2020 & 2033
- Table 85: South Korea Sparkling Water Market Revenue (Million) Forecast, by Application 2020 & 2033
- Table 86: South Korea Sparkling Water Market Volume (liter ) Forecast, by Application 2020 & 2033
- Table 87: ASEAN Sparkling Water Market Revenue (Million) Forecast, by Application 2020 & 2033
- Table 88: ASEAN Sparkling Water Market Volume (liter ) Forecast, by Application 2020 & 2033
- Table 89: Oceania Sparkling Water Market Revenue (Million) Forecast, by Application 2020 & 2033
- Table 90: Oceania Sparkling Water Market Volume (liter ) Forecast, by Application 2020 & 2033
- Table 91: Rest of Asia Pacific Sparkling Water Market Revenue (Million) Forecast, by Application 2020 & 2033
- Table 92: Rest of Asia Pacific Sparkling Water Market Volume (liter ) Forecast, by Application 2020 & 2033
Frequently Asked Questions
1. What is the projected Compound Annual Growth Rate (CAGR) of the Sparkling Water Market?
The projected CAGR is approximately 8.15%.
2. Which companies are prominent players in the Sparkling Water Market?
Key companies in the market include Nestle SA, Promag, Asahi Group Holdings Ltd, PT INDOFOOD SUKSES MAKMUR Tbk, Tanobel Food, Fraser and Neave Limited, Danone S A, Blue Band, The Coca-Cola Company, Indo Food, Kosme Group*List Not Exhaustive.
3. What are the main segments of the Sparkling Water Market?
The market segments include Type, Distribution Channel.
4. Can you provide details about the market size?
The market size is estimated to be USD 32740 Million as of 2022.
5. What are some drivers contributing to market growth?
Increasing Demand for Alcoholic Beverages; Health Conscious Consumers Accelerating Demand For Gluten-free Beer.
6. What are the notable trends driving market growth?
Increasing Expenditure on Drinking Water Due to Lack of Safe Drinking Water Availability.
7. Are there any restraints impacting market growth?
Threat From Other Alcoholic Beverages.
8. Can you provide examples of recent developments in the market?
August 2022: Kosme Group has launched Jiwater in Indonesia. Jiwater is natural artesian water that has undergone Japanese technological processing. The pH range of the new mineral water is between 7.5 and 8.
9. What pricing options are available for accessing the report?
Pricing options include single-user, multi-user, and enterprise licenses priced at USD 3800, USD 4500, and USD 5800 respectively.
10. Is the market size provided in terms of value or volume?
The market size is provided in terms of value, measured in Million and volume, measured in liter .
11. Are there any specific market keywords associated with the report?
Yes, the market keyword associated with the report is "Sparkling Water Market," which aids in identifying and referencing the specific market segment covered.
12. How do I determine which pricing option suits my needs best?
The pricing options vary based on user requirements and access needs. Individual users may opt for single-user licenses, while businesses requiring broader access may choose multi-user or enterprise licenses for cost-effective access to the report.
13. Are there any additional resources or data provided in the Sparkling Water Market report?
While the report offers comprehensive insights, it's advisable to review the specific contents or supplementary materials provided to ascertain if additional resources or data are available.
14. How can I stay updated on further developments or reports in the Sparkling Water Market?
To stay informed about further developments, trends, and reports in the Sparkling Water Market, consider subscribing to industry newsletters, following relevant companies and organizations, or regularly checking reputable industry news sources and publications.
Methodology
Step 1 - Identification of Relevant Samples Size from Population Database


Step 2 - Approaches for Defining Global Market Size (Value, Volume* & Price*)

Note*: In applicable scenarios
Step 3 - Data Sources
Primary Research
- Web Analytics
- Survey Reports
- Research Institute
- Latest Research Reports
- Opinion Leaders
Secondary Research
- Annual Reports
- White Paper
- Latest Press Release
- Industry Association
- Paid Database
- Investor Presentations

Step 4 - Data Triangulation
Involves using different sources of information in order to increase the validity of a study
These sources are likely to be stakeholders in a program - participants, other researchers, program staff, other community members, and so on.
Then we put all data in single framework & apply various statistical tools to find out the dynamic on the market.
During the analysis stage, feedback from the stakeholder groups would be compared to determine areas of agreement as well as areas of divergence