

Key Insights
The global Releasing Agent market is poised for significant expansion, projected to reach $405 million by 2025. This growth is fueled by a robust Compound Annual Growth Rate (CAGR) of 4.4% from 2019 to 2033, indicating a healthy and sustained upward trajectory. Key drivers for this market expansion include the increasing demand for processed foods, particularly in the bakery and confectionery sectors, where releasing agents are crucial for efficient production and product quality. The rising consumption of meat products also contributes to this demand, as these agents prevent sticking during processing and packaging. Furthermore, advancements in emulsifier and antioxidant technologies are leading to more effective and specialized releasing agents, further stimulating market growth. Emerging economies, especially in the Asia Pacific region, are becoming increasingly important markets due to rapid urbanization and a growing middle class with a higher disposable income for processed food consumption.
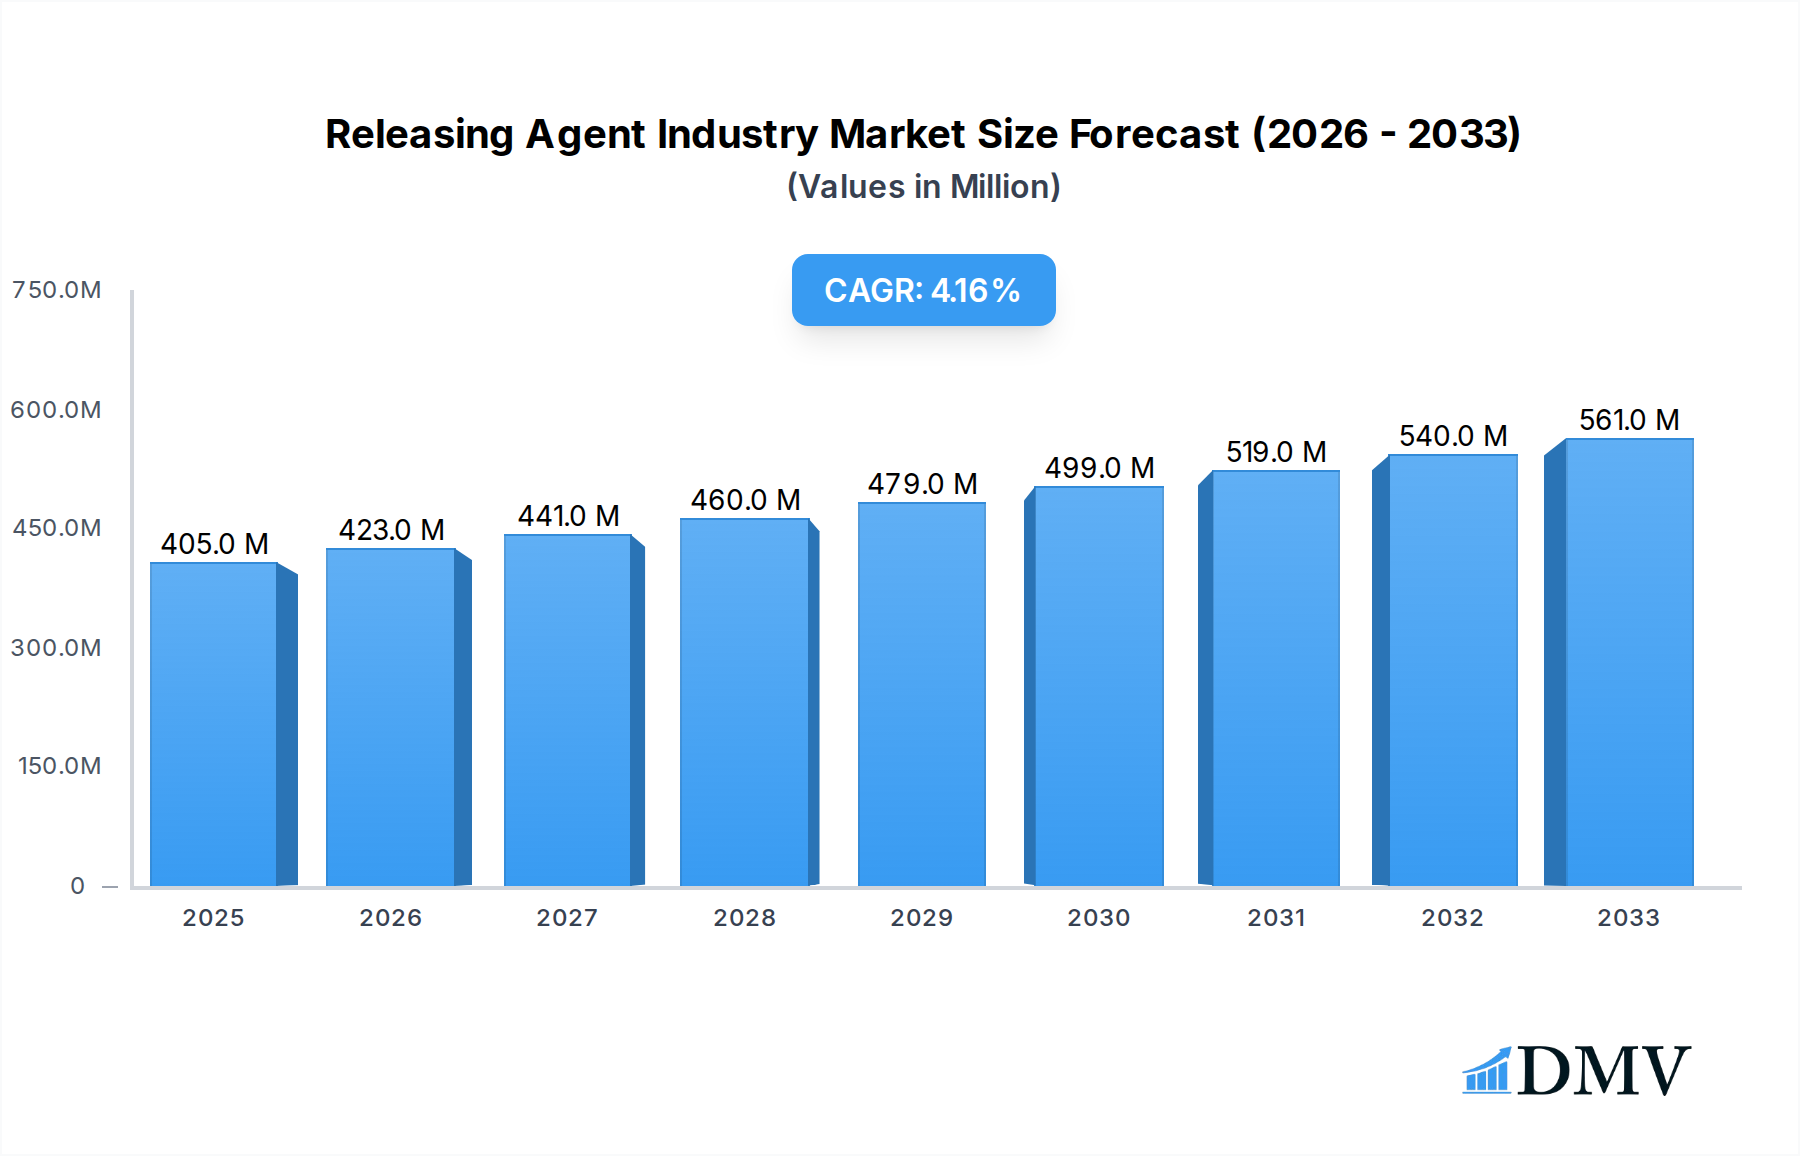
Releasing Agent Industry Market Size (In Million)
The market is characterized by a diverse range of applications, from delicate pastries to processed meats, highlighting the versatility of releasing agents. The solid form segment, particularly waxes and wax esters, is expected to see considerable traction due to their efficacy in demanding applications. However, the market also faces certain restraints, including the fluctuating prices of raw materials like vegetable oils and the increasing regulatory scrutiny regarding food additives. Nonetheless, the overall outlook remains positive, with major players like Cargill Incorporated, IFC Solutions Inc., and Archer Daniels Midland Company investing in research and development to innovate and cater to evolving consumer preferences and industry standards. The market's dynamic nature, coupled with continuous innovation, suggests a promising future for the releasing agent industry.

Releasing Agent Industry Company Market Share
Releasing Agent Industry Market Composition & Trends
The global releasing agent industry is experiencing dynamic shifts, driven by increasing demand for efficient food processing and the development of advanced formulations. Market concentration remains moderate, with a mix of large multinational corporations and specialized regional players. Innovation is a key catalyst, with companies actively investing in R&D to develop novel food-grade releasing agents with improved performance, shelf-life extension, and suitability for diverse applications. The regulatory landscape is evolving, with a growing emphasis on food safety standards and the approval of new ingredients, particularly for bakery and confectionery applications. Substitute products, such as higher oil content in dough or enhanced non-stick cookware, pose a potential threat, but the superior efficacy and cost-effectiveness of dedicated releasing agents continue to drive market adoption. End-user profiles are diversifying, extending beyond traditional bakery and confectionery to include meat and meat products, processed foods, and even industrial applications. Mergers and acquisitions (M&A) activities are on the rise as key players seek to expand their product portfolios, geographical reach, and technological capabilities. In the historical period of 2019-2024, M&A deal values are estimated to have reached over $500 million. This consolidation is reshaping the competitive landscape and fostering greater integration within the supply chain. The market share distribution reveals that emulsifiers and vegetable oils represent a significant portion of the releasing agent market, accounting for approximately 60% of the total market value in 2025, with a projected market size of over $7,000 million.
Releasing Agent Industry Industry Evolution
The releasing agent industry has witnessed a remarkable evolution from 2019 to 2033, driven by continuous innovation, shifting consumer preferences, and advancements in food processing technologies. The historical period (2019-2024) saw steady growth, with the market size expanding from an estimated $5,500 million in 2019 to over $6,500 million by 2024. This growth was primarily fueled by the increasing demand for processed and convenience foods, which rely heavily on effective releasing agents to ensure smooth production and appealing final products. Technological advancements have played a pivotal role in this evolution. The development of emulsifier-based releasing agents and high-performance vegetable oils has significantly improved product consistency, reduced waste, and enhanced the visual appeal of baked goods and confectionery. For instance, the adoption of specialized emulsifiers capable of withstanding high temperatures and varying pH levels has opened up new avenues for their application in complex food manufacturing processes. Furthermore, the exploration of natural and clean-label ingredients has led to the formulation of plant-based releasing agents, catering to the growing consumer demand for healthier and more sustainable food options. This trend is projected to accelerate, with natural releasing agents expected to capture a significant market share by 2033. The base year of 2025 marks a crucial point, with the market size estimated at $7,000 million and projected to grow at a Compound Annual Growth Rate (CAGR) of approximately 5.8% during the forecast period of 2025-2033. This sustained growth trajectory is underpinned by ongoing R&D investments, expanding applications in the meat and meat products sector, and the increasing adoption of these agents in emerging economies. The focus on operational efficiency within food manufacturing facilities also contributes significantly, as effective releasing agents minimize downtime and optimize production cycles. The industry's ability to adapt to evolving food safety regulations and consumer perceptions regarding ingredient transparency will be critical for continued success.
Leading Regions, Countries, or Segments in Releasing Agent Industry
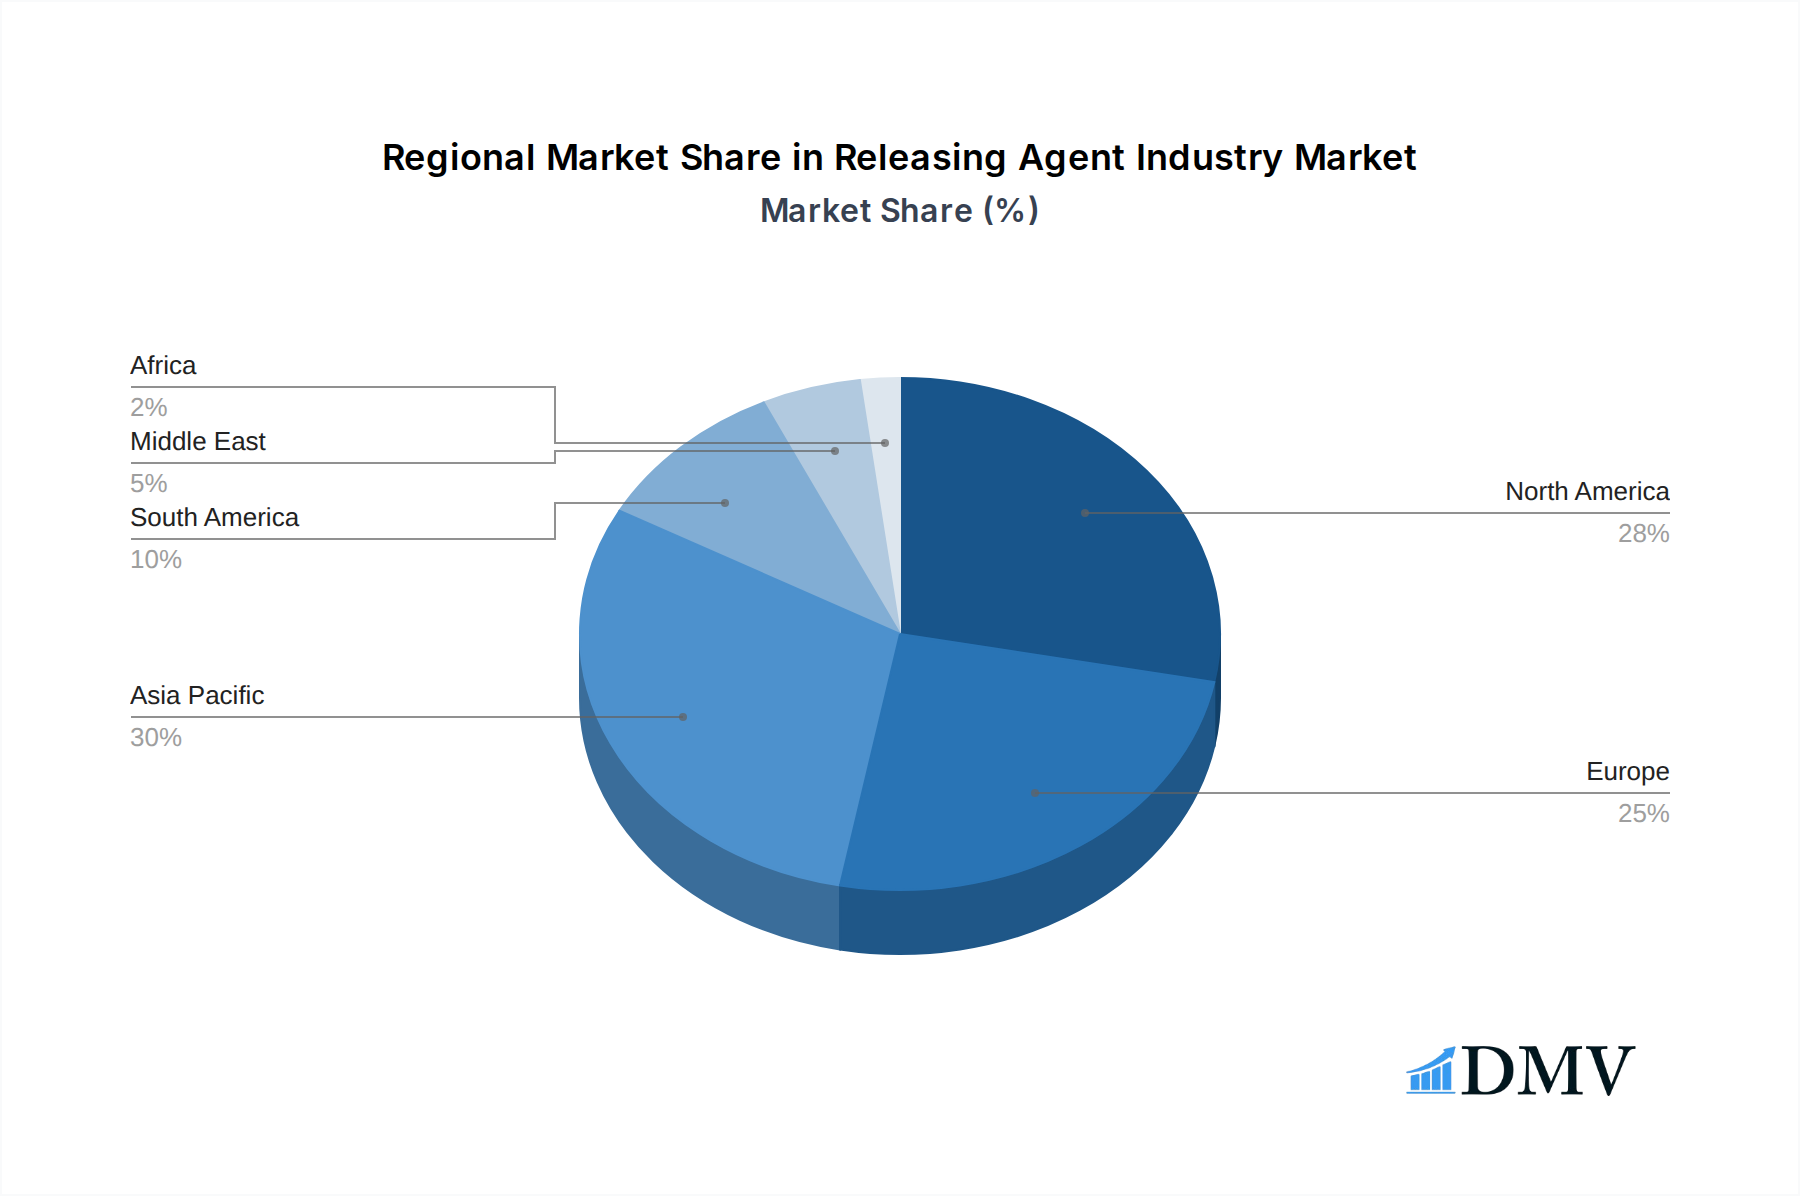
The releasing agent industry exhibits distinct regional dominance and segment leadership, shaped by market maturity, regulatory frameworks, and consumer behavior. North America and Europe currently represent the leading regions, driven by their well-established food processing infrastructure, high per capita consumption of processed foods, and stringent quality control standards. Within these regions, the bakery and confectionery segment is the undisputed leader, accounting for over 65% of the total market value. This dominance is attributed to the extensive use of releasing agents in bread, cakes, pastries, chocolates, and candies to prevent sticking, ensure uniform shaping, and facilitate easy removal from molds and baking surfaces.
North America:
- Key Drivers: High adoption of advanced food processing technologies, strong presence of major food manufacturers, and robust demand for convenience foods. The vegetable oils segment within North America is particularly strong due to the abundant availability of raw materials and established processing capabilities, contributing an estimated $1,500 million to the regional market in 2025.
- Dominance Factors: Advanced R&D capabilities leading to specialized formulations, and a mature market for emulsifier-based releasing agents.
Europe:
- Key Drivers: Stringent food safety regulations that promote the use of approved and high-quality releasing agents, coupled with a deep-rooted tradition in baking and confectionery. The solid form releasing agents, often wax-based, have a significant share in European markets due to their ease of handling and application in industrial settings.
- Dominance Factors: Consumer preference for premium and aesthetically pleasing baked goods, requiring high-performance releasing agents.
Asia Pacific:
- Key Drivers: Rapidly growing food processing industry, increasing disposable incomes, and a burgeoning middle class driving demand for processed foods. Emerging economies like China and India are witnessing substantial growth in their bakery and confectionery sectors.
- Dominance Factors: Growing awareness of food safety and production efficiency, leading to increased adoption of specialized releasing agents. The other applications segment, encompassing snacks and ready-to-eat meals, is also gaining traction.
Composition Segment Dominance:
- Emulsifiers: Lead due to their versatility in preventing adhesion and improving texture in baked goods. Their estimated market share in 2025 is over $2,800 million.
- Vegetable Oils: Significant share due to their natural origin and cost-effectiveness, widely used in various food applications.
- Wax and Wax Esters: Crucial for applications requiring high-temperature stability and superior non-stick properties, particularly in confectionery molding.
Application Segment Dominance:
- Bakery and Confectionery: Continues to be the largest application segment, with estimated market share of over $4,500 million in 2025.
- Meat and Meat Products: A growing segment, utilizing releasing agents in processed meats and sausages to prevent sticking to processing equipment and packaging.
Form Segment Dominance:
- Liquid Form: Dominates due to ease of application, particularly in spray systems for large-scale production.
- Solid Form: Gains traction in specific confectionery and bakery applications where precise application is required.
Releasing Agent Industry Product Innovations
Product innovation in the releasing agent industry is laser-focused on enhancing performance, improving sustainability, and catering to evolving consumer demands for healthier options. Recent advancements include the development of nano-emulsifier releasing agents that offer superior non-stick properties with significantly lower application rates, reducing overall cost and environmental impact. These next-generation agents exhibit exceptional thermal stability, crucial for high-temperature baking and frying processes. Furthermore, there's a significant push towards clean-label and allergen-free releasing agents, formulated from natural sources like sunflower oil or specialized starches, meeting the stringent requirements of health-conscious consumers and mitigating allergen cross-contamination concerns. Performance metrics such as adhesion reduction, mold release efficiency, and surface finish quality are continuously being optimized, with new formulations demonstrating up to 15% improvement in release ease compared to conventional agents.
Propelling Factors for Releasing Agent Industry Growth
Several key factors are propelling the releasing agent industry forward. The escalating demand for processed and convenience foods globally, particularly in emerging economies, necessitates efficient food manufacturing processes where releasing agents play a crucial role. Technological advancements in food-grade releasing agents, such as the development of high-stability emulsifiers and plant-based alternatives, are expanding their application scope and improving performance. Stringent food safety regulations are also indirectly driving growth, as manufacturers are compelled to use approved and reliable releasing agents to ensure product integrity and compliance. Moreover, increasing automation in food production lines favors the adoption of liquid and sprayable releasing agents for seamless integration. The projected market size for 2025 is estimated at $7,000 million, with significant growth anticipated.
Obstacles in the Releasing Agent Industry Market
Despite robust growth, the releasing agent industry faces certain obstacles. Volatility in the prices of key raw materials, such as vegetable oils and specialized emulsifiers, can impact profit margins and increase manufacturing costs. Stringent regulatory approvals for novel ingredients in different regions can lead to lengthy development cycles and market entry delays. Intense competition from both established players and emerging manufacturers can lead to price pressures and a need for continuous innovation to maintain market share. Furthermore, the potential for developing in-house alternatives by large food manufacturers or reliance on naturally non-stick ingredients in certain food formulations can present substitute threats. Supply chain disruptions, exacerbated by geopolitical events or natural disasters, can also hinder the consistent availability of essential raw materials.
Future Opportunities in Releasing Agent Industry
The releasing agent industry is poised for significant future opportunities. The growing demand for plant-based and clean-label food products presents a substantial avenue for innovation in natural and sustainable releasing agents, with the vegetable oils segment expected to see strong growth. Expansion into emerging markets in Asia Pacific and Latin America, driven by increasing food processing capabilities and rising consumer spending, offers untapped potential. The development of specialized releasing agents for niche applications, such as high-protein meat alternatives or gluten-free bakery products, will cater to specific market needs. Furthermore, advancements in smart packaging and active release technologies could unlock new functionalities and value-added applications for these essential food processing aids. The forecast period of 2025-2033 is expected to witness a market expansion driven by these trends.
Major Players in the Releasing Agent Industry Ecosystem
- Cargill Incorporated
- IFC Solutions Inc
- Bundy Baking Solutions
- Bunge Limited
- Masterol Foods Pvt Ltd
- Archer Daniels Midland Company
- Lallemand
- The Bakels Group
- Mallet & Company Inc
- Avatar Corporation
Key Developments in Releasing Agent Industry Industry
- 2023/November: IFC Solutions Inc. launched a new line of allergen-free, plant-based releasing agents for the bakery sector, focusing on clean-label trends.
- 2024/March: Bundy Baking Solutions announced a strategic partnership to enhance its distribution network for solid releasing agents in the European confectionery market.
- 2024/July: Lallemand invested in R&D for novel yeast-based releasing agents with improved functionality and extended shelf-life.
- 2024/October: The Bakels Group expanded its product portfolio with the introduction of specialized releasing agents for gluten-free baked goods.
- 2025/January: Archer Daniels Midland Company reported increased production capacity for emulsifiers used in releasing agent formulations, responding to growing market demand.
- 2025/April: Cargill Incorporated unveiled a new sustainable sourcing initiative for vegetable oils used in their releasing agent products.
- 2025/June: Mallet & Company Inc. introduced advanced wax ester formulations for high-temperature industrial baking applications.
Strategic Releasing Agent Industry Market Forecast
The strategic outlook for the releasing agent industry is exceptionally promising, underpinned by a confluence of factors that will drive sustained growth through 2033. The escalating global demand for processed foods, coupled with increasing automation in food manufacturing, creates a perpetual need for efficient and reliable releasing agents. Innovations in emulsifiers, vegetable oils, and wax-based formulations are continuously enhancing product performance, enabling new applications in meat and meat products, and catering to the demand for clean-label and natural ingredients. The market is projected to reach over $10,000 million by 2033, with a robust CAGR of approximately 5.8% from the base year of 2025. Key growth catalysts include the expanding food processing sector in emerging economies and the ongoing development of specialized agents for niche dietary requirements.
Releasing Agent Industry Segmentation
-
1. Composition
- 1.1. Emulsifiers
- 1.2. Antioxidants
- 1.3. vegetable Oils
- 1.4. Wax and Wax Esters
- 1.5. Others
-
2. Application
- 2.1. Bakery and Confectionery
- 2.2. Meat and Meat Products
- 2.3. Other Applications
-
3. Form
- 3.1. Liquid
- 3.2. Solid
Releasing Agent Industry Segmentation By Geography
-
1. North America
- 1.1. United States
- 1.2. Canada
- 1.3. Mexico
- 1.4. Rest of North America
-
2. Europe
- 2.1. Germany
- 2.2. United Kingdom
- 2.3. France
- 2.4. Russia
- 2.5. Spain
- 2.6. Rest of Europe
-
3. Asia Pacific
- 3.1. India
- 3.2. China
- 3.3. Japan
- 3.4. Rest of Asia Pacific
-
4. South America
- 4.1. Brazil
- 4.2. Argentina
- 4.3. Rest of South America
- 5. Middle East
-
6. United Arab Emirates
- 6.1. South Africa
- 6.2. Rest of Middle East
Releasing Agent Industry Regional Market Share
Geographic Coverage of Releasing Agent Industry
Releasing Agent Industry REPORT HIGHLIGHTS
| Aspects | Details |
|---|---|
| Study Period | 2020-2034 |
| Base Year | 2025 |
| Estimated Year | 2026 |
| Forecast Period | 2026-2034 |
| Historical Period | 2020-2025 |
| Growth Rate | CAGR of 4.4% from 2020-2034 |
| Segmentation |
|
Table of Contents
- 1. Introduction
- 1.1. Research Scope
- 1.2. Market Segmentation
- 1.3. Research Objective
- 1.4. Definitions and Assumptions
- 2. Executive Summary
- 2.1. Market Snapshot
- 3. Market Dynamics
- 3.1. Market Drivers
- 3.2. Market Restrains
- 3.3. Market Trends
- 3.4. Market Opportunities
- 4. Market Factor Analysis
- 4.1. Porters Five Forces
- 4.1.1. Bargaining Power of Suppliers
- 4.1.2. Bargaining Power of Buyers
- 4.1.3. Threat of New Entrants
- 4.1.4. Threat of Substitutes
- 4.1.5. Competitive Rivalry
- 4.2. PESTEL analysis
- 4.3. BCG Analysis
- 4.3.1. Stars (High Growth, High Market Share)
- 4.3.2. Cash Cows (Low Growth, High Market Share)
- 4.3.3. Question Mark (High Growth, Low Market Share)
- 4.3.4. Dogs (Low Growth, Low Market Share)
- 4.4. Ansoff Matrix Analysis
- 4.5. Supply Chain Analysis
- 4.6. Regulatory Landscape
- 4.7. Current Market Potential and Opportunity Assessment (TAM–SAM–SOM Framework)
- 4.8. DMV Analyst Note
- 4.1. Porters Five Forces
- 5. Market Analysis, Insights and Forecast 2021-2033
- 5.1. Market Analysis, Insights and Forecast - by Composition
- 5.1.1. Emulsifiers
- 5.1.2. Antioxidants
- 5.1.3. vegetable Oils
- 5.1.4. Wax and Wax Esters
- 5.1.5. Others
- 5.2. Market Analysis, Insights and Forecast - by Application
- 5.2.1. Bakery and Confectionery
- 5.2.2. Meat and Meat Products
- 5.2.3. Other Applications
- 5.3. Market Analysis, Insights and Forecast - by Form
- 5.3.1. Liquid
- 5.3.2. Solid
- 5.4. Market Analysis, Insights and Forecast - by Region
- 5.4.1. North America
- 5.4.2. Europe
- 5.4.3. Asia Pacific
- 5.4.4. South America
- 5.4.5. Middle East
- 5.4.6. United Arab Emirates
- 5.1. Market Analysis, Insights and Forecast - by Composition
- 6. Global Releasing Agent Industry Analysis, Insights and Forecast, 2021-2033
- 6.1. Market Analysis, Insights and Forecast - by Composition
- 6.1.1. Emulsifiers
- 6.1.2. Antioxidants
- 6.1.3. vegetable Oils
- 6.1.4. Wax and Wax Esters
- 6.1.5. Others
- 6.2. Market Analysis, Insights and Forecast - by Application
- 6.2.1. Bakery and Confectionery
- 6.2.2. Meat and Meat Products
- 6.2.3. Other Applications
- 6.3. Market Analysis, Insights and Forecast - by Form
- 6.3.1. Liquid
- 6.3.2. Solid
- 6.1. Market Analysis, Insights and Forecast - by Composition
- 7. North America Releasing Agent Industry Analysis, Insights and Forecast, 2020-2032
- 7.1. Market Analysis, Insights and Forecast - by Composition
- 7.1.1. Emulsifiers
- 7.1.2. Antioxidants
- 7.1.3. vegetable Oils
- 7.1.4. Wax and Wax Esters
- 7.1.5. Others
- 7.2. Market Analysis, Insights and Forecast - by Application
- 7.2.1. Bakery and Confectionery
- 7.2.2. Meat and Meat Products
- 7.2.3. Other Applications
- 7.3. Market Analysis, Insights and Forecast - by Form
- 7.3.1. Liquid
- 7.3.2. Solid
- 7.1. Market Analysis, Insights and Forecast - by Composition
- 8. Europe Releasing Agent Industry Analysis, Insights and Forecast, 2020-2032
- 8.1. Market Analysis, Insights and Forecast - by Composition
- 8.1.1. Emulsifiers
- 8.1.2. Antioxidants
- 8.1.3. vegetable Oils
- 8.1.4. Wax and Wax Esters
- 8.1.5. Others
- 8.2. Market Analysis, Insights and Forecast - by Application
- 8.2.1. Bakery and Confectionery
- 8.2.2. Meat and Meat Products
- 8.2.3. Other Applications
- 8.3. Market Analysis, Insights and Forecast - by Form
- 8.3.1. Liquid
- 8.3.2. Solid
- 8.1. Market Analysis, Insights and Forecast - by Composition
- 9. Asia Pacific Releasing Agent Industry Analysis, Insights and Forecast, 2020-2032
- 9.1. Market Analysis, Insights and Forecast - by Composition
- 9.1.1. Emulsifiers
- 9.1.2. Antioxidants
- 9.1.3. vegetable Oils
- 9.1.4. Wax and Wax Esters
- 9.1.5. Others
- 9.2. Market Analysis, Insights and Forecast - by Application
- 9.2.1. Bakery and Confectionery
- 9.2.2. Meat and Meat Products
- 9.2.3. Other Applications
- 9.3. Market Analysis, Insights and Forecast - by Form
- 9.3.1. Liquid
- 9.3.2. Solid
- 9.1. Market Analysis, Insights and Forecast - by Composition
- 10. South America Releasing Agent Industry Analysis, Insights and Forecast, 2020-2032
- 10.1. Market Analysis, Insights and Forecast - by Composition
- 10.1.1. Emulsifiers
- 10.1.2. Antioxidants
- 10.1.3. vegetable Oils
- 10.1.4. Wax and Wax Esters
- 10.1.5. Others
- 10.2. Market Analysis, Insights and Forecast - by Application
- 10.2.1. Bakery and Confectionery
- 10.2.2. Meat and Meat Products
- 10.2.3. Other Applications
- 10.3. Market Analysis, Insights and Forecast - by Form
- 10.3.1. Liquid
- 10.3.2. Solid
- 10.1. Market Analysis, Insights and Forecast - by Composition
- 11. Middle East Releasing Agent Industry Analysis, Insights and Forecast, 2020-2032
- 11.1. Market Analysis, Insights and Forecast - by Composition
- 11.1.1. Emulsifiers
- 11.1.2. Antioxidants
- 11.1.3. vegetable Oils
- 11.1.4. Wax and Wax Esters
- 11.1.5. Others
- 11.2. Market Analysis, Insights and Forecast - by Application
- 11.2.1. Bakery and Confectionery
- 11.2.2. Meat and Meat Products
- 11.2.3. Other Applications
- 11.3. Market Analysis, Insights and Forecast - by Form
- 11.3.1. Liquid
- 11.3.2. Solid
- 11.1. Market Analysis, Insights and Forecast - by Composition
- 12. United Arab Emirates Releasing Agent Industry Analysis, Insights and Forecast, 2020-2032
- 12.1. Market Analysis, Insights and Forecast - by Composition
- 12.1.1. Emulsifiers
- 12.1.2. Antioxidants
- 12.1.3. vegetable Oils
- 12.1.4. Wax and Wax Esters
- 12.1.5. Others
- 12.2. Market Analysis, Insights and Forecast - by Application
- 12.2.1. Bakery and Confectionery
- 12.2.2. Meat and Meat Products
- 12.2.3. Other Applications
- 12.3. Market Analysis, Insights and Forecast - by Form
- 12.3.1. Liquid
- 12.3.2. Solid
- 12.1. Market Analysis, Insights and Forecast - by Composition
- 13. Competitive Analysis
- 13.1. Company Profiles
- 13.1.1 Cargill Incorporated
- 13.1.1.1. Company Overview
- 13.1.1.2. Products
- 13.1.1.3. Company Financials
- 13.1.1.4. SWOT Analysis
- 13.1.2 IFC Solutions Inc
- 13.1.2.1. Company Overview
- 13.1.2.2. Products
- 13.1.2.3. Company Financials
- 13.1.2.4. SWOT Analysis
- 13.1.3 Bundy baking Solutions
- 13.1.3.1. Company Overview
- 13.1.3.2. Products
- 13.1.3.3. Company Financials
- 13.1.3.4. SWOT Analysis
- 13.1.4 Bunge Limited
- 13.1.4.1. Company Overview
- 13.1.4.2. Products
- 13.1.4.3. Company Financials
- 13.1.4.4. SWOT Analysis
- 13.1.5 Masterol Foods Pvt Ltd
- 13.1.5.1. Company Overview
- 13.1.5.2. Products
- 13.1.5.3. Company Financials
- 13.1.5.4. SWOT Analysis
- 13.1.6 Archer Danelis Midland Company
- 13.1.6.1. Company Overview
- 13.1.6.2. Products
- 13.1.6.3. Company Financials
- 13.1.6.4. SWOT Analysis
- 13.1.7 Lallemand
- 13.1.7.1. Company Overview
- 13.1.7.2. Products
- 13.1.7.3. Company Financials
- 13.1.7.4. SWOT Analysis
- 13.1.8 The Bakels Group
- 13.1.8.1. Company Overview
- 13.1.8.2. Products
- 13.1.8.3. Company Financials
- 13.1.8.4. SWOT Analysis
- 13.1.9 Mallet & Company Inc
- 13.1.9.1. Company Overview
- 13.1.9.2. Products
- 13.1.9.3. Company Financials
- 13.1.9.4. SWOT Analysis
- 13.1.10 Avatar Corporation*List Not Exhaustive
- 13.1.10.1. Company Overview
- 13.1.10.2. Products
- 13.1.10.3. Company Financials
- 13.1.10.4. SWOT Analysis
- 13.1.1 Cargill Incorporated
- 13.2. Market Entropy
- 13.2.1 Company's Key Areas Served
- 13.2.2 Recent Developments
- 13.3. Company Market Share Analysis 2025
- 13.3.1 Top 5 Companies Market Share Analysis
- 13.3.2 Top 3 Companies Market Share Analysis
- 13.4. List of Potential Customers
- 14. Research Methodology
List of Figures
- Figure 1: Global Releasing Agent Industry Revenue Breakdown (million, %) by Region 2025 & 2033
- Figure 2: Global Releasing Agent Industry Volume Breakdown (K Tons, %) by Region 2025 & 2033
- Figure 3: North America Releasing Agent Industry Revenue (million), by Composition 2025 & 2033
- Figure 4: North America Releasing Agent Industry Volume (K Tons), by Composition 2025 & 2033
- Figure 5: North America Releasing Agent Industry Revenue Share (%), by Composition 2025 & 2033
- Figure 6: North America Releasing Agent Industry Volume Share (%), by Composition 2025 & 2033
- Figure 7: North America Releasing Agent Industry Revenue (million), by Application 2025 & 2033
- Figure 8: North America Releasing Agent Industry Volume (K Tons), by Application 2025 & 2033
- Figure 9: North America Releasing Agent Industry Revenue Share (%), by Application 2025 & 2033
- Figure 10: North America Releasing Agent Industry Volume Share (%), by Application 2025 & 2033
- Figure 11: North America Releasing Agent Industry Revenue (million), by Form 2025 & 2033
- Figure 12: North America Releasing Agent Industry Volume (K Tons), by Form 2025 & 2033
- Figure 13: North America Releasing Agent Industry Revenue Share (%), by Form 2025 & 2033
- Figure 14: North America Releasing Agent Industry Volume Share (%), by Form 2025 & 2033
- Figure 15: North America Releasing Agent Industry Revenue (million), by Country 2025 & 2033
- Figure 16: North America Releasing Agent Industry Volume (K Tons), by Country 2025 & 2033
- Figure 17: North America Releasing Agent Industry Revenue Share (%), by Country 2025 & 2033
- Figure 18: North America Releasing Agent Industry Volume Share (%), by Country 2025 & 2033
- Figure 19: Europe Releasing Agent Industry Revenue (million), by Composition 2025 & 2033
- Figure 20: Europe Releasing Agent Industry Volume (K Tons), by Composition 2025 & 2033
- Figure 21: Europe Releasing Agent Industry Revenue Share (%), by Composition 2025 & 2033
- Figure 22: Europe Releasing Agent Industry Volume Share (%), by Composition 2025 & 2033
- Figure 23: Europe Releasing Agent Industry Revenue (million), by Application 2025 & 2033
- Figure 24: Europe Releasing Agent Industry Volume (K Tons), by Application 2025 & 2033
- Figure 25: Europe Releasing Agent Industry Revenue Share (%), by Application 2025 & 2033
- Figure 26: Europe Releasing Agent Industry Volume Share (%), by Application 2025 & 2033
- Figure 27: Europe Releasing Agent Industry Revenue (million), by Form 2025 & 2033
- Figure 28: Europe Releasing Agent Industry Volume (K Tons), by Form 2025 & 2033
- Figure 29: Europe Releasing Agent Industry Revenue Share (%), by Form 2025 & 2033
- Figure 30: Europe Releasing Agent Industry Volume Share (%), by Form 2025 & 2033
- Figure 31: Europe Releasing Agent Industry Revenue (million), by Country 2025 & 2033
- Figure 32: Europe Releasing Agent Industry Volume (K Tons), by Country 2025 & 2033
- Figure 33: Europe Releasing Agent Industry Revenue Share (%), by Country 2025 & 2033
- Figure 34: Europe Releasing Agent Industry Volume Share (%), by Country 2025 & 2033
- Figure 35: Asia Pacific Releasing Agent Industry Revenue (million), by Composition 2025 & 2033
- Figure 36: Asia Pacific Releasing Agent Industry Volume (K Tons), by Composition 2025 & 2033
- Figure 37: Asia Pacific Releasing Agent Industry Revenue Share (%), by Composition 2025 & 2033
- Figure 38: Asia Pacific Releasing Agent Industry Volume Share (%), by Composition 2025 & 2033
- Figure 39: Asia Pacific Releasing Agent Industry Revenue (million), by Application 2025 & 2033
- Figure 40: Asia Pacific Releasing Agent Industry Volume (K Tons), by Application 2025 & 2033
- Figure 41: Asia Pacific Releasing Agent Industry Revenue Share (%), by Application 2025 & 2033
- Figure 42: Asia Pacific Releasing Agent Industry Volume Share (%), by Application 2025 & 2033
- Figure 43: Asia Pacific Releasing Agent Industry Revenue (million), by Form 2025 & 2033
- Figure 44: Asia Pacific Releasing Agent Industry Volume (K Tons), by Form 2025 & 2033
- Figure 45: Asia Pacific Releasing Agent Industry Revenue Share (%), by Form 2025 & 2033
- Figure 46: Asia Pacific Releasing Agent Industry Volume Share (%), by Form 2025 & 2033
- Figure 47: Asia Pacific Releasing Agent Industry Revenue (million), by Country 2025 & 2033
- Figure 48: Asia Pacific Releasing Agent Industry Volume (K Tons), by Country 2025 & 2033
- Figure 49: Asia Pacific Releasing Agent Industry Revenue Share (%), by Country 2025 & 2033
- Figure 50: Asia Pacific Releasing Agent Industry Volume Share (%), by Country 2025 & 2033
- Figure 51: South America Releasing Agent Industry Revenue (million), by Composition 2025 & 2033
- Figure 52: South America Releasing Agent Industry Volume (K Tons), by Composition 2025 & 2033
- Figure 53: South America Releasing Agent Industry Revenue Share (%), by Composition 2025 & 2033
- Figure 54: South America Releasing Agent Industry Volume Share (%), by Composition 2025 & 2033
- Figure 55: South America Releasing Agent Industry Revenue (million), by Application 2025 & 2033
- Figure 56: South America Releasing Agent Industry Volume (K Tons), by Application 2025 & 2033
- Figure 57: South America Releasing Agent Industry Revenue Share (%), by Application 2025 & 2033
- Figure 58: South America Releasing Agent Industry Volume Share (%), by Application 2025 & 2033
- Figure 59: South America Releasing Agent Industry Revenue (million), by Form 2025 & 2033
- Figure 60: South America Releasing Agent Industry Volume (K Tons), by Form 2025 & 2033
- Figure 61: South America Releasing Agent Industry Revenue Share (%), by Form 2025 & 2033
- Figure 62: South America Releasing Agent Industry Volume Share (%), by Form 2025 & 2033
- Figure 63: South America Releasing Agent Industry Revenue (million), by Country 2025 & 2033
- Figure 64: South America Releasing Agent Industry Volume (K Tons), by Country 2025 & 2033
- Figure 65: South America Releasing Agent Industry Revenue Share (%), by Country 2025 & 2033
- Figure 66: South America Releasing Agent Industry Volume Share (%), by Country 2025 & 2033
- Figure 67: Middle East Releasing Agent Industry Revenue (million), by Composition 2025 & 2033
- Figure 68: Middle East Releasing Agent Industry Volume (K Tons), by Composition 2025 & 2033
- Figure 69: Middle East Releasing Agent Industry Revenue Share (%), by Composition 2025 & 2033
- Figure 70: Middle East Releasing Agent Industry Volume Share (%), by Composition 2025 & 2033
- Figure 71: Middle East Releasing Agent Industry Revenue (million), by Application 2025 & 2033
- Figure 72: Middle East Releasing Agent Industry Volume (K Tons), by Application 2025 & 2033
- Figure 73: Middle East Releasing Agent Industry Revenue Share (%), by Application 2025 & 2033
- Figure 74: Middle East Releasing Agent Industry Volume Share (%), by Application 2025 & 2033
- Figure 75: Middle East Releasing Agent Industry Revenue (million), by Form 2025 & 2033
- Figure 76: Middle East Releasing Agent Industry Volume (K Tons), by Form 2025 & 2033
- Figure 77: Middle East Releasing Agent Industry Revenue Share (%), by Form 2025 & 2033
- Figure 78: Middle East Releasing Agent Industry Volume Share (%), by Form 2025 & 2033
- Figure 79: Middle East Releasing Agent Industry Revenue (million), by Country 2025 & 2033
- Figure 80: Middle East Releasing Agent Industry Volume (K Tons), by Country 2025 & 2033
- Figure 81: Middle East Releasing Agent Industry Revenue Share (%), by Country 2025 & 2033
- Figure 82: Middle East Releasing Agent Industry Volume Share (%), by Country 2025 & 2033
- Figure 83: United Arab Emirates Releasing Agent Industry Revenue (million), by Composition 2025 & 2033
- Figure 84: United Arab Emirates Releasing Agent Industry Volume (K Tons), by Composition 2025 & 2033
- Figure 85: United Arab Emirates Releasing Agent Industry Revenue Share (%), by Composition 2025 & 2033
- Figure 86: United Arab Emirates Releasing Agent Industry Volume Share (%), by Composition 2025 & 2033
- Figure 87: United Arab Emirates Releasing Agent Industry Revenue (million), by Application 2025 & 2033
- Figure 88: United Arab Emirates Releasing Agent Industry Volume (K Tons), by Application 2025 & 2033
- Figure 89: United Arab Emirates Releasing Agent Industry Revenue Share (%), by Application 2025 & 2033
- Figure 90: United Arab Emirates Releasing Agent Industry Volume Share (%), by Application 2025 & 2033
- Figure 91: United Arab Emirates Releasing Agent Industry Revenue (million), by Form 2025 & 2033
- Figure 92: United Arab Emirates Releasing Agent Industry Volume (K Tons), by Form 2025 & 2033
- Figure 93: United Arab Emirates Releasing Agent Industry Revenue Share (%), by Form 2025 & 2033
- Figure 94: United Arab Emirates Releasing Agent Industry Volume Share (%), by Form 2025 & 2033
- Figure 95: United Arab Emirates Releasing Agent Industry Revenue (million), by Country 2025 & 2033
- Figure 96: United Arab Emirates Releasing Agent Industry Volume (K Tons), by Country 2025 & 2033
- Figure 97: United Arab Emirates Releasing Agent Industry Revenue Share (%), by Country 2025 & 2033
- Figure 98: United Arab Emirates Releasing Agent Industry Volume Share (%), by Country 2025 & 2033
List of Tables
- Table 1: Global Releasing Agent Industry Revenue million Forecast, by Composition 2020 & 2033
- Table 2: Global Releasing Agent Industry Volume K Tons Forecast, by Composition 2020 & 2033
- Table 3: Global Releasing Agent Industry Revenue million Forecast, by Application 2020 & 2033
- Table 4: Global Releasing Agent Industry Volume K Tons Forecast, by Application 2020 & 2033
- Table 5: Global Releasing Agent Industry Revenue million Forecast, by Form 2020 & 2033
- Table 6: Global Releasing Agent Industry Volume K Tons Forecast, by Form 2020 & 2033
- Table 7: Global Releasing Agent Industry Revenue million Forecast, by Region 2020 & 2033
- Table 8: Global Releasing Agent Industry Volume K Tons Forecast, by Region 2020 & 2033
- Table 9: Global Releasing Agent Industry Revenue million Forecast, by Composition 2020 & 2033
- Table 10: Global Releasing Agent Industry Volume K Tons Forecast, by Composition 2020 & 2033
- Table 11: Global Releasing Agent Industry Revenue million Forecast, by Application 2020 & 2033
- Table 12: Global Releasing Agent Industry Volume K Tons Forecast, by Application 2020 & 2033
- Table 13: Global Releasing Agent Industry Revenue million Forecast, by Form 2020 & 2033
- Table 14: Global Releasing Agent Industry Volume K Tons Forecast, by Form 2020 & 2033
- Table 15: Global Releasing Agent Industry Revenue million Forecast, by Country 2020 & 2033
- Table 16: Global Releasing Agent Industry Volume K Tons Forecast, by Country 2020 & 2033
- Table 17: United States Releasing Agent Industry Revenue (million) Forecast, by Application 2020 & 2033
- Table 18: United States Releasing Agent Industry Volume (K Tons) Forecast, by Application 2020 & 2033
- Table 19: Canada Releasing Agent Industry Revenue (million) Forecast, by Application 2020 & 2033
- Table 20: Canada Releasing Agent Industry Volume (K Tons) Forecast, by Application 2020 & 2033
- Table 21: Mexico Releasing Agent Industry Revenue (million) Forecast, by Application 2020 & 2033
- Table 22: Mexico Releasing Agent Industry Volume (K Tons) Forecast, by Application 2020 & 2033
- Table 23: Rest of North America Releasing Agent Industry Revenue (million) Forecast, by Application 2020 & 2033
- Table 24: Rest of North America Releasing Agent Industry Volume (K Tons) Forecast, by Application 2020 & 2033
- Table 25: Global Releasing Agent Industry Revenue million Forecast, by Composition 2020 & 2033
- Table 26: Global Releasing Agent Industry Volume K Tons Forecast, by Composition 2020 & 2033
- Table 27: Global Releasing Agent Industry Revenue million Forecast, by Application 2020 & 2033
- Table 28: Global Releasing Agent Industry Volume K Tons Forecast, by Application 2020 & 2033
- Table 29: Global Releasing Agent Industry Revenue million Forecast, by Form 2020 & 2033
- Table 30: Global Releasing Agent Industry Volume K Tons Forecast, by Form 2020 & 2033
- Table 31: Global Releasing Agent Industry Revenue million Forecast, by Country 2020 & 2033
- Table 32: Global Releasing Agent Industry Volume K Tons Forecast, by Country 2020 & 2033
- Table 33: Germany Releasing Agent Industry Revenue (million) Forecast, by Application 2020 & 2033
- Table 34: Germany Releasing Agent Industry Volume (K Tons) Forecast, by Application 2020 & 2033
- Table 35: United Kingdom Releasing Agent Industry Revenue (million) Forecast, by Application 2020 & 2033
- Table 36: United Kingdom Releasing Agent Industry Volume (K Tons) Forecast, by Application 2020 & 2033
- Table 37: France Releasing Agent Industry Revenue (million) Forecast, by Application 2020 & 2033
- Table 38: France Releasing Agent Industry Volume (K Tons) Forecast, by Application 2020 & 2033
- Table 39: Russia Releasing Agent Industry Revenue (million) Forecast, by Application 2020 & 2033
- Table 40: Russia Releasing Agent Industry Volume (K Tons) Forecast, by Application 2020 & 2033
- Table 41: Spain Releasing Agent Industry Revenue (million) Forecast, by Application 2020 & 2033
- Table 42: Spain Releasing Agent Industry Volume (K Tons) Forecast, by Application 2020 & 2033
- Table 43: Rest of Europe Releasing Agent Industry Revenue (million) Forecast, by Application 2020 & 2033
- Table 44: Rest of Europe Releasing Agent Industry Volume (K Tons) Forecast, by Application 2020 & 2033
- Table 45: Global Releasing Agent Industry Revenue million Forecast, by Composition 2020 & 2033
- Table 46: Global Releasing Agent Industry Volume K Tons Forecast, by Composition 2020 & 2033
- Table 47: Global Releasing Agent Industry Revenue million Forecast, by Application 2020 & 2033
- Table 48: Global Releasing Agent Industry Volume K Tons Forecast, by Application 2020 & 2033
- Table 49: Global Releasing Agent Industry Revenue million Forecast, by Form 2020 & 2033
- Table 50: Global Releasing Agent Industry Volume K Tons Forecast, by Form 2020 & 2033
- Table 51: Global Releasing Agent Industry Revenue million Forecast, by Country 2020 & 2033
- Table 52: Global Releasing Agent Industry Volume K Tons Forecast, by Country 2020 & 2033
- Table 53: India Releasing Agent Industry Revenue (million) Forecast, by Application 2020 & 2033
- Table 54: India Releasing Agent Industry Volume (K Tons) Forecast, by Application 2020 & 2033
- Table 55: China Releasing Agent Industry Revenue (million) Forecast, by Application 2020 & 2033
- Table 56: China Releasing Agent Industry Volume (K Tons) Forecast, by Application 2020 & 2033
- Table 57: Japan Releasing Agent Industry Revenue (million) Forecast, by Application 2020 & 2033
- Table 58: Japan Releasing Agent Industry Volume (K Tons) Forecast, by Application 2020 & 2033
- Table 59: Rest of Asia Pacific Releasing Agent Industry Revenue (million) Forecast, by Application 2020 & 2033
- Table 60: Rest of Asia Pacific Releasing Agent Industry Volume (K Tons) Forecast, by Application 2020 & 2033
- Table 61: Global Releasing Agent Industry Revenue million Forecast, by Composition 2020 & 2033
- Table 62: Global Releasing Agent Industry Volume K Tons Forecast, by Composition 2020 & 2033
- Table 63: Global Releasing Agent Industry Revenue million Forecast, by Application 2020 & 2033
- Table 64: Global Releasing Agent Industry Volume K Tons Forecast, by Application 2020 & 2033
- Table 65: Global Releasing Agent Industry Revenue million Forecast, by Form 2020 & 2033
- Table 66: Global Releasing Agent Industry Volume K Tons Forecast, by Form 2020 & 2033
- Table 67: Global Releasing Agent Industry Revenue million Forecast, by Country 2020 & 2033
- Table 68: Global Releasing Agent Industry Volume K Tons Forecast, by Country 2020 & 2033
- Table 69: Brazil Releasing Agent Industry Revenue (million) Forecast, by Application 2020 & 2033
- Table 70: Brazil Releasing Agent Industry Volume (K Tons) Forecast, by Application 2020 & 2033
- Table 71: Argentina Releasing Agent Industry Revenue (million) Forecast, by Application 2020 & 2033
- Table 72: Argentina Releasing Agent Industry Volume (K Tons) Forecast, by Application 2020 & 2033
- Table 73: Rest of South America Releasing Agent Industry Revenue (million) Forecast, by Application 2020 & 2033
- Table 74: Rest of South America Releasing Agent Industry Volume (K Tons) Forecast, by Application 2020 & 2033
- Table 75: Global Releasing Agent Industry Revenue million Forecast, by Composition 2020 & 2033
- Table 76: Global Releasing Agent Industry Volume K Tons Forecast, by Composition 2020 & 2033
- Table 77: Global Releasing Agent Industry Revenue million Forecast, by Application 2020 & 2033
- Table 78: Global Releasing Agent Industry Volume K Tons Forecast, by Application 2020 & 2033
- Table 79: Global Releasing Agent Industry Revenue million Forecast, by Form 2020 & 2033
- Table 80: Global Releasing Agent Industry Volume K Tons Forecast, by Form 2020 & 2033
- Table 81: Global Releasing Agent Industry Revenue million Forecast, by Country 2020 & 2033
- Table 82: Global Releasing Agent Industry Volume K Tons Forecast, by Country 2020 & 2033
- Table 83: Global Releasing Agent Industry Revenue million Forecast, by Composition 2020 & 2033
- Table 84: Global Releasing Agent Industry Volume K Tons Forecast, by Composition 2020 & 2033
- Table 85: Global Releasing Agent Industry Revenue million Forecast, by Application 2020 & 2033
- Table 86: Global Releasing Agent Industry Volume K Tons Forecast, by Application 2020 & 2033
- Table 87: Global Releasing Agent Industry Revenue million Forecast, by Form 2020 & 2033
- Table 88: Global Releasing Agent Industry Volume K Tons Forecast, by Form 2020 & 2033
- Table 89: Global Releasing Agent Industry Revenue million Forecast, by Country 2020 & 2033
- Table 90: Global Releasing Agent Industry Volume K Tons Forecast, by Country 2020 & 2033
- Table 91: South Africa Releasing Agent Industry Revenue (million) Forecast, by Application 2020 & 2033
- Table 92: South Africa Releasing Agent Industry Volume (K Tons) Forecast, by Application 2020 & 2033
- Table 93: Rest of Middle East Releasing Agent Industry Revenue (million) Forecast, by Application 2020 & 2033
- Table 94: Rest of Middle East Releasing Agent Industry Volume (K Tons) Forecast, by Application 2020 & 2033
Frequently Asked Questions
1. What is the projected Compound Annual Growth Rate (CAGR) of the Releasing Agent Industry?
The projected CAGR is approximately 4.4%.
2. Which companies are prominent players in the Releasing Agent Industry?
Key companies in the market include Cargill Incorporated, IFC Solutions Inc, Bundy baking Solutions, Bunge Limited, Masterol Foods Pvt Ltd, Archer Danelis Midland Company, Lallemand, The Bakels Group, Mallet & Company Inc, Avatar Corporation*List Not Exhaustive.
3. What are the main segments of the Releasing Agent Industry?
The market segments include Composition, Application, Form.
4. Can you provide details about the market size?
The market size is estimated to be USD 405 million as of 2022.
5. What are some drivers contributing to market growth?
Increasing Demand for Organic Plant Proteins; Increasing Application of Pea Protein in Food and Beverages.
6. What are the notable trends driving market growth?
Rising Food Consumption and Innovation in Packaged Foods.
7. Are there any restraints impacting market growth?
Presence of Alternative protein sources.
8. Can you provide examples of recent developments in the market?
N/A
9. What pricing options are available for accessing the report?
Pricing options include single-user, multi-user, and enterprise licenses priced at USD 4750, USD 5250, and USD 8750 respectively.
10. Is the market size provided in terms of value or volume?
The market size is provided in terms of value, measured in million and volume, measured in K Tons.
11. Are there any specific market keywords associated with the report?
Yes, the market keyword associated with the report is "Releasing Agent Industry," which aids in identifying and referencing the specific market segment covered.
12. How do I determine which pricing option suits my needs best?
The pricing options vary based on user requirements and access needs. Individual users may opt for single-user licenses, while businesses requiring broader access may choose multi-user or enterprise licenses for cost-effective access to the report.
13. Are there any additional resources or data provided in the Releasing Agent Industry report?
While the report offers comprehensive insights, it's advisable to review the specific contents or supplementary materials provided to ascertain if additional resources or data are available.
14. How can I stay updated on further developments or reports in the Releasing Agent Industry?
To stay informed about further developments, trends, and reports in the Releasing Agent Industry, consider subscribing to industry newsletters, following relevant companies and organizations, or regularly checking reputable industry news sources and publications.
Methodology
Step 1 - Identification of Relevant Samples Size from Population Database


Step 2 - Approaches for Defining Global Market Size (Value, Volume* & Price*)

Note*: In applicable scenarios
Step 3 - Data Sources
Primary Research
- Web Analytics
- Survey Reports
- Research Institute
- Latest Research Reports
- Opinion Leaders
Secondary Research
- Annual Reports
- White Paper
- Latest Press Release
- Industry Association
- Paid Database
- Investor Presentations

Step 4 - Data Triangulation
Involves using different sources of information in order to increase the validity of a study
These sources are likely to be stakeholders in a program - participants, other researchers, program staff, other community members, and so on.
Then we put all data in single framework & apply various statistical tools to find out the dynamic on the market.
During the analysis stage, feedback from the stakeholder groups would be compared to determine areas of agreement as well as areas of divergence