

Key Insights
The US Property and Casualty (P&C) insurance market, a cornerstone of the American financial system, is experiencing robust growth driven by several key factors. The increasing frequency and severity of weather-related catastrophes, fueled by climate change, are significantly impacting claims payouts and driving up premiums. This, coupled with a growing population and expanding asset base, contributes to a rising demand for insurance coverage across residential, commercial, and automotive sectors. Technological advancements, such as telematics and AI-powered risk assessment, are reshaping the industry landscape, leading to more accurate pricing, improved fraud detection, and enhanced customer experience. Furthermore, regulatory changes and increased scrutiny of insurance practices are impacting operational strategies and profitability. Competition remains fierce, with established players and insurtech startups vying for market share through innovative product offerings and distribution channels.
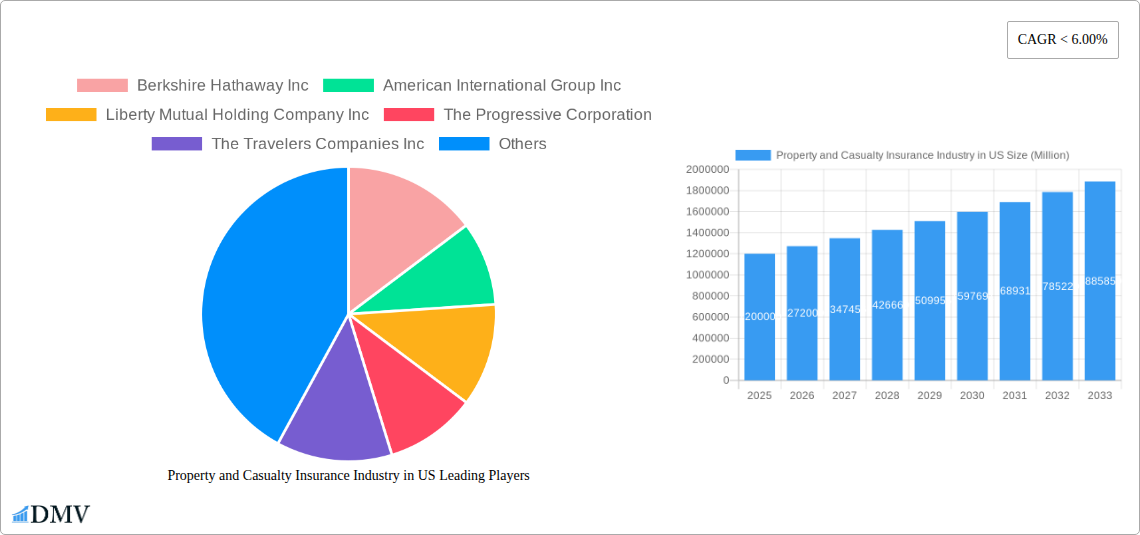
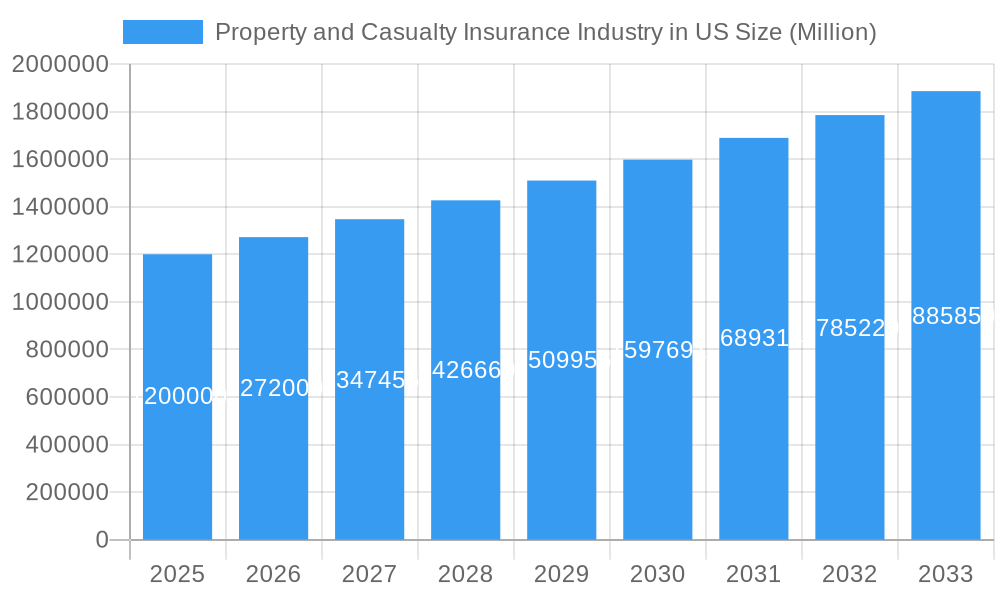
Property and Casualty Insurance Industry in US Market Size (In Million)
Looking ahead, the forecast for the US P&C insurance market remains positive, although challenges exist. Sustained economic growth will likely fuel further demand for insurance, particularly in commercial lines. However, inflationary pressures and evolving consumer preferences are influencing underwriting practices and pricing strategies. The industry's ability to adapt to these evolving dynamics, effectively leverage technological innovation, and manage risk effectively will be critical to maintaining profitability and sustained growth. The increasing sophistication of cyber threats also presents a burgeoning area of risk requiring significant attention and innovative solutions. The market is expected to see continued consolidation as larger players seek to expand their market share and enhance their competitive positioning.
Property and Casualty Insurance Industry in US Company Market Share
Property and Casualty Insurance Industry in US: 2019-2033 Market Analysis & Forecast Report
This comprehensive report provides a detailed analysis of the US Property and Casualty (P&C) insurance market, offering invaluable insights for stakeholders seeking to navigate this dynamic landscape. Covering the period from 2019 to 2033, with a base year of 2025 and a forecast period of 2025-2033, this report leverages extensive data and expert analysis to deliver a clear understanding of market trends, growth drivers, and future opportunities. The report includes detailed analysis of key players like Berkshire Hathaway Inc, American International Group Inc, Liberty Mutual Holding Company Inc, The Progressive Corporation, The Travelers Companies Inc, United Services Automobile Association, Farmers Group Inc, American Family Mutual Insurance Company S I, W R Berkley Corporation, and American Financial Group Inc, though the list is not exhaustive.
Property and Casualty Insurance Industry in US Market Composition & Trends
This section evaluates the competitive landscape, innovative forces, regulatory environment, and market dynamics of the US P&C insurance sector. We examine market concentration, revealing the market share distribution among leading players. For instance, Berkshire Hathaway Inc. holds an estimated xx% market share in 2025, followed by American International Group Inc. with xx%. Further, we analyze the impact of M&A activities, estimating the total value of deals concluded during the historical period (2019-2024) at approximately $XX Million. Key factors influencing market composition include:
- Market Concentration: High concentration with a few dominant players.
- Innovation Catalysts: Increasing adoption of Insurtech, AI-driven risk assessment, and personalized pricing models.
- Regulatory Landscape: State-level regulations impacting pricing, product offerings, and compliance.
- Substitute Products: Limited direct substitutes, but competition from alternative risk management strategies.
- End-User Profiles: Diversified customer base spanning individuals, businesses, and government entities.
- M&A Activities: Significant M&A activity driven by expansion strategies and technological integration.
Property and Casualty Insurance Industry in US Industry Evolution
The US P&C insurance market has experienced significant evolution during the study period (2019-2024), marked by a Compound Annual Growth Rate (CAGR) of xx% from 2019 to 2024 and projected to grow at a CAGR of xx% from 2025 to 2033, reaching a market size of $XX Million by 2033. This growth is fueled by several key factors: increasing urbanization and the resulting rise in property values, growing awareness of insurance needs among consumers, and the proliferation of technological advancements. Technological advancements, such as telematics and AI-powered fraud detection, are improving efficiency and accuracy within the industry, significantly altering the customer experience. The rising demand for customized insurance solutions, catering to diverse individual and business needs, is also driving market evolution. The digital transformation of the sector continues to reshape distribution channels and customer interactions, fostering faster growth and innovation.
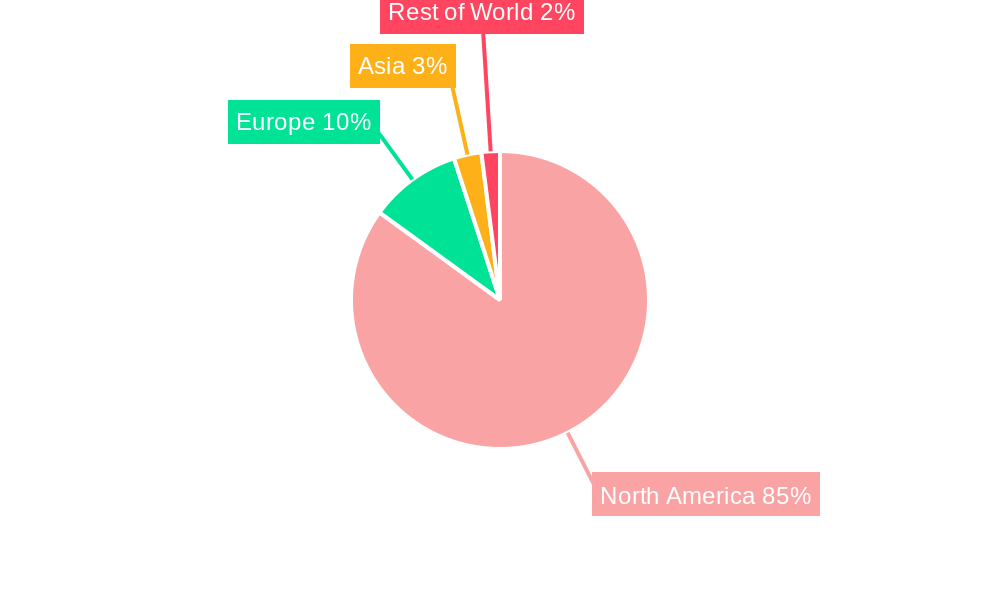
Leading Regions, Countries, or Segments in Property and Casualty Insurance Industry in US
The US P&C insurance market demonstrates regional variations in growth and dominance. The largest segment is the commercial lines insurance, followed by personal lines insurance. California, Texas, and New York represent the leading states in terms of premium volume. Key drivers for these leading regions include:
- California: High population density, substantial commercial activity, and a robust regulatory framework.
- Texas: Significant industrial and energy sectors, driving demand for specialized insurance products.
- New York: Concentrated financial and commercial sectors, leading to high demand for various insurance types.
The dominance of these regions is rooted in factors such as high population density, robust economic activity, and favorable regulatory environments that encourage market expansion. This dominance is further amplified by sustained investment in infrastructure and technology within these regions.
Property and Casualty Insurance Industry in US Product Innovations
Recent innovations include usage-based insurance (UBI) leveraging telematics data, AI-powered risk assessment tools enabling more accurate pricing and underwriting, and the introduction of parametric insurance products offering swift payouts triggered by predefined events. These innovations enhance customer experience, improve operational efficiency, and contribute to the overall growth of the sector. The unique selling propositions of these new products center around personalized pricing, faster claims processing, and increased transparency for customers.
Propelling Factors for Property and Casualty Insurance Industry in US Growth
Several factors contribute to the anticipated growth of the US P&C insurance market. Technological advancements, such as AI and machine learning, are streamlining operations and improving risk assessment. Economic expansion, coupled with rising property values and disposable incomes, fuels increased demand for insurance coverage. Furthermore, evolving regulations are shaping the market by promoting transparency and consumer protection. The increasing prevalence of natural disasters also contributes significantly to the demand for various insurance products.
Obstacles in the Property and Casualty Insurance Industry in US Market
The US P&C insurance market faces challenges such as stringent regulatory compliance costs, the increasing frequency and severity of catastrophic events leading to higher claims payouts, and intense competition among established and emerging players. Supply chain disruptions, especially in the wake of unforeseen events, add to operational complexities. These factors can collectively impact profitability and market stability.
Future Opportunities in Property and Casualty Insurance Industry in US
Future growth opportunities lie in expanding into underserved markets, leveraging emerging technologies such as blockchain for secure transactions, and developing innovative insurance products catering to evolving consumer needs. The integration of IoT and wearable technology presents opportunities for personalized risk assessment and preventive measures. Further, the growth of the gig economy creates demand for tailored insurance solutions for independent contractors.
Major Players in the Property and Casualty Insurance Industry in US Ecosystem
- Berkshire Hathaway Inc
- American International Group Inc
- Liberty Mutual Holding Company Inc
- The Progressive Corporation
- The Travelers Companies Inc
- United Services Automobile Association
- Farmers Group Inc
- American Family Mutual Insurance Company S I
- W R Berkley Corporation
- American Financial Group Inc
Key Developments in Property and Casualty Insurance Industry in US Industry
- 2022 Q4: Increased adoption of Insurtech solutions among major players.
- 2023 Q1: Several significant mergers and acquisitions reshaping market dynamics.
- 2023 Q2: Launch of new parametric insurance products for specific climate risks.
- 2024 Q3: Significant investments in AI and machine learning for improved risk assessment.
Strategic Property and Casualty Insurance Industry in US Market Forecast
The US P&C insurance market is poised for sustained growth driven by technological innovation, evolving consumer preferences, and the increasing prevalence of insurable risks. The market's future success hinges on adapting to these changes, embracing emerging technologies, and continually developing innovative and customer-centric products. The forecast period suggests a robust and dynamic market ready for significant expansion and transformation.
Property and Casualty Insurance Industry in US Segmentation
-
1. Insurance Type
- 1.1. Home
- 1.2. Motor
- 1.3. Others
-
2. Channel of Distribution
- 2.1. Direct
- 2.2. Agency
- 2.3. Banks
- 2.4. Others
Property and Casualty Insurance Industry in US Segmentation By Geography
-
1. North America
- 1.1. United States
- 1.2. Canada
- 1.3. Mexico
-
2. South America
- 2.1. Brazil
- 2.2. Argentina
- 2.3. Rest of South America
-
3. Europe
- 3.1. United Kingdom
- 3.2. Germany
- 3.3. France
- 3.4. Italy
- 3.5. Spain
- 3.6. Russia
- 3.7. Benelux
- 3.8. Nordics
- 3.9. Rest of Europe
-
4. Middle East & Africa
- 4.1. Turkey
- 4.2. Israel
- 4.3. GCC
- 4.4. North Africa
- 4.5. South Africa
- 4.6. Rest of Middle East & Africa
-
5. Asia Pacific
- 5.1. China
- 5.2. India
- 5.3. Japan
- 5.4. South Korea
- 5.5. ASEAN
- 5.6. Oceania
- 5.7. Rest of Asia Pacific
Property and Casualty Insurance Industry in US Regional Market Share
Geographic Coverage of Property and Casualty Insurance Industry in US
Property and Casualty Insurance Industry in US REPORT HIGHLIGHTS
| Aspects | Details |
|---|---|
| Study Period | 2020-2034 |
| Base Year | 2025 |
| Estimated Year | 2026 |
| Forecast Period | 2026-2034 |
| Historical Period | 2020-2025 |
| Growth Rate | CAGR of < 6.00% from 2020-2034 |
| Segmentation |
|
Table of Contents
- 1. Introduction
- 1.1. Research Scope
- 1.2. Market Segmentation
- 1.3. Research Objective
- 1.4. Definitions and Assumptions
- 2. Executive Summary
- 2.1. Market Snapshot
- 3. Market Dynamics
- 3.1. Market Drivers
- 3.2. Market Restrains
- 3.3. Market Trends
- 3.4. Market Opportunities
- 4. Market Factor Analysis
- 4.1. Porters Five Forces
- 4.1.1. Bargaining Power of Suppliers
- 4.1.2. Bargaining Power of Buyers
- 4.1.3. Threat of New Entrants
- 4.1.4. Threat of Substitutes
- 4.1.5. Competitive Rivalry
- 4.2. PESTEL analysis
- 4.3. BCG Analysis
- 4.3.1. Stars (High Growth, High Market Share)
- 4.3.2. Cash Cows (Low Growth, High Market Share)
- 4.3.3. Question Mark (High Growth, Low Market Share)
- 4.3.4. Dogs (Low Growth, Low Market Share)
- 4.4. Ansoff Matrix Analysis
- 4.5. Supply Chain Analysis
- 4.6. Regulatory Landscape
- 4.7. Current Market Potential and Opportunity Assessment (TAM–SAM–SOM Framework)
- 4.8. DMV Analyst Note
- 4.1. Porters Five Forces
- 5. Market Analysis, Insights and Forecast 2021-2033
- 5.1. Market Analysis, Insights and Forecast - by Insurance Type
- 5.1.1. Home
- 5.1.2. Motor
- 5.1.3. Others
- 5.2. Market Analysis, Insights and Forecast - by Channel of Distribution
- 5.2.1. Direct
- 5.2.2. Agency
- 5.2.3. Banks
- 5.2.4. Others
- 5.3. Market Analysis, Insights and Forecast - by Region
- 5.3.1. North America
- 5.3.2. South America
- 5.3.3. Europe
- 5.3.4. Middle East & Africa
- 5.3.5. Asia Pacific
- 5.1. Market Analysis, Insights and Forecast - by Insurance Type
- 6. Global Property and Casualty Insurance Industry in US Analysis, Insights and Forecast, 2021-2033
- 6.1. Market Analysis, Insights and Forecast - by Insurance Type
- 6.1.1. Home
- 6.1.2. Motor
- 6.1.3. Others
- 6.2. Market Analysis, Insights and Forecast - by Channel of Distribution
- 6.2.1. Direct
- 6.2.2. Agency
- 6.2.3. Banks
- 6.2.4. Others
- 6.1. Market Analysis, Insights and Forecast - by Insurance Type
- 7. North America Property and Casualty Insurance Industry in US Analysis, Insights and Forecast, 2020-2032
- 7.1. Market Analysis, Insights and Forecast - by Insurance Type
- 7.1.1. Home
- 7.1.2. Motor
- 7.1.3. Others
- 7.2. Market Analysis, Insights and Forecast - by Channel of Distribution
- 7.2.1. Direct
- 7.2.2. Agency
- 7.2.3. Banks
- 7.2.4. Others
- 7.1. Market Analysis, Insights and Forecast - by Insurance Type
- 8. South America Property and Casualty Insurance Industry in US Analysis, Insights and Forecast, 2020-2032
- 8.1. Market Analysis, Insights and Forecast - by Insurance Type
- 8.1.1. Home
- 8.1.2. Motor
- 8.1.3. Others
- 8.2. Market Analysis, Insights and Forecast - by Channel of Distribution
- 8.2.1. Direct
- 8.2.2. Agency
- 8.2.3. Banks
- 8.2.4. Others
- 8.1. Market Analysis, Insights and Forecast - by Insurance Type
- 9. Europe Property and Casualty Insurance Industry in US Analysis, Insights and Forecast, 2020-2032
- 9.1. Market Analysis, Insights and Forecast - by Insurance Type
- 9.1.1. Home
- 9.1.2. Motor
- 9.1.3. Others
- 9.2. Market Analysis, Insights and Forecast - by Channel of Distribution
- 9.2.1. Direct
- 9.2.2. Agency
- 9.2.3. Banks
- 9.2.4. Others
- 9.1. Market Analysis, Insights and Forecast - by Insurance Type
- 10. Middle East & Africa Property and Casualty Insurance Industry in US Analysis, Insights and Forecast, 2020-2032
- 10.1. Market Analysis, Insights and Forecast - by Insurance Type
- 10.1.1. Home
- 10.1.2. Motor
- 10.1.3. Others
- 10.2. Market Analysis, Insights and Forecast - by Channel of Distribution
- 10.2.1. Direct
- 10.2.2. Agency
- 10.2.3. Banks
- 10.2.4. Others
- 10.1. Market Analysis, Insights and Forecast - by Insurance Type
- 11. Asia Pacific Property and Casualty Insurance Industry in US Analysis, Insights and Forecast, 2020-2032
- 11.1. Market Analysis, Insights and Forecast - by Insurance Type
- 11.1.1. Home
- 11.1.2. Motor
- 11.1.3. Others
- 11.2. Market Analysis, Insights and Forecast - by Channel of Distribution
- 11.2.1. Direct
- 11.2.2. Agency
- 11.2.3. Banks
- 11.2.4. Others
- 11.1. Market Analysis, Insights and Forecast - by Insurance Type
- 12. Competitive Analysis
- 12.1. Company Profiles
- 12.1.1 Berkshire Hathaway Inc
- 12.1.1.1. Company Overview
- 12.1.1.2. Products
- 12.1.1.3. Company Financials
- 12.1.1.4. SWOT Analysis
- 12.1.2 American International Group Inc
- 12.1.2.1. Company Overview
- 12.1.2.2. Products
- 12.1.2.3. Company Financials
- 12.1.2.4. SWOT Analysis
- 12.1.3 Liberty Mutual Holding Company Inc
- 12.1.3.1. Company Overview
- 12.1.3.2. Products
- 12.1.3.3. Company Financials
- 12.1.3.4. SWOT Analysis
- 12.1.4 The Progressive Corporation
- 12.1.4.1. Company Overview
- 12.1.4.2. Products
- 12.1.4.3. Company Financials
- 12.1.4.4. SWOT Analysis
- 12.1.5 The Travelers Companies Inc
- 12.1.5.1. Company Overview
- 12.1.5.2. Products
- 12.1.5.3. Company Financials
- 12.1.5.4. SWOT Analysis
- 12.1.6 United Services Automobile Association
- 12.1.6.1. Company Overview
- 12.1.6.2. Products
- 12.1.6.3. Company Financials
- 12.1.6.4. SWOT Analysis
- 12.1.7 Farmers Group Inc
- 12.1.7.1. Company Overview
- 12.1.7.2. Products
- 12.1.7.3. Company Financials
- 12.1.7.4. SWOT Analysis
- 12.1.8 American Family Mutual Insurance Company S I
- 12.1.8.1. Company Overview
- 12.1.8.2. Products
- 12.1.8.3. Company Financials
- 12.1.8.4. SWOT Analysis
- 12.1.9 W R Berkley Corporation
- 12.1.9.1. Company Overview
- 12.1.9.2. Products
- 12.1.9.3. Company Financials
- 12.1.9.4. SWOT Analysis
- 12.1.10 American Financial Group Inc *List Not Exhaustive
- 12.1.10.1. Company Overview
- 12.1.10.2. Products
- 12.1.10.3. Company Financials
- 12.1.10.4. SWOT Analysis
- 12.1.1 Berkshire Hathaway Inc
- 12.2. Market Entropy
- 12.2.1 Company's Key Areas Served
- 12.2.2 Recent Developments
- 12.3. Company Market Share Analysis 2025
- 12.3.1 Top 5 Companies Market Share Analysis
- 12.3.2 Top 3 Companies Market Share Analysis
- 12.4. List of Potential Customers
- 13. Research Methodology
List of Figures
- Figure 1: Global Property and Casualty Insurance Industry in US Revenue Breakdown (Million, %) by Region 2025 & 2033
- Figure 2: North America Property and Casualty Insurance Industry in US Revenue (Million), by Insurance Type 2025 & 2033
- Figure 3: North America Property and Casualty Insurance Industry in US Revenue Share (%), by Insurance Type 2025 & 2033
- Figure 4: North America Property and Casualty Insurance Industry in US Revenue (Million), by Channel of Distribution 2025 & 2033
- Figure 5: North America Property and Casualty Insurance Industry in US Revenue Share (%), by Channel of Distribution 2025 & 2033
- Figure 6: North America Property and Casualty Insurance Industry in US Revenue (Million), by Country 2025 & 2033
- Figure 7: North America Property and Casualty Insurance Industry in US Revenue Share (%), by Country 2025 & 2033
- Figure 8: South America Property and Casualty Insurance Industry in US Revenue (Million), by Insurance Type 2025 & 2033
- Figure 9: South America Property and Casualty Insurance Industry in US Revenue Share (%), by Insurance Type 2025 & 2033
- Figure 10: South America Property and Casualty Insurance Industry in US Revenue (Million), by Channel of Distribution 2025 & 2033
- Figure 11: South America Property and Casualty Insurance Industry in US Revenue Share (%), by Channel of Distribution 2025 & 2033
- Figure 12: South America Property and Casualty Insurance Industry in US Revenue (Million), by Country 2025 & 2033
- Figure 13: South America Property and Casualty Insurance Industry in US Revenue Share (%), by Country 2025 & 2033
- Figure 14: Europe Property and Casualty Insurance Industry in US Revenue (Million), by Insurance Type 2025 & 2033
- Figure 15: Europe Property and Casualty Insurance Industry in US Revenue Share (%), by Insurance Type 2025 & 2033
- Figure 16: Europe Property and Casualty Insurance Industry in US Revenue (Million), by Channel of Distribution 2025 & 2033
- Figure 17: Europe Property and Casualty Insurance Industry in US Revenue Share (%), by Channel of Distribution 2025 & 2033
- Figure 18: Europe Property and Casualty Insurance Industry in US Revenue (Million), by Country 2025 & 2033
- Figure 19: Europe Property and Casualty Insurance Industry in US Revenue Share (%), by Country 2025 & 2033
- Figure 20: Middle East & Africa Property and Casualty Insurance Industry in US Revenue (Million), by Insurance Type 2025 & 2033
- Figure 21: Middle East & Africa Property and Casualty Insurance Industry in US Revenue Share (%), by Insurance Type 2025 & 2033
- Figure 22: Middle East & Africa Property and Casualty Insurance Industry in US Revenue (Million), by Channel of Distribution 2025 & 2033
- Figure 23: Middle East & Africa Property and Casualty Insurance Industry in US Revenue Share (%), by Channel of Distribution 2025 & 2033
- Figure 24: Middle East & Africa Property and Casualty Insurance Industry in US Revenue (Million), by Country 2025 & 2033
- Figure 25: Middle East & Africa Property and Casualty Insurance Industry in US Revenue Share (%), by Country 2025 & 2033
- Figure 26: Asia Pacific Property and Casualty Insurance Industry in US Revenue (Million), by Insurance Type 2025 & 2033
- Figure 27: Asia Pacific Property and Casualty Insurance Industry in US Revenue Share (%), by Insurance Type 2025 & 2033
- Figure 28: Asia Pacific Property and Casualty Insurance Industry in US Revenue (Million), by Channel of Distribution 2025 & 2033
- Figure 29: Asia Pacific Property and Casualty Insurance Industry in US Revenue Share (%), by Channel of Distribution 2025 & 2033
- Figure 30: Asia Pacific Property and Casualty Insurance Industry in US Revenue (Million), by Country 2025 & 2033
- Figure 31: Asia Pacific Property and Casualty Insurance Industry in US Revenue Share (%), by Country 2025 & 2033
List of Tables
- Table 1: Global Property and Casualty Insurance Industry in US Revenue Million Forecast, by Insurance Type 2020 & 2033
- Table 2: Global Property and Casualty Insurance Industry in US Revenue Million Forecast, by Channel of Distribution 2020 & 2033
- Table 3: Global Property and Casualty Insurance Industry in US Revenue Million Forecast, by Region 2020 & 2033
- Table 4: Global Property and Casualty Insurance Industry in US Revenue Million Forecast, by Insurance Type 2020 & 2033
- Table 5: Global Property and Casualty Insurance Industry in US Revenue Million Forecast, by Channel of Distribution 2020 & 2033
- Table 6: Global Property and Casualty Insurance Industry in US Revenue Million Forecast, by Country 2020 & 2033
- Table 7: United States Property and Casualty Insurance Industry in US Revenue (Million) Forecast, by Application 2020 & 2033
- Table 8: Canada Property and Casualty Insurance Industry in US Revenue (Million) Forecast, by Application 2020 & 2033
- Table 9: Mexico Property and Casualty Insurance Industry in US Revenue (Million) Forecast, by Application 2020 & 2033
- Table 10: Global Property and Casualty Insurance Industry in US Revenue Million Forecast, by Insurance Type 2020 & 2033
- Table 11: Global Property and Casualty Insurance Industry in US Revenue Million Forecast, by Channel of Distribution 2020 & 2033
- Table 12: Global Property and Casualty Insurance Industry in US Revenue Million Forecast, by Country 2020 & 2033
- Table 13: Brazil Property and Casualty Insurance Industry in US Revenue (Million) Forecast, by Application 2020 & 2033
- Table 14: Argentina Property and Casualty Insurance Industry in US Revenue (Million) Forecast, by Application 2020 & 2033
- Table 15: Rest of South America Property and Casualty Insurance Industry in US Revenue (Million) Forecast, by Application 2020 & 2033
- Table 16: Global Property and Casualty Insurance Industry in US Revenue Million Forecast, by Insurance Type 2020 & 2033
- Table 17: Global Property and Casualty Insurance Industry in US Revenue Million Forecast, by Channel of Distribution 2020 & 2033
- Table 18: Global Property and Casualty Insurance Industry in US Revenue Million Forecast, by Country 2020 & 2033
- Table 19: United Kingdom Property and Casualty Insurance Industry in US Revenue (Million) Forecast, by Application 2020 & 2033
- Table 20: Germany Property and Casualty Insurance Industry in US Revenue (Million) Forecast, by Application 2020 & 2033
- Table 21: France Property and Casualty Insurance Industry in US Revenue (Million) Forecast, by Application 2020 & 2033
- Table 22: Italy Property and Casualty Insurance Industry in US Revenue (Million) Forecast, by Application 2020 & 2033
- Table 23: Spain Property and Casualty Insurance Industry in US Revenue (Million) Forecast, by Application 2020 & 2033
- Table 24: Russia Property and Casualty Insurance Industry in US Revenue (Million) Forecast, by Application 2020 & 2033
- Table 25: Benelux Property and Casualty Insurance Industry in US Revenue (Million) Forecast, by Application 2020 & 2033
- Table 26: Nordics Property and Casualty Insurance Industry in US Revenue (Million) Forecast, by Application 2020 & 2033
- Table 27: Rest of Europe Property and Casualty Insurance Industry in US Revenue (Million) Forecast, by Application 2020 & 2033
- Table 28: Global Property and Casualty Insurance Industry in US Revenue Million Forecast, by Insurance Type 2020 & 2033
- Table 29: Global Property and Casualty Insurance Industry in US Revenue Million Forecast, by Channel of Distribution 2020 & 2033
- Table 30: Global Property and Casualty Insurance Industry in US Revenue Million Forecast, by Country 2020 & 2033
- Table 31: Turkey Property and Casualty Insurance Industry in US Revenue (Million) Forecast, by Application 2020 & 2033
- Table 32: Israel Property and Casualty Insurance Industry in US Revenue (Million) Forecast, by Application 2020 & 2033
- Table 33: GCC Property and Casualty Insurance Industry in US Revenue (Million) Forecast, by Application 2020 & 2033
- Table 34: North Africa Property and Casualty Insurance Industry in US Revenue (Million) Forecast, by Application 2020 & 2033
- Table 35: South Africa Property and Casualty Insurance Industry in US Revenue (Million) Forecast, by Application 2020 & 2033
- Table 36: Rest of Middle East & Africa Property and Casualty Insurance Industry in US Revenue (Million) Forecast, by Application 2020 & 2033
- Table 37: Global Property and Casualty Insurance Industry in US Revenue Million Forecast, by Insurance Type 2020 & 2033
- Table 38: Global Property and Casualty Insurance Industry in US Revenue Million Forecast, by Channel of Distribution 2020 & 2033
- Table 39: Global Property and Casualty Insurance Industry in US Revenue Million Forecast, by Country 2020 & 2033
- Table 40: China Property and Casualty Insurance Industry in US Revenue (Million) Forecast, by Application 2020 & 2033
- Table 41: India Property and Casualty Insurance Industry in US Revenue (Million) Forecast, by Application 2020 & 2033
- Table 42: Japan Property and Casualty Insurance Industry in US Revenue (Million) Forecast, by Application 2020 & 2033
- Table 43: South Korea Property and Casualty Insurance Industry in US Revenue (Million) Forecast, by Application 2020 & 2033
- Table 44: ASEAN Property and Casualty Insurance Industry in US Revenue (Million) Forecast, by Application 2020 & 2033
- Table 45: Oceania Property and Casualty Insurance Industry in US Revenue (Million) Forecast, by Application 2020 & 2033
- Table 46: Rest of Asia Pacific Property and Casualty Insurance Industry in US Revenue (Million) Forecast, by Application 2020 & 2033
Frequently Asked Questions
1. What is the projected Compound Annual Growth Rate (CAGR) of the Property and Casualty Insurance Industry in US?
The projected CAGR is approximately < 6.00%.
2. Which companies are prominent players in the Property and Casualty Insurance Industry in US?
Key companies in the market include Berkshire Hathaway Inc, American International Group Inc, Liberty Mutual Holding Company Inc, The Progressive Corporation, The Travelers Companies Inc, United Services Automobile Association, Farmers Group Inc, American Family Mutual Insurance Company S I, W R Berkley Corporation, American Financial Group Inc *List Not Exhaustive.
3. What are the main segments of the Property and Casualty Insurance Industry in US?
The market segments include Insurance Type, Channel of Distribution.
4. Can you provide details about the market size?
The market size is estimated to be USD XX Million as of 2022.
5. What are some drivers contributing to market growth?
N/A
6. What are the notable trends driving market growth?
RPA is Going to Help in Quick Process:.
7. Are there any restraints impacting market growth?
N/A
8. Can you provide examples of recent developments in the market?
N/A
9. What pricing options are available for accessing the report?
Pricing options include single-user, multi-user, and enterprise licenses priced at USD 3800, USD 4500, and USD 5800 respectively.
10. Is the market size provided in terms of value or volume?
The market size is provided in terms of value, measured in Million.
11. Are there any specific market keywords associated with the report?
Yes, the market keyword associated with the report is "Property and Casualty Insurance Industry in US," which aids in identifying and referencing the specific market segment covered.
12. How do I determine which pricing option suits my needs best?
The pricing options vary based on user requirements and access needs. Individual users may opt for single-user licenses, while businesses requiring broader access may choose multi-user or enterprise licenses for cost-effective access to the report.
13. Are there any additional resources or data provided in the Property and Casualty Insurance Industry in US report?
While the report offers comprehensive insights, it's advisable to review the specific contents or supplementary materials provided to ascertain if additional resources or data are available.
14. How can I stay updated on further developments or reports in the Property and Casualty Insurance Industry in US?
To stay informed about further developments, trends, and reports in the Property and Casualty Insurance Industry in US, consider subscribing to industry newsletters, following relevant companies and organizations, or regularly checking reputable industry news sources and publications.
Methodology
Step 1 - Identification of Relevant Samples Size from Population Database


Step 2 - Approaches for Defining Global Market Size (Value, Volume* & Price*)

Note*: In applicable scenarios
Step 3 - Data Sources
Primary Research
- Web Analytics
- Survey Reports
- Research Institute
- Latest Research Reports
- Opinion Leaders
Secondary Research
- Annual Reports
- White Paper
- Latest Press Release
- Industry Association
- Paid Database
- Investor Presentations

Step 4 - Data Triangulation
Involves using different sources of information in order to increase the validity of a study
These sources are likely to be stakeholders in a program - participants, other researchers, program staff, other community members, and so on.
Then we put all data in single framework & apply various statistical tools to find out the dynamic on the market.
During the analysis stage, feedback from the stakeholder groups would be compared to determine areas of agreement as well as areas of divergence