

Key Insights
The global Power Battery for Heavy Electric Vehicles market is poised for significant expansion, projected to reach an estimated market size of $32,500 million by 2025, driven by a robust Compound Annual Growth Rate (CAGR) of 18.5% during the forecast period of 2025-2033. This substantial growth is primarily fueled by the increasing demand for sustainable logistics solutions and stringent government regulations aimed at reducing emissions in the transportation sector. Key drivers include the growing adoption of electric buses and trucks across North America and Europe, spurred by fleet electrification initiatives and the availability of advanced battery technologies like Lithium Iron Phosphate (LFP) and Lithium Manganate (LMO). The rising awareness of environmental impact and the pursuit of operational cost savings through reduced fuel consumption are further accelerating this market's trajectory. Companies are investing heavily in research and development to enhance battery performance, energy density, and charging speeds, thereby addressing range anxiety and improving the overall efficiency of heavy electric vehicles.
Power Battery for Heavy Electric Vehicles Market Size (In Billion)
The market landscape is characterized by intense competition and strategic collaborations among major players such as CATL, BYD, LG Energy, and Samsung, alongside emerging innovators like REFIRE and FTXT Energy. These companies are focusing on expanding their manufacturing capacities and product portfolios to cater to the diverse needs of the heavy-duty vehicle segment. While the market presents immense opportunities, it also faces certain restraints, including the high initial cost of electric heavy vehicles and the development of robust charging infrastructure. However, advancements in battery technology, government incentives, and declining battery costs are expected to mitigate these challenges. The Asia Pacific region, particularly China, is leading in terms of market size and growth due to strong governmental support for electric mobility and a well-established battery manufacturing ecosystem. Nonetheless, significant growth is also anticipated in North America and Europe as these regions ramp up their electrification efforts for commercial fleets. The integration of fuel cells is also emerging as a complementary technology, offering a pathway for longer-range applications.

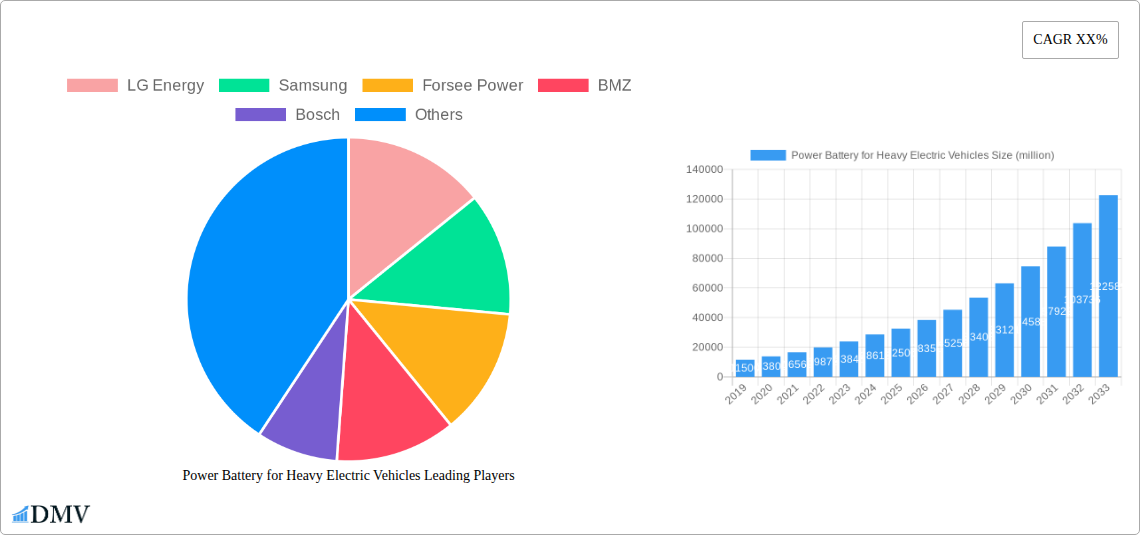
Power Battery for Heavy Electric Vehicles Company Market Share
Power Battery for Heavy Electric Vehicles Market Composition & Trends
The heavy electric vehicle (EV) power battery market is experiencing dynamic shifts, driven by escalating demand for sustainable logistics solutions and stringent emission regulations. Market concentration is moderate, with a few key players like CATL, BYD, and LG Energy holding significant market share, estimated at over $50,000 million combined. Innovation catalysts are abundant, including advancements in battery chemistries, energy density, and charging speeds. The regulatory landscape is increasingly favorable, with government incentives and mandates pushing for EV adoption, particularly in the bus and truck segments. Substitute products, such as hydrogen fuel cells (e.g., REFIRE, FTXT Energy), are emerging as viable alternatives, albeit with differing infrastructure requirements. End-user profiles are diverse, ranging from large fleet operators seeking reduced operational costs to municipalities aiming to improve air quality. Mergers and acquisitions (M&A) are a notable trend, as companies like Samsung SDI and Forsee Power strategically acquire smaller players or form joint ventures to expand their technological capabilities and market reach. M&A deal values in the last three years are estimated to be in the range of $10,000 million to $15,000 million, reflecting the strategic importance of consolidating expertise and resources.
- Market Share Distribution: Leading players like CATL and BYD account for an estimated 60% of the global heavy EV power battery market.
- Innovation Focus: Key areas include solid-state batteries, improved thermal management systems, and faster charging technologies.
- Regulatory Impact: Subsidies and emissions standards are primary drivers for fleet electrification.
- Emerging Alternatives: Hydrogen Fuel Cell technology is gaining traction for long-haul heavy-duty applications.
- M&A Drivers: Strategic acquisitions are focused on securing raw material supply, expanding production capacity, and acquiring advanced battery management systems.
Power Battery for Heavy Electric Vehicles Industry Evolution
The evolution of the power battery for heavy electric vehicles industry is a compelling narrative of rapid technological advancement, escalating market penetration, and a significant shift in consumer and industrial demand. Over the historical period of 2019–2024, the market has witnessed exponential growth, fueled by increasing environmental consciousness and the imperative to decarbonize the transportation sector. Initial adoption was primarily driven by urban bus fleets, where shorter routes and predictable charging infrastructure made electric powertrains more feasible. However, significant breakthroughs in battery energy density and longevity have paved the way for the electrification of heavy-duty trucks, long-haul logistics, and even specialized industrial vehicles. The base year of 2025 is projected to mark a pivotal point, with a projected market size exceeding $70,000 million. This growth is underpinned by continuous research and development, leading to more robust, efficient, and cost-effective battery solutions.
Technological advancements have been particularly transformative. The transition from earlier battery chemistries to Lithium Iron Phosphate (LFP) batteries, favored for their safety and longer lifespan, and Lithium Manganate (LMO) batteries, offering good energy density, has been a key trend. Companies like EVE Energy and RiseSun MGL have been at the forefront of optimizing these chemistries for demanding heavy-duty applications. Furthermore, advancements in Battery Management Systems (BMS) have become critical for ensuring safety, optimizing performance, and extending battery life. The integration of advanced cooling systems and robust housing materials further enhances the durability of these power sources in harsh operating environments.
Shifting consumer demands, or rather, fleet operator demands, are equally influential. The total cost of ownership (TCO) has become a primary consideration, with electric powertrains now demonstrating competitive advantages over their internal combustion engine (ICE) counterparts due to lower fuel and maintenance costs. This economic incentive, coupled with the reputational benefits of operating a sustainable fleet, is driving widespread adoption across various segments, including last-mile delivery vehicles and long-haul freight. The forecast period of 2025–2033 is expected to see continued robust growth, with the market projected to reach over $200,000 million by 2033. This trajectory is supported by ongoing improvements in charging infrastructure, battery recycling technologies, and the development of next-generation battery chemistries like solid-state batteries, which promise even higher energy densities and faster charging capabilities. The increasing involvement of major automotive manufacturers and specialized battery producers such as Forsee Power, BMZ, Bosch, and Microvast highlights the industry's maturity and its commitment to a fully electrified future for heavy transport.
Leading Regions, Countries, or Segments in Power Battery for Heavy Electric Vehicles
The global power battery for heavy electric vehicles market is characterized by distinct regional dominance and segment leadership, driven by a confluence of factors including regulatory mandates, investment trends, and the presence of key industry players. As of the base year 2025, China stands out as the undisputed leader in both production and adoption of heavy electric vehicles and their associated power batteries. This leadership is directly attributable to aggressive government policies, substantial domestic demand for electric buses and trucks, and the sheer manufacturing prowess of Chinese battery giants like CATL, BYD, and Gotion High-tech. The Chinese market alone is estimated to account for over 60% of global heavy EV battery sales.
- Dominant Region: Asia-Pacific, primarily China, leads due to strong government support, extensive manufacturing capabilities, and early adoption of electric buses and trucks.
- Key Drivers in China:
- National policies promoting new energy vehicles (NEVs).
- Extensive charging infrastructure development.
- Significant investment in battery R&D and production by CATL, BYD, and Gotion High-tech.
- Growing demand from logistics and public transportation sectors.
- Key Drivers in China:
- Dominant Application Segment: The Bus segment has historically led the heavy EV power battery market due to its suitability for predictable urban routes and the strong push for cleaner public transportation. However, the Truck segment is rapidly gaining momentum, projected to surpass buses in market value by the end of the forecast period, driven by advancements in battery technology enabling longer ranges and heavier payloads.
- Bus Segment Drivers:
- Urban air quality initiatives.
- Lower operational costs for fixed routes.
- Government subsidies for public transit electrification.
- Truck Segment Drivers:
- Increasing battery energy density and performance.
- Electrification of last-mile delivery and regional haulage.
- Corporate sustainability goals among logistics companies.
- Bus Segment Drivers:
- Dominant Battery Type: Lithium Iron Phosphate (LFP) Battery commands the largest market share within the heavy EV sector. Its superior safety profile, extended cycle life, and lower cost compared to other lithium-ion chemistries make it the preferred choice for demanding, high-utilization applications like heavy-duty vehicles. While Lithium Manganate (LMO) batteries offer good performance, and Fuel Cells (e.g., those from REFIRE, FTXT Energy) are emerging for specific niches, LFP's widespread adoption and cost-effectiveness solidify its current leadership.
- LFP Battery Advantages:
- Enhanced safety and thermal stability.
- Longer operational lifespan.
- Cost-competitiveness.
- Abundant and ethically sourced raw materials.
- LFP Battery Advantages:
North America and Europe are also significant markets, albeit with different growth drivers. The US is experiencing rapid growth in electric truck adoption, spurred by corporate fleet commitments and investments from companies like Nikola (though not explicitly listed, a relevant player in this context). European nations are at the forefront of regulatory initiatives, pushing for carbon neutrality and incentivizing the transition to electric heavy-duty vehicles, with companies like Forsee Power and BMZ playing crucial roles in supplying these markets.
Power Battery for Heavy Electric Vehicles Product Innovations
Product innovations in the heavy electric vehicle power battery sector are relentlessly focused on enhancing energy density, extending cycle life, improving safety, and accelerating charging times to meet the rigorous demands of commercial transport. Leading companies like CATL, LG Energy, and Samsung SDI are pioneering advancements in battery chemistries, moving towards higher nickel content in NMC (Nickel Manganese Cobalt) batteries for trucks requiring longer ranges, while reinforcing LFP batteries for buses and other high-utilization applications where safety and longevity are paramount. Forsee Power and BMZ are concentrating on robust thermal management systems and integrated battery pack designs that can withstand extreme operating conditions. Microvast is pushing the boundaries with its ultra-fast charging technologies, enabling commercial fleets to minimize downtime. The integration of advanced Battery Management Systems (BMS) developed by companies like Bosch is crucial for optimizing performance, predictive maintenance, and ensuring the safe operation of these high-voltage, high-capacity batteries.
Propelling Factors for Power Battery for Heavy Electric Vehicles Growth
The surge in power battery adoption for heavy electric vehicles is propelled by a potent combination of technological advancements, economic imperatives, and supportive regulatory frameworks. Technological leaps in battery energy density and charging speeds are making electric powertrains increasingly viable for long-haul trucking and high-demand bus routes. Economically, the declining total cost of ownership (TCO) for electric vehicles, due to lower energy and maintenance costs compared to diesel equivalents, is a significant growth catalyst. Furthermore, stringent government mandates and emission reduction targets globally are compelling fleet operators to transition to cleaner alternatives. Investments from major players like BYD and Gotion High-tech in expanding production capacity further solidify this growth trajectory.
Obstacles in the Power Battery for Heavy Electric Vehicles Market
Despite significant growth, the power battery for heavy electric vehicles market faces several critical obstacles. High upfront costs remain a deterrent, although declining battery prices are mitigating this. Charging infrastructure deployment at the scale required for heavy-duty commercial vehicles is a substantial challenge, particularly for long-haul routes. Supply chain volatility for critical raw materials like lithium and cobalt can lead to price fluctuations and production disruptions. Grid capacity limitations in certain regions can also hinder widespread adoption. Furthermore, establishing robust battery recycling and second-life applications is essential for long-term sustainability and managing end-of-life batteries.
Future Opportunities in Power Battery for Heavy Electric Vehicles
The future of power batteries for heavy electric vehicles is ripe with opportunities. The continuous development of solid-state battery technology promises higher energy densities, faster charging, and enhanced safety, unlocking new possibilities for longer-range applications. The growing demand for electrified special-purpose vehicles, such as refuse trucks and construction equipment, presents significant untapped markets. The expansion of charging infrastructure supported by innovative business models and government incentives will accelerate adoption. Furthermore, advancements in battery-as-a-service (BaaS) models and enhanced battery analytics for predictive maintenance will further improve the economic viability and operational efficiency of electric heavy-duty fleets.
Major Players in the Power Battery for Heavy Electric Vehicles Ecosystem
- CATL
- BYD
- LG Energy
- Samsung
- Forsee Power
- BMZ
- Bosch
- RiseSun MGL
- EVE
- SHPT
- Gotion High-tech
- Microvast
- Sinosynergy
- REFIRE
- FTXT Energy
Key Developments in Power Battery for Heavy Electric Vehicles Industry
- 2023: CATL unveils its new generation of LFP batteries with significantly improved energy density, aiming to extend the range of heavy-duty trucks.
- 2023: BYD announces substantial investments in expanding its electric truck battery production capacity to meet surging demand.
- 2023: Forsee Power partners with a major European truck manufacturer to supply advanced battery solutions for their electric truck models.
- 2024: LG Energy Solution secures new long-term supply agreements for EV batteries, including those for heavy-duty applications.
- 2024: Microvast showcases its latest ultra-fast charging battery technology, significantly reducing charging times for commercial vehicles.
- 2024: REFIRE and FTXT Energy continue to advance hydrogen fuel cell technology for heavy-duty trucks, positioning it as a key alternative for long-haul logistics.
- 2024: Bosch intensifies its research and development efforts in advanced battery management systems tailored for the unique requirements of heavy EVs.
- 2025: Gotion High-tech aims to commence production of its next-generation LFP batteries with enhanced performance characteristics.
- 2025: The market anticipates new product launches from EVE and RiseSun MGL focusing on cost-effective and durable battery solutions for heavy-duty applications.
- 2025: SHPT is expected to announce strategic collaborations to bolster its market presence in the heavy EV battery sector.
Strategic Power Battery for Heavy Electric Vehicles Market Forecast
The strategic forecast for the power battery for heavy electric vehicles market projects sustained and robust growth through 2033. This optimistic outlook is underpinned by ongoing technological advancements, particularly in battery chemistries like LFP and emerging solid-state technologies, which promise higher energy densities and faster charging capabilities. The economic viability of electric heavy-duty vehicles, driven by a decreasing total cost of ownership and favorable operating economics, will continue to be a primary growth catalyst. Furthermore, increasingly stringent global emissions regulations and corporate sustainability initiatives will compel a rapid transition away from internal combustion engines. The expanding charging infrastructure and supportive government policies will further accelerate market penetration across bus and truck segments, solidifying the dominance of electric powertrains in heavy transportation.
Power Battery for Heavy Electric Vehicles Segmentation
-
1. Application
- 1.1. Bus
- 1.2. Truck
-
2. Types
- 2.1. Lithium Iron Phosphate Battery
- 2.2. Lithium Manganate Battery
- 2.3. Fuel Cell
Power Battery for Heavy Electric Vehicles Segmentation By Geography
-
1. North America
- 1.1. United States
- 1.2. Canada
- 1.3. Mexico
-
2. South America
- 2.1. Brazil
- 2.2. Argentina
- 2.3. Rest of South America
-
3. Europe
- 3.1. United Kingdom
- 3.2. Germany
- 3.3. France
- 3.4. Italy
- 3.5. Spain
- 3.6. Russia
- 3.7. Benelux
- 3.8. Nordics
- 3.9. Rest of Europe
-
4. Middle East & Africa
- 4.1. Turkey
- 4.2. Israel
- 4.3. GCC
- 4.4. North Africa
- 4.5. South Africa
- 4.6. Rest of Middle East & Africa
-
5. Asia Pacific
- 5.1. China
- 5.2. India
- 5.3. Japan
- 5.4. South Korea
- 5.5. ASEAN
- 5.6. Oceania
- 5.7. Rest of Asia Pacific
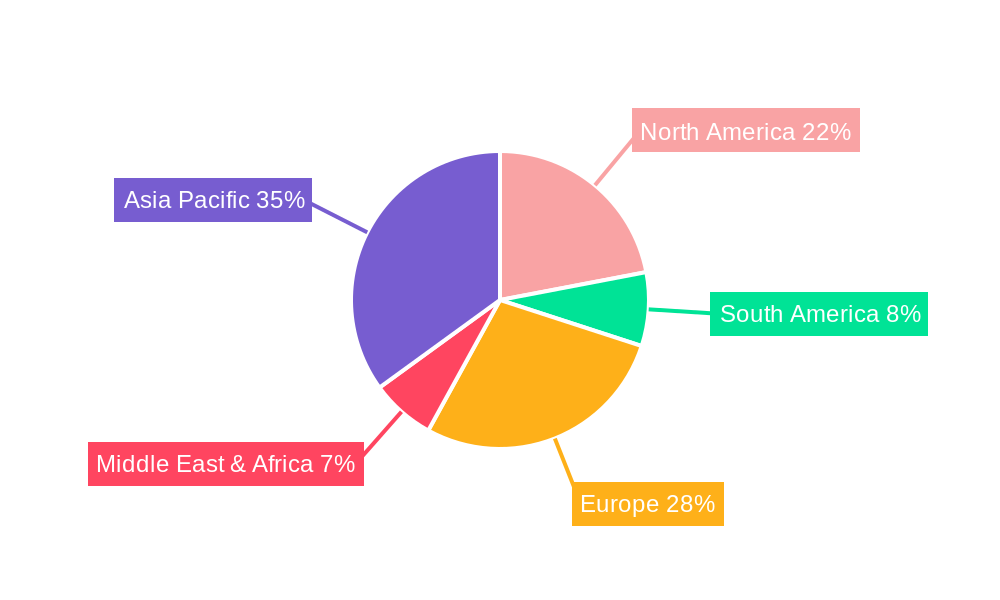
Power Battery for Heavy Electric Vehicles Regional Market Share
Geographic Coverage of Power Battery for Heavy Electric Vehicles
Power Battery for Heavy Electric Vehicles REPORT HIGHLIGHTS
| Aspects | Details |
|---|---|
| Study Period | 2020-2034 |
| Base Year | 2025 |
| Estimated Year | 2026 |
| Forecast Period | 2026-2034 |
| Historical Period | 2020-2025 |
| Growth Rate | CAGR of 25% from 2020-2034 |
| Segmentation |
|
Table of Contents
- 1. Introduction
- 1.1. Research Scope
- 1.2. Market Segmentation
- 1.3. Research Methodology
- 1.4. Definitions and Assumptions
- 2. Executive Summary
- 2.1. Introduction
- 3. Market Dynamics
- 3.1. Introduction
- 3.2. Market Drivers
- 3.3. Market Restrains
- 3.4. Market Trends
- 4. Market Factor Analysis
- 4.1. Porters Five Forces
- 4.2. Supply/Value Chain
- 4.3. PESTEL analysis
- 4.4. Market Entropy
- 4.5. Patent/Trademark Analysis
- 5. Global Power Battery for Heavy Electric Vehicles Analysis, Insights and Forecast, 2020-2032
- 5.1. Market Analysis, Insights and Forecast - by Application
- 5.1.1. Bus
- 5.1.2. Truck
- 5.2. Market Analysis, Insights and Forecast - by Types
- 5.2.1. Lithium Iron Phosphate Battery
- 5.2.2. Lithium Manganate Battery
- 5.2.3. Fuel Cell
- 5.3. Market Analysis, Insights and Forecast - by Region
- 5.3.1. North America
- 5.3.2. South America
- 5.3.3. Europe
- 5.3.4. Middle East & Africa
- 5.3.5. Asia Pacific
- 5.1. Market Analysis, Insights and Forecast - by Application
- 6. North America Power Battery for Heavy Electric Vehicles Analysis, Insights and Forecast, 2020-2032
- 6.1. Market Analysis, Insights and Forecast - by Application
- 6.1.1. Bus
- 6.1.2. Truck
- 6.2. Market Analysis, Insights and Forecast - by Types
- 6.2.1. Lithium Iron Phosphate Battery
- 6.2.2. Lithium Manganate Battery
- 6.2.3. Fuel Cell
- 6.1. Market Analysis, Insights and Forecast - by Application
- 7. South America Power Battery for Heavy Electric Vehicles Analysis, Insights and Forecast, 2020-2032
- 7.1. Market Analysis, Insights and Forecast - by Application
- 7.1.1. Bus
- 7.1.2. Truck
- 7.2. Market Analysis, Insights and Forecast - by Types
- 7.2.1. Lithium Iron Phosphate Battery
- 7.2.2. Lithium Manganate Battery
- 7.2.3. Fuel Cell
- 7.1. Market Analysis, Insights and Forecast - by Application
- 8. Europe Power Battery for Heavy Electric Vehicles Analysis, Insights and Forecast, 2020-2032
- 8.1. Market Analysis, Insights and Forecast - by Application
- 8.1.1. Bus
- 8.1.2. Truck
- 8.2. Market Analysis, Insights and Forecast - by Types
- 8.2.1. Lithium Iron Phosphate Battery
- 8.2.2. Lithium Manganate Battery
- 8.2.3. Fuel Cell
- 8.1. Market Analysis, Insights and Forecast - by Application
- 9. Middle East & Africa Power Battery for Heavy Electric Vehicles Analysis, Insights and Forecast, 2020-2032
- 9.1. Market Analysis, Insights and Forecast - by Application
- 9.1.1. Bus
- 9.1.2. Truck
- 9.2. Market Analysis, Insights and Forecast - by Types
- 9.2.1. Lithium Iron Phosphate Battery
- 9.2.2. Lithium Manganate Battery
- 9.2.3. Fuel Cell
- 9.1. Market Analysis, Insights and Forecast - by Application
- 10. Asia Pacific Power Battery for Heavy Electric Vehicles Analysis, Insights and Forecast, 2020-2032
- 10.1. Market Analysis, Insights and Forecast - by Application
- 10.1.1. Bus
- 10.1.2. Truck
- 10.2. Market Analysis, Insights and Forecast - by Types
- 10.2.1. Lithium Iron Phosphate Battery
- 10.2.2. Lithium Manganate Battery
- 10.2.3. Fuel Cell
- 10.1. Market Analysis, Insights and Forecast - by Application
- 11. Competitive Analysis
- 11.1. Global Market Share Analysis 2025
- 11.2. Company Profiles
- 11.2.1 LG Energy
- 11.2.1.1. Overview
- 11.2.1.2. Products
- 11.2.1.3. SWOT Analysis
- 11.2.1.4. Recent Developments
- 11.2.1.5. Financials (Based on Availability)
- 11.2.2 Samsung
- 11.2.2.1. Overview
- 11.2.2.2. Products
- 11.2.2.3. SWOT Analysis
- 11.2.2.4. Recent Developments
- 11.2.2.5. Financials (Based on Availability)
- 11.2.3 Forsee Power
- 11.2.3.1. Overview
- 11.2.3.2. Products
- 11.2.3.3. SWOT Analysis
- 11.2.3.4. Recent Developments
- 11.2.3.5. Financials (Based on Availability)
- 11.2.4 BMZ
- 11.2.4.1. Overview
- 11.2.4.2. Products
- 11.2.4.3. SWOT Analysis
- 11.2.4.4. Recent Developments
- 11.2.4.5. Financials (Based on Availability)
- 11.2.5 Bosch
- 11.2.5.1. Overview
- 11.2.5.2. Products
- 11.2.5.3. SWOT Analysis
- 11.2.5.4. Recent Developments
- 11.2.5.5. Financials (Based on Availability)
- 11.2.6 RiseSun MGL
- 11.2.6.1. Overview
- 11.2.6.2. Products
- 11.2.6.3. SWOT Analysis
- 11.2.6.4. Recent Developments
- 11.2.6.5. Financials (Based on Availability)
- 11.2.7 EVE
- 11.2.7.1. Overview
- 11.2.7.2. Products
- 11.2.7.3. SWOT Analysis
- 11.2.7.4. Recent Developments
- 11.2.7.5. Financials (Based on Availability)
- 11.2.8 CATL
- 11.2.8.1. Overview
- 11.2.8.2. Products
- 11.2.8.3. SWOT Analysis
- 11.2.8.4. Recent Developments
- 11.2.8.5. Financials (Based on Availability)
- 11.2.9 SHPT
- 11.2.9.1. Overview
- 11.2.9.2. Products
- 11.2.9.3. SWOT Analysis
- 11.2.9.4. Recent Developments
- 11.2.9.5. Financials (Based on Availability)
- 11.2.10 Gotion High-tech
- 11.2.10.1. Overview
- 11.2.10.2. Products
- 11.2.10.3. SWOT Analysis
- 11.2.10.4. Recent Developments
- 11.2.10.5. Financials (Based on Availability)
- 11.2.11 Microvast
- 11.2.11.1. Overview
- 11.2.11.2. Products
- 11.2.11.3. SWOT Analysis
- 11.2.11.4. Recent Developments
- 11.2.11.5. Financials (Based on Availability)
- 11.2.12 BYD
- 11.2.12.1. Overview
- 11.2.12.2. Products
- 11.2.12.3. SWOT Analysis
- 11.2.12.4. Recent Developments
- 11.2.12.5. Financials (Based on Availability)
- 11.2.13 Sinosynergy
- 11.2.13.1. Overview
- 11.2.13.2. Products
- 11.2.13.3. SWOT Analysis
- 11.2.13.4. Recent Developments
- 11.2.13.5. Financials (Based on Availability)
- 11.2.14 REFIRE
- 11.2.14.1. Overview
- 11.2.14.2. Products
- 11.2.14.3. SWOT Analysis
- 11.2.14.4. Recent Developments
- 11.2.14.5. Financials (Based on Availability)
- 11.2.15 FTXT Energy
- 11.2.15.1. Overview
- 11.2.15.2. Products
- 11.2.15.3. SWOT Analysis
- 11.2.15.4. Recent Developments
- 11.2.15.5. Financials (Based on Availability)
- 11.2.1 LG Energy
List of Figures
- Figure 1: Global Power Battery for Heavy Electric Vehicles Revenue Breakdown (undefined, %) by Region 2025 & 2033
- Figure 2: Global Power Battery for Heavy Electric Vehicles Volume Breakdown (K, %) by Region 2025 & 2033
- Figure 3: North America Power Battery for Heavy Electric Vehicles Revenue (undefined), by Application 2025 & 2033
- Figure 4: North America Power Battery for Heavy Electric Vehicles Volume (K), by Application 2025 & 2033
- Figure 5: North America Power Battery for Heavy Electric Vehicles Revenue Share (%), by Application 2025 & 2033
- Figure 6: North America Power Battery for Heavy Electric Vehicles Volume Share (%), by Application 2025 & 2033
- Figure 7: North America Power Battery for Heavy Electric Vehicles Revenue (undefined), by Types 2025 & 2033
- Figure 8: North America Power Battery for Heavy Electric Vehicles Volume (K), by Types 2025 & 2033
- Figure 9: North America Power Battery for Heavy Electric Vehicles Revenue Share (%), by Types 2025 & 2033
- Figure 10: North America Power Battery for Heavy Electric Vehicles Volume Share (%), by Types 2025 & 2033
- Figure 11: North America Power Battery for Heavy Electric Vehicles Revenue (undefined), by Country 2025 & 2033
- Figure 12: North America Power Battery for Heavy Electric Vehicles Volume (K), by Country 2025 & 2033
- Figure 13: North America Power Battery for Heavy Electric Vehicles Revenue Share (%), by Country 2025 & 2033
- Figure 14: North America Power Battery for Heavy Electric Vehicles Volume Share (%), by Country 2025 & 2033
- Figure 15: South America Power Battery for Heavy Electric Vehicles Revenue (undefined), by Application 2025 & 2033
- Figure 16: South America Power Battery for Heavy Electric Vehicles Volume (K), by Application 2025 & 2033
- Figure 17: South America Power Battery for Heavy Electric Vehicles Revenue Share (%), by Application 2025 & 2033
- Figure 18: South America Power Battery for Heavy Electric Vehicles Volume Share (%), by Application 2025 & 2033
- Figure 19: South America Power Battery for Heavy Electric Vehicles Revenue (undefined), by Types 2025 & 2033
- Figure 20: South America Power Battery for Heavy Electric Vehicles Volume (K), by Types 2025 & 2033
- Figure 21: South America Power Battery for Heavy Electric Vehicles Revenue Share (%), by Types 2025 & 2033
- Figure 22: South America Power Battery for Heavy Electric Vehicles Volume Share (%), by Types 2025 & 2033
- Figure 23: South America Power Battery for Heavy Electric Vehicles Revenue (undefined), by Country 2025 & 2033
- Figure 24: South America Power Battery for Heavy Electric Vehicles Volume (K), by Country 2025 & 2033
- Figure 25: South America Power Battery for Heavy Electric Vehicles Revenue Share (%), by Country 2025 & 2033
- Figure 26: South America Power Battery for Heavy Electric Vehicles Volume Share (%), by Country 2025 & 2033
- Figure 27: Europe Power Battery for Heavy Electric Vehicles Revenue (undefined), by Application 2025 & 2033
- Figure 28: Europe Power Battery for Heavy Electric Vehicles Volume (K), by Application 2025 & 2033
- Figure 29: Europe Power Battery for Heavy Electric Vehicles Revenue Share (%), by Application 2025 & 2033
- Figure 30: Europe Power Battery for Heavy Electric Vehicles Volume Share (%), by Application 2025 & 2033
- Figure 31: Europe Power Battery for Heavy Electric Vehicles Revenue (undefined), by Types 2025 & 2033
- Figure 32: Europe Power Battery for Heavy Electric Vehicles Volume (K), by Types 2025 & 2033
- Figure 33: Europe Power Battery for Heavy Electric Vehicles Revenue Share (%), by Types 2025 & 2033
- Figure 34: Europe Power Battery for Heavy Electric Vehicles Volume Share (%), by Types 2025 & 2033
- Figure 35: Europe Power Battery for Heavy Electric Vehicles Revenue (undefined), by Country 2025 & 2033
- Figure 36: Europe Power Battery for Heavy Electric Vehicles Volume (K), by Country 2025 & 2033
- Figure 37: Europe Power Battery for Heavy Electric Vehicles Revenue Share (%), by Country 2025 & 2033
- Figure 38: Europe Power Battery for Heavy Electric Vehicles Volume Share (%), by Country 2025 & 2033
- Figure 39: Middle East & Africa Power Battery for Heavy Electric Vehicles Revenue (undefined), by Application 2025 & 2033
- Figure 40: Middle East & Africa Power Battery for Heavy Electric Vehicles Volume (K), by Application 2025 & 2033
- Figure 41: Middle East & Africa Power Battery for Heavy Electric Vehicles Revenue Share (%), by Application 2025 & 2033
- Figure 42: Middle East & Africa Power Battery for Heavy Electric Vehicles Volume Share (%), by Application 2025 & 2033
- Figure 43: Middle East & Africa Power Battery for Heavy Electric Vehicles Revenue (undefined), by Types 2025 & 2033
- Figure 44: Middle East & Africa Power Battery for Heavy Electric Vehicles Volume (K), by Types 2025 & 2033
- Figure 45: Middle East & Africa Power Battery for Heavy Electric Vehicles Revenue Share (%), by Types 2025 & 2033
- Figure 46: Middle East & Africa Power Battery for Heavy Electric Vehicles Volume Share (%), by Types 2025 & 2033
- Figure 47: Middle East & Africa Power Battery for Heavy Electric Vehicles Revenue (undefined), by Country 2025 & 2033
- Figure 48: Middle East & Africa Power Battery for Heavy Electric Vehicles Volume (K), by Country 2025 & 2033
- Figure 49: Middle East & Africa Power Battery for Heavy Electric Vehicles Revenue Share (%), by Country 2025 & 2033
- Figure 50: Middle East & Africa Power Battery for Heavy Electric Vehicles Volume Share (%), by Country 2025 & 2033
- Figure 51: Asia Pacific Power Battery for Heavy Electric Vehicles Revenue (undefined), by Application 2025 & 2033
- Figure 52: Asia Pacific Power Battery for Heavy Electric Vehicles Volume (K), by Application 2025 & 2033
- Figure 53: Asia Pacific Power Battery for Heavy Electric Vehicles Revenue Share (%), by Application 2025 & 2033
- Figure 54: Asia Pacific Power Battery for Heavy Electric Vehicles Volume Share (%), by Application 2025 & 2033
- Figure 55: Asia Pacific Power Battery for Heavy Electric Vehicles Revenue (undefined), by Types 2025 & 2033
- Figure 56: Asia Pacific Power Battery for Heavy Electric Vehicles Volume (K), by Types 2025 & 2033
- Figure 57: Asia Pacific Power Battery for Heavy Electric Vehicles Revenue Share (%), by Types 2025 & 2033
- Figure 58: Asia Pacific Power Battery for Heavy Electric Vehicles Volume Share (%), by Types 2025 & 2033
- Figure 59: Asia Pacific Power Battery for Heavy Electric Vehicles Revenue (undefined), by Country 2025 & 2033
- Figure 60: Asia Pacific Power Battery for Heavy Electric Vehicles Volume (K), by Country 2025 & 2033
- Figure 61: Asia Pacific Power Battery for Heavy Electric Vehicles Revenue Share (%), by Country 2025 & 2033
- Figure 62: Asia Pacific Power Battery for Heavy Electric Vehicles Volume Share (%), by Country 2025 & 2033
List of Tables
- Table 1: Global Power Battery for Heavy Electric Vehicles Revenue undefined Forecast, by Application 2020 & 2033
- Table 2: Global Power Battery for Heavy Electric Vehicles Volume K Forecast, by Application 2020 & 2033
- Table 3: Global Power Battery for Heavy Electric Vehicles Revenue undefined Forecast, by Types 2020 & 2033
- Table 4: Global Power Battery for Heavy Electric Vehicles Volume K Forecast, by Types 2020 & 2033
- Table 5: Global Power Battery for Heavy Electric Vehicles Revenue undefined Forecast, by Region 2020 & 2033
- Table 6: Global Power Battery for Heavy Electric Vehicles Volume K Forecast, by Region 2020 & 2033
- Table 7: Global Power Battery for Heavy Electric Vehicles Revenue undefined Forecast, by Application 2020 & 2033
- Table 8: Global Power Battery for Heavy Electric Vehicles Volume K Forecast, by Application 2020 & 2033
- Table 9: Global Power Battery for Heavy Electric Vehicles Revenue undefined Forecast, by Types 2020 & 2033
- Table 10: Global Power Battery for Heavy Electric Vehicles Volume K Forecast, by Types 2020 & 2033
- Table 11: Global Power Battery for Heavy Electric Vehicles Revenue undefined Forecast, by Country 2020 & 2033
- Table 12: Global Power Battery for Heavy Electric Vehicles Volume K Forecast, by Country 2020 & 2033
- Table 13: United States Power Battery for Heavy Electric Vehicles Revenue (undefined) Forecast, by Application 2020 & 2033
- Table 14: United States Power Battery for Heavy Electric Vehicles Volume (K) Forecast, by Application 2020 & 2033
- Table 15: Canada Power Battery for Heavy Electric Vehicles Revenue (undefined) Forecast, by Application 2020 & 2033
- Table 16: Canada Power Battery for Heavy Electric Vehicles Volume (K) Forecast, by Application 2020 & 2033
- Table 17: Mexico Power Battery for Heavy Electric Vehicles Revenue (undefined) Forecast, by Application 2020 & 2033
- Table 18: Mexico Power Battery for Heavy Electric Vehicles Volume (K) Forecast, by Application 2020 & 2033
- Table 19: Global Power Battery for Heavy Electric Vehicles Revenue undefined Forecast, by Application 2020 & 2033
- Table 20: Global Power Battery for Heavy Electric Vehicles Volume K Forecast, by Application 2020 & 2033
- Table 21: Global Power Battery for Heavy Electric Vehicles Revenue undefined Forecast, by Types 2020 & 2033
- Table 22: Global Power Battery for Heavy Electric Vehicles Volume K Forecast, by Types 2020 & 2033
- Table 23: Global Power Battery for Heavy Electric Vehicles Revenue undefined Forecast, by Country 2020 & 2033
- Table 24: Global Power Battery for Heavy Electric Vehicles Volume K Forecast, by Country 2020 & 2033
- Table 25: Brazil Power Battery for Heavy Electric Vehicles Revenue (undefined) Forecast, by Application 2020 & 2033
- Table 26: Brazil Power Battery for Heavy Electric Vehicles Volume (K) Forecast, by Application 2020 & 2033
- Table 27: Argentina Power Battery for Heavy Electric Vehicles Revenue (undefined) Forecast, by Application 2020 & 2033
- Table 28: Argentina Power Battery for Heavy Electric Vehicles Volume (K) Forecast, by Application 2020 & 2033
- Table 29: Rest of South America Power Battery for Heavy Electric Vehicles Revenue (undefined) Forecast, by Application 2020 & 2033
- Table 30: Rest of South America Power Battery for Heavy Electric Vehicles Volume (K) Forecast, by Application 2020 & 2033
- Table 31: Global Power Battery for Heavy Electric Vehicles Revenue undefined Forecast, by Application 2020 & 2033
- Table 32: Global Power Battery for Heavy Electric Vehicles Volume K Forecast, by Application 2020 & 2033
- Table 33: Global Power Battery for Heavy Electric Vehicles Revenue undefined Forecast, by Types 2020 & 2033
- Table 34: Global Power Battery for Heavy Electric Vehicles Volume K Forecast, by Types 2020 & 2033
- Table 35: Global Power Battery for Heavy Electric Vehicles Revenue undefined Forecast, by Country 2020 & 2033
- Table 36: Global Power Battery for Heavy Electric Vehicles Volume K Forecast, by Country 2020 & 2033
- Table 37: United Kingdom Power Battery for Heavy Electric Vehicles Revenue (undefined) Forecast, by Application 2020 & 2033
- Table 38: United Kingdom Power Battery for Heavy Electric Vehicles Volume (K) Forecast, by Application 2020 & 2033
- Table 39: Germany Power Battery for Heavy Electric Vehicles Revenue (undefined) Forecast, by Application 2020 & 2033
- Table 40: Germany Power Battery for Heavy Electric Vehicles Volume (K) Forecast, by Application 2020 & 2033
- Table 41: France Power Battery for Heavy Electric Vehicles Revenue (undefined) Forecast, by Application 2020 & 2033
- Table 42: France Power Battery for Heavy Electric Vehicles Volume (K) Forecast, by Application 2020 & 2033
- Table 43: Italy Power Battery for Heavy Electric Vehicles Revenue (undefined) Forecast, by Application 2020 & 2033
- Table 44: Italy Power Battery for Heavy Electric Vehicles Volume (K) Forecast, by Application 2020 & 2033
- Table 45: Spain Power Battery for Heavy Electric Vehicles Revenue (undefined) Forecast, by Application 2020 & 2033
- Table 46: Spain Power Battery for Heavy Electric Vehicles Volume (K) Forecast, by Application 2020 & 2033
- Table 47: Russia Power Battery for Heavy Electric Vehicles Revenue (undefined) Forecast, by Application 2020 & 2033
- Table 48: Russia Power Battery for Heavy Electric Vehicles Volume (K) Forecast, by Application 2020 & 2033
- Table 49: Benelux Power Battery for Heavy Electric Vehicles Revenue (undefined) Forecast, by Application 2020 & 2033
- Table 50: Benelux Power Battery for Heavy Electric Vehicles Volume (K) Forecast, by Application 2020 & 2033
- Table 51: Nordics Power Battery for Heavy Electric Vehicles Revenue (undefined) Forecast, by Application 2020 & 2033
- Table 52: Nordics Power Battery for Heavy Electric Vehicles Volume (K) Forecast, by Application 2020 & 2033
- Table 53: Rest of Europe Power Battery for Heavy Electric Vehicles Revenue (undefined) Forecast, by Application 2020 & 2033
- Table 54: Rest of Europe Power Battery for Heavy Electric Vehicles Volume (K) Forecast, by Application 2020 & 2033
- Table 55: Global Power Battery for Heavy Electric Vehicles Revenue undefined Forecast, by Application 2020 & 2033
- Table 56: Global Power Battery for Heavy Electric Vehicles Volume K Forecast, by Application 2020 & 2033
- Table 57: Global Power Battery for Heavy Electric Vehicles Revenue undefined Forecast, by Types 2020 & 2033
- Table 58: Global Power Battery for Heavy Electric Vehicles Volume K Forecast, by Types 2020 & 2033
- Table 59: Global Power Battery for Heavy Electric Vehicles Revenue undefined Forecast, by Country 2020 & 2033
- Table 60: Global Power Battery for Heavy Electric Vehicles Volume K Forecast, by Country 2020 & 2033
- Table 61: Turkey Power Battery for Heavy Electric Vehicles Revenue (undefined) Forecast, by Application 2020 & 2033
- Table 62: Turkey Power Battery for Heavy Electric Vehicles Volume (K) Forecast, by Application 2020 & 2033
- Table 63: Israel Power Battery for Heavy Electric Vehicles Revenue (undefined) Forecast, by Application 2020 & 2033
- Table 64: Israel Power Battery for Heavy Electric Vehicles Volume (K) Forecast, by Application 2020 & 2033
- Table 65: GCC Power Battery for Heavy Electric Vehicles Revenue (undefined) Forecast, by Application 2020 & 2033
- Table 66: GCC Power Battery for Heavy Electric Vehicles Volume (K) Forecast, by Application 2020 & 2033
- Table 67: North Africa Power Battery for Heavy Electric Vehicles Revenue (undefined) Forecast, by Application 2020 & 2033
- Table 68: North Africa Power Battery for Heavy Electric Vehicles Volume (K) Forecast, by Application 2020 & 2033
- Table 69: South Africa Power Battery for Heavy Electric Vehicles Revenue (undefined) Forecast, by Application 2020 & 2033
- Table 70: South Africa Power Battery for Heavy Electric Vehicles Volume (K) Forecast, by Application 2020 & 2033
- Table 71: Rest of Middle East & Africa Power Battery for Heavy Electric Vehicles Revenue (undefined) Forecast, by Application 2020 & 2033
- Table 72: Rest of Middle East & Africa Power Battery for Heavy Electric Vehicles Volume (K) Forecast, by Application 2020 & 2033
- Table 73: Global Power Battery for Heavy Electric Vehicles Revenue undefined Forecast, by Application 2020 & 2033
- Table 74: Global Power Battery for Heavy Electric Vehicles Volume K Forecast, by Application 2020 & 2033
- Table 75: Global Power Battery for Heavy Electric Vehicles Revenue undefined Forecast, by Types 2020 & 2033
- Table 76: Global Power Battery for Heavy Electric Vehicles Volume K Forecast, by Types 2020 & 2033
- Table 77: Global Power Battery for Heavy Electric Vehicles Revenue undefined Forecast, by Country 2020 & 2033
- Table 78: Global Power Battery for Heavy Electric Vehicles Volume K Forecast, by Country 2020 & 2033
- Table 79: China Power Battery for Heavy Electric Vehicles Revenue (undefined) Forecast, by Application 2020 & 2033
- Table 80: China Power Battery for Heavy Electric Vehicles Volume (K) Forecast, by Application 2020 & 2033
- Table 81: India Power Battery for Heavy Electric Vehicles Revenue (undefined) Forecast, by Application 2020 & 2033
- Table 82: India Power Battery for Heavy Electric Vehicles Volume (K) Forecast, by Application 2020 & 2033
- Table 83: Japan Power Battery for Heavy Electric Vehicles Revenue (undefined) Forecast, by Application 2020 & 2033
- Table 84: Japan Power Battery for Heavy Electric Vehicles Volume (K) Forecast, by Application 2020 & 2033
- Table 85: South Korea Power Battery for Heavy Electric Vehicles Revenue (undefined) Forecast, by Application 2020 & 2033
- Table 86: South Korea Power Battery for Heavy Electric Vehicles Volume (K) Forecast, by Application 2020 & 2033
- Table 87: ASEAN Power Battery for Heavy Electric Vehicles Revenue (undefined) Forecast, by Application 2020 & 2033
- Table 88: ASEAN Power Battery for Heavy Electric Vehicles Volume (K) Forecast, by Application 2020 & 2033
- Table 89: Oceania Power Battery for Heavy Electric Vehicles Revenue (undefined) Forecast, by Application 2020 & 2033
- Table 90: Oceania Power Battery for Heavy Electric Vehicles Volume (K) Forecast, by Application 2020 & 2033
- Table 91: Rest of Asia Pacific Power Battery for Heavy Electric Vehicles Revenue (undefined) Forecast, by Application 2020 & 2033
- Table 92: Rest of Asia Pacific Power Battery for Heavy Electric Vehicles Volume (K) Forecast, by Application 2020 & 2033
Frequently Asked Questions
1. What is the projected Compound Annual Growth Rate (CAGR) of the Power Battery for Heavy Electric Vehicles?
The projected CAGR is approximately 25%.
2. Which companies are prominent players in the Power Battery for Heavy Electric Vehicles?
Key companies in the market include LG Energy, Samsung, Forsee Power, BMZ, Bosch, RiseSun MGL, EVE, CATL, SHPT, Gotion High-tech, Microvast, BYD, Sinosynergy, REFIRE, FTXT Energy.
3. What are the main segments of the Power Battery for Heavy Electric Vehicles?
The market segments include Application, Types.
4. Can you provide details about the market size?
The market size is estimated to be USD XXX N/A as of 2022.
5. What are some drivers contributing to market growth?
N/A
6. What are the notable trends driving market growth?
N/A
7. Are there any restraints impacting market growth?
N/A
8. Can you provide examples of recent developments in the market?
N/A
9. What pricing options are available for accessing the report?
Pricing options include single-user, multi-user, and enterprise licenses priced at USD 3950.00, USD 5925.00, and USD 7900.00 respectively.
10. Is the market size provided in terms of value or volume?
The market size is provided in terms of value, measured in N/A and volume, measured in K.
11. Are there any specific market keywords associated with the report?
Yes, the market keyword associated with the report is "Power Battery for Heavy Electric Vehicles," which aids in identifying and referencing the specific market segment covered.
12. How do I determine which pricing option suits my needs best?
The pricing options vary based on user requirements and access needs. Individual users may opt for single-user licenses, while businesses requiring broader access may choose multi-user or enterprise licenses for cost-effective access to the report.
13. Are there any additional resources or data provided in the Power Battery for Heavy Electric Vehicles report?
While the report offers comprehensive insights, it's advisable to review the specific contents or supplementary materials provided to ascertain if additional resources or data are available.
14. How can I stay updated on further developments or reports in the Power Battery for Heavy Electric Vehicles?
To stay informed about further developments, trends, and reports in the Power Battery for Heavy Electric Vehicles, consider subscribing to industry newsletters, following relevant companies and organizations, or regularly checking reputable industry news sources and publications.
Methodology
Step 1 - Identification of Relevant Samples Size from Population Database


Step 2 - Approaches for Defining Global Market Size (Value, Volume* & Price*)

Note*: In applicable scenarios
Step 3 - Data Sources
Primary Research
- Web Analytics
- Survey Reports
- Research Institute
- Latest Research Reports
- Opinion Leaders
Secondary Research
- Annual Reports
- White Paper
- Latest Press Release
- Industry Association
- Paid Database
- Investor Presentations

Step 4 - Data Triangulation
Involves using different sources of information in order to increase the validity of a study
These sources are likely to be stakeholders in a program - participants, other researchers, program staff, other community members, and so on.
Then we put all data in single framework & apply various statistical tools to find out the dynamic on the market.
During the analysis stage, feedback from the stakeholder groups would be compared to determine areas of agreement as well as areas of divergence