

Key Insights
The global plastic embossed carrier tape market, valued at $1.2 billion in 2024, is projected to expand at a compound annual growth rate (CAGR) of 8.5%. This growth is propelled by the increasing demand for miniaturized electronic components and the widespread adoption of surface mount technology (SMT) across diverse industries. Key growth drivers include the expanding electronics manufacturing sector, particularly in the Asia-Pacific region, and the escalating need for efficient and reliable component handling solutions. Innovations in tape design, encompassing enhanced material properties and improved automation compatibility, further bolster market expansion. Despite potential challenges such as fluctuating raw material prices and the emergence of alternative packaging technologies, the market outlook remains overwhelmingly positive. Segmentation is expected to be diverse, covering various tape dimensions, materials (including PET and PP), and applications such as semiconductors, automotive electronics, and medical devices. Leading market participants, including 3M, Shin-Etsu, and Asahi Kasei, are making strategic investments in research and development to sustain their market leadership, emphasizing novel designs and sustainable manufacturing practices.
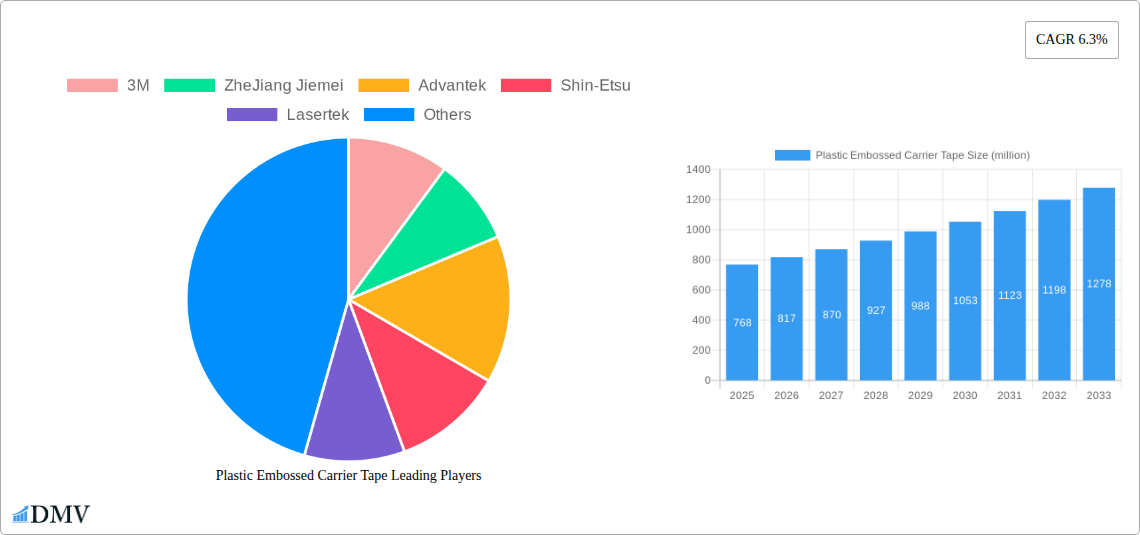
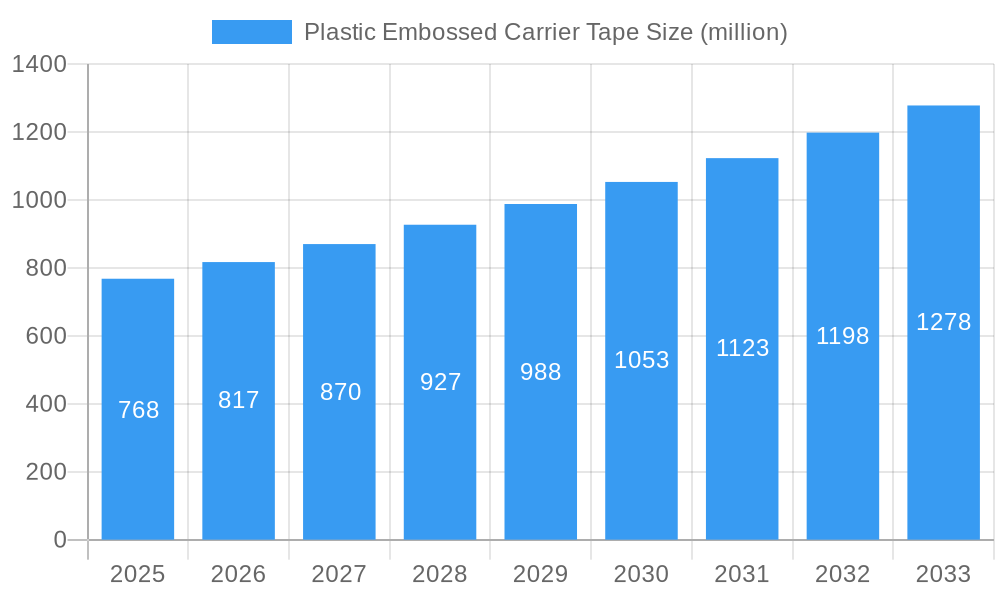
Plastic Embossed Carrier Tape Market Size (In Billion)
The competitive environment features a blend of established multinational corporations and regional enterprises. Strategic collaborations, mergers, acquisitions, and technological advancements are central to companies' efforts to fortify their market standing. Future expansion is significantly linked to the growth of the electronics industry, especially in rapidly developing economies. The demand for high-precision, high-throughput manufacturing processes, critical for producing smaller and more intricate electronic devices, serves as a primary catalyst. Moreover, the increasing automation within electronic assembly lines directly influences the demand for plastic embossed carrier tapes, essential for automated component handling and placement. Continued innovation in materials science, automation technology, and the overall trajectory of the global electronics industry will dictate future market growth.
Plastic Embossed Carrier Tape Company Market Share
Plastic Embossed Carrier Tape Market Report: A Comprehensive Analysis (2019-2033)
This insightful report provides a comprehensive analysis of the global Plastic Embossed Carrier Tape market, projecting a market valuation exceeding $XX million by 2033. The study covers the period from 2019 to 2033, with a base year of 2025 and a forecast period spanning 2025-2033. This in-depth analysis offers crucial insights for stakeholders, investors, and industry players seeking to navigate this dynamic market.
Plastic Embossed Carrier Tape Market Composition & Trends
The global Plastic Embossed Carrier Tape market, valued at $XX million in 2025, is characterized by a moderately concentrated landscape. Key players like 3M, ZheJiang Jiemei, and Shin-Etsu hold significant market shares, but smaller players are also making inroads through product innovation and niche market penetration. Innovation in materials, automation in manufacturing processes, and advancements in tape design are driving market growth. Stringent regulatory compliance regarding material safety and environmental concerns influence market dynamics. Substitute products like alternative packaging methods present competitive pressure, but the unique advantages of Plastic Embossed Carrier Tape in terms of component protection and efficient handling limit their impact. The end-user base comprises diverse industries including electronics, automotive, and medical devices. Recent M&A activities, totaling approximately $XX million in deal value over the historical period, demonstrate a consolidation trend within the market.
- Market Share Distribution (2025): 3M (XX%), ZheJiang Jiemei (XX%), Shin-Etsu (XX%), Others (XX%)
- Major M&A Activities (2019-2024): Deal 1: Company A acquired Company B for $XX million; Deal 2: Company C merged with Company D for $XX million.
- Key Innovation Catalysts: Development of eco-friendly materials, advanced dispensing systems, improved surface treatments.
- Regulatory Landscape: Compliance with RoHS, REACH, and other relevant environmental regulations.
Plastic Embossed Carrier Tape Industry Evolution
The Plastic Embossed Carrier Tape market has witnessed robust growth from 2019 to 2024, expanding at a CAGR of XX%. This growth is primarily attributed to the rising demand for electronic components, the growing adoption of automation in manufacturing processes across various industries, and the increasing need for efficient and reliable component protection. Technological advancements, such as the introduction of high-precision embossing techniques and the development of specialized materials catering to specific application requirements, further fueled market expansion. Simultaneously, consumer demands for improved product quality, enhanced reliability, and sustainable packaging solutions have influenced the development of innovative plastic embossed carrier tapes. The forecast period (2025-2033) anticipates a continued upward trend, driven by factors like the proliferation of smart devices, the expansion of the electric vehicle industry, and increased automation in the manufacturing sector. This is expected to push the market size to $XX million by 2033, with a projected CAGR of XX%.
Leading Regions, Countries, or Segments in Plastic Embossed Carrier Tape
The Asia-Pacific region dominates the global Plastic Embossed Carrier Tape market, driven by the presence of major electronics manufacturing hubs, strong technological advancements, and favorable government initiatives promoting industrial automation. China and South Korea are key contributors within this region.
- Key Drivers in Asia-Pacific:
- High concentration of electronics manufacturing facilities.
- Significant investments in automation and advanced manufacturing technologies.
- Supportive government policies promoting industrial growth and technological innovation.
- Growing demand for consumer electronics and automotive components.
The dominance of the Asia-Pacific region is primarily due to its robust manufacturing sector and high demand for electronic components. The region's substantial investments in research and development, along with a favorable regulatory environment, have fostered a conducive ecosystem for the growth of the plastic embossed carrier tape market. Furthermore, the escalating adoption of automated assembly processes across various industries further contributes to this region's market leadership.
Plastic Embossed Carrier Tape Product Innovations
Recent product innovations focus on enhancing tape performance characteristics and extending application possibilities. These innovations include the development of anti-static and conductive tapes for sensitive electronic components, the introduction of high-temperature-resistant tapes for specialized applications, and the design of tapes with improved adhesion and tear resistance. These advancements improve component protection, reduce manufacturing downtime, and enhance overall production efficiency. The incorporation of recycled materials showcases a commitment to sustainability, attracting environmentally conscious customers. Further innovations are expected to focus on bio-based materials and improved traceability systems to enhance product reliability and maintainability.
Propelling Factors for Plastic Embossed Carrier Tape Growth
Several key factors are driving the growth of the Plastic Embossed Carrier Tape market. The burgeoning electronics industry, particularly the expansion of the semiconductor and consumer electronics sectors, creates significant demand. Automation in manufacturing is a key driver, as these tapes facilitate automated component handling and assembly, leading to increased efficiency and lower production costs. Furthermore, stringent quality standards and the necessity for robust component protection in various industries support market expansion. The increasing adoption of advanced packaging techniques and the demand for sustainable packaging solutions also contribute to the growth of this market.
Obstacles in the Plastic Embossed Carrier Tape Market
Despite the positive growth trajectory, challenges exist. Fluctuations in raw material prices, especially for specific polymers, directly impact production costs and market pricing. Supply chain disruptions caused by geopolitical instability and pandemic-related challenges can affect material availability and lead times. Intense competition among numerous manufacturers requires continuous innovation and cost optimization to maintain market share. Strict environmental regulations on plastic waste necessitate the adoption of sustainable materials and production processes, presenting both a challenge and an opportunity for market players. These factors can collectively decrease profit margins and hinder market growth if not properly managed.
Future Opportunities in Plastic Embossed Carrier Tape
Emerging opportunities lie in expanding into new application areas such as medical devices and aerospace components where high precision and reliability are crucial. Developing innovative designs and materials to cater to the demand for miniaturization in electronics and the rise of flexible electronics provides significant potential. Exploring bio-based and recycled materials aligns with increasing environmental concerns and offers a competitive advantage. The continued automation and digitalization in manufacturing will further propel the need for efficient and reliable component handling solutions, presenting a clear opportunity for growth.
Key Developments in Plastic Embossed Carrier Tape Industry
- 2022 Q3: 3M launched a new line of eco-friendly plastic embossed carrier tapes.
- 2023 Q1: ZheJiang Jiemei announced a strategic partnership with a major automotive manufacturer.
- 2024 Q2: Advantek invested in a new high-precision embossing facility.
- 2024 Q4: Shin-Etsu introduced a new high-temperature resistant tape. (Further developments to be added as available)
Strategic Plastic Embossed Carrier Tape Market Forecast
The Plastic Embossed Carrier Tape market is poised for sustained growth, driven by ongoing technological advancements, increased automation in manufacturing, and the expanding demand across various end-use industries. The focus on sustainability, coupled with innovations in materials and processes, will shape the market landscape. Expanding into new applications and regions, alongside strategic partnerships and M&A activities, will be crucial for companies seeking to capitalize on the market's significant potential. The market is expected to continue its robust expansion throughout the forecast period, further increasing its value to $XX million by 2033, representing a significant opportunity for growth and innovation.
Plastic Embossed Carrier Tape Segmentation
-
1. Application
- 1.1. Power Discrete Devices
- 1.2. Integrated Circuit
- 1.3. Optoelectronics
- 1.4. Others
-
2. Type
- 2.1. Polycarbonate
- 2.2. Polyethylene Terephthalate
- 2.3. Polypropylene
- 2.4. Polystyrene
- 2.5. Polyvinyl Chloride
- 2.6. Others
Plastic Embossed Carrier Tape Segmentation By Geography
-
1. North America
- 1.1. United States
- 1.2. Canada
- 1.3. Mexico
-
2. South America
- 2.1. Brazil
- 2.2. Argentina
- 2.3. Rest of South America
-
3. Europe
- 3.1. United Kingdom
- 3.2. Germany
- 3.3. France
- 3.4. Italy
- 3.5. Spain
- 3.6. Russia
- 3.7. Benelux
- 3.8. Nordics
- 3.9. Rest of Europe
-
4. Middle East & Africa
- 4.1. Turkey
- 4.2. Israel
- 4.3. GCC
- 4.4. North Africa
- 4.5. South Africa
- 4.6. Rest of Middle East & Africa
-
5. Asia Pacific
- 5.1. China
- 5.2. India
- 5.3. Japan
- 5.4. South Korea
- 5.5. ASEAN
- 5.6. Oceania
- 5.7. Rest of Asia Pacific
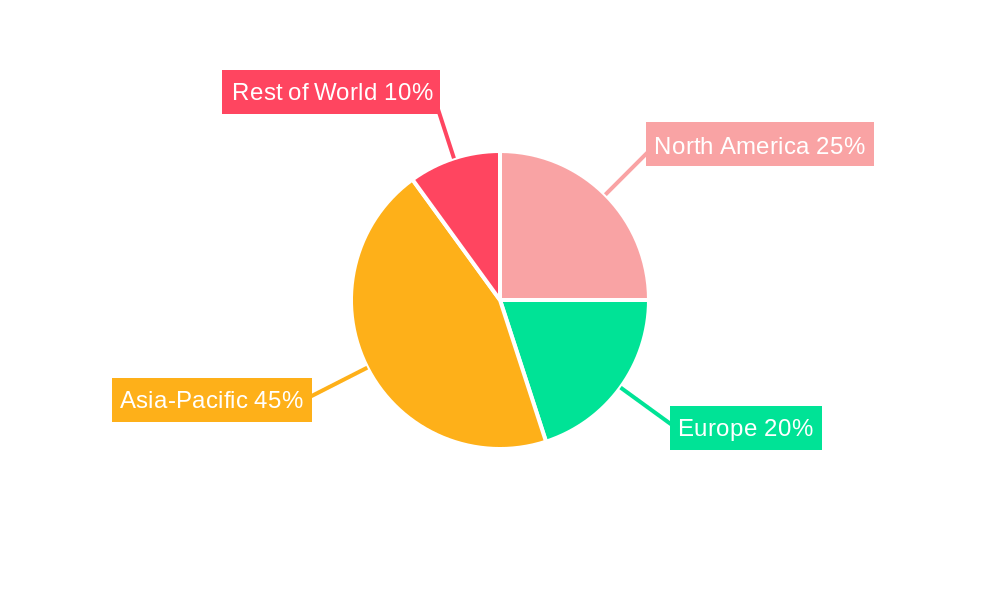
Plastic Embossed Carrier Tape Regional Market Share
Geographic Coverage of Plastic Embossed Carrier Tape
Plastic Embossed Carrier Tape REPORT HIGHLIGHTS
| Aspects | Details |
|---|---|
| Study Period | 2020-2034 |
| Base Year | 2025 |
| Estimated Year | 2026 |
| Forecast Period | 2026-2034 |
| Historical Period | 2020-2025 |
| Growth Rate | CAGR of 8.5% from 2020-2034 |
| Segmentation |
|
Table of Contents
- 1. Introduction
- 1.1. Research Scope
- 1.2. Market Segmentation
- 1.3. Research Methodology
- 1.4. Definitions and Assumptions
- 2. Executive Summary
- 2.1. Introduction
- 3. Market Dynamics
- 3.1. Introduction
- 3.2. Market Drivers
- 3.3. Market Restrains
- 3.4. Market Trends
- 4. Market Factor Analysis
- 4.1. Porters Five Forces
- 4.2. Supply/Value Chain
- 4.3. PESTEL analysis
- 4.4. Market Entropy
- 4.5. Patent/Trademark Analysis
- 5. Global Plastic Embossed Carrier Tape Analysis, Insights and Forecast, 2020-2032
- 5.1. Market Analysis, Insights and Forecast - by Application
- 5.1.1. Power Discrete Devices
- 5.1.2. Integrated Circuit
- 5.1.3. Optoelectronics
- 5.1.4. Others
- 5.2. Market Analysis, Insights and Forecast - by Type
- 5.2.1. Polycarbonate
- 5.2.2. Polyethylene Terephthalate
- 5.2.3. Polypropylene
- 5.2.4. Polystyrene
- 5.2.5. Polyvinyl Chloride
- 5.2.6. Others
- 5.3. Market Analysis, Insights and Forecast - by Region
- 5.3.1. North America
- 5.3.2. South America
- 5.3.3. Europe
- 5.3.4. Middle East & Africa
- 5.3.5. Asia Pacific
- 5.1. Market Analysis, Insights and Forecast - by Application
- 6. North America Plastic Embossed Carrier Tape Analysis, Insights and Forecast, 2020-2032
- 6.1. Market Analysis, Insights and Forecast - by Application
- 6.1.1. Power Discrete Devices
- 6.1.2. Integrated Circuit
- 6.1.3. Optoelectronics
- 6.1.4. Others
- 6.2. Market Analysis, Insights and Forecast - by Type
- 6.2.1. Polycarbonate
- 6.2.2. Polyethylene Terephthalate
- 6.2.3. Polypropylene
- 6.2.4. Polystyrene
- 6.2.5. Polyvinyl Chloride
- 6.2.6. Others
- 6.1. Market Analysis, Insights and Forecast - by Application
- 7. South America Plastic Embossed Carrier Tape Analysis, Insights and Forecast, 2020-2032
- 7.1. Market Analysis, Insights and Forecast - by Application
- 7.1.1. Power Discrete Devices
- 7.1.2. Integrated Circuit
- 7.1.3. Optoelectronics
- 7.1.4. Others
- 7.2. Market Analysis, Insights and Forecast - by Type
- 7.2.1. Polycarbonate
- 7.2.2. Polyethylene Terephthalate
- 7.2.3. Polypropylene
- 7.2.4. Polystyrene
- 7.2.5. Polyvinyl Chloride
- 7.2.6. Others
- 7.1. Market Analysis, Insights and Forecast - by Application
- 8. Europe Plastic Embossed Carrier Tape Analysis, Insights and Forecast, 2020-2032
- 8.1. Market Analysis, Insights and Forecast - by Application
- 8.1.1. Power Discrete Devices
- 8.1.2. Integrated Circuit
- 8.1.3. Optoelectronics
- 8.1.4. Others
- 8.2. Market Analysis, Insights and Forecast - by Type
- 8.2.1. Polycarbonate
- 8.2.2. Polyethylene Terephthalate
- 8.2.3. Polypropylene
- 8.2.4. Polystyrene
- 8.2.5. Polyvinyl Chloride
- 8.2.6. Others
- 8.1. Market Analysis, Insights and Forecast - by Application
- 9. Middle East & Africa Plastic Embossed Carrier Tape Analysis, Insights and Forecast, 2020-2032
- 9.1. Market Analysis, Insights and Forecast - by Application
- 9.1.1. Power Discrete Devices
- 9.1.2. Integrated Circuit
- 9.1.3. Optoelectronics
- 9.1.4. Others
- 9.2. Market Analysis, Insights and Forecast - by Type
- 9.2.1. Polycarbonate
- 9.2.2. Polyethylene Terephthalate
- 9.2.3. Polypropylene
- 9.2.4. Polystyrene
- 9.2.5. Polyvinyl Chloride
- 9.2.6. Others
- 9.1. Market Analysis, Insights and Forecast - by Application
- 10. Asia Pacific Plastic Embossed Carrier Tape Analysis, Insights and Forecast, 2020-2032
- 10.1. Market Analysis, Insights and Forecast - by Application
- 10.1.1. Power Discrete Devices
- 10.1.2. Integrated Circuit
- 10.1.3. Optoelectronics
- 10.1.4. Others
- 10.2. Market Analysis, Insights and Forecast - by Type
- 10.2.1. Polycarbonate
- 10.2.2. Polyethylene Terephthalate
- 10.2.3. Polypropylene
- 10.2.4. Polystyrene
- 10.2.5. Polyvinyl Chloride
- 10.2.6. Others
- 10.1. Market Analysis, Insights and Forecast - by Application
- 11. Competitive Analysis
- 11.1. Global Market Share Analysis 2025
- 11.2. Company Profiles
- 11.2.1 3M
- 11.2.1.1. Overview
- 11.2.1.2. Products
- 11.2.1.3. SWOT Analysis
- 11.2.1.4. Recent Developments
- 11.2.1.5. Financials (Based on Availability)
- 11.2.2 ZheJiang Jiemei
- 11.2.2.1. Overview
- 11.2.2.2. Products
- 11.2.2.3. SWOT Analysis
- 11.2.2.4. Recent Developments
- 11.2.2.5. Financials (Based on Availability)
- 11.2.3 Advantek
- 11.2.3.1. Overview
- 11.2.3.2. Products
- 11.2.3.3. SWOT Analysis
- 11.2.3.4. Recent Developments
- 11.2.3.5. Financials (Based on Availability)
- 11.2.4 Shin-Etsu
- 11.2.4.1. Overview
- 11.2.4.2. Products
- 11.2.4.3. SWOT Analysis
- 11.2.4.4. Recent Developments
- 11.2.4.5. Financials (Based on Availability)
- 11.2.5 Lasertek
- 11.2.5.1. Overview
- 11.2.5.2. Products
- 11.2.5.3. SWOT Analysis
- 11.2.5.4. Recent Developments
- 11.2.5.5. Financials (Based on Availability)
- 11.2.6 U-PAK
- 11.2.6.1. Overview
- 11.2.6.2. Products
- 11.2.6.3. SWOT Analysis
- 11.2.6.4. Recent Developments
- 11.2.6.5. Financials (Based on Availability)
- 11.2.7 ROTHE
- 11.2.7.1. Overview
- 11.2.7.2. Products
- 11.2.7.3. SWOT Analysis
- 11.2.7.4. Recent Developments
- 11.2.7.5. Financials (Based on Availability)
- 11.2.8 C-Pak
- 11.2.8.1. Overview
- 11.2.8.2. Products
- 11.2.8.3. SWOT Analysis
- 11.2.8.4. Recent Developments
- 11.2.8.5. Financials (Based on Availability)
- 11.2.9 Accu Tech Plastics
- 11.2.9.1. Overview
- 11.2.9.2. Products
- 11.2.9.3. SWOT Analysis
- 11.2.9.4. Recent Developments
- 11.2.9.5. Financials (Based on Availability)
- 11.2.10 Asahi Kasei
- 11.2.10.1. Overview
- 11.2.10.2. Products
- 11.2.10.3. SWOT Analysis
- 11.2.10.4. Recent Developments
- 11.2.10.5. Financials (Based on Availability)
- 11.2.11 ACTECH
- 11.2.11.1. Overview
- 11.2.11.2. Products
- 11.2.11.3. SWOT Analysis
- 11.2.11.4. Recent Developments
- 11.2.11.5. Financials (Based on Availability)
- 11.2.12 Ant Group (Acupaq)
- 11.2.12.1. Overview
- 11.2.12.2. Products
- 11.2.12.3. SWOT Analysis
- 11.2.12.4. Recent Developments
- 11.2.12.5. Financials (Based on Availability)
- 11.2.13 Advanced Component Taping
- 11.2.13.1. Overview
- 11.2.13.2. Products
- 11.2.13.3. SWOT Analysis
- 11.2.13.4. Recent Developments
- 11.2.13.5. Financials (Based on Availability)
- 11.2.14 Argosy Inc.
- 11.2.14.1. Overview
- 11.2.14.2. Products
- 11.2.14.3. SWOT Analysis
- 11.2.14.4. Recent Developments
- 11.2.14.5. Financials (Based on Availability)
- 11.2.1 3M
List of Figures
- Figure 1: Global Plastic Embossed Carrier Tape Revenue Breakdown (billion, %) by Region 2025 & 2033
- Figure 2: Global Plastic Embossed Carrier Tape Volume Breakdown (K, %) by Region 2025 & 2033
- Figure 3: North America Plastic Embossed Carrier Tape Revenue (billion), by Application 2025 & 2033
- Figure 4: North America Plastic Embossed Carrier Tape Volume (K), by Application 2025 & 2033
- Figure 5: North America Plastic Embossed Carrier Tape Revenue Share (%), by Application 2025 & 2033
- Figure 6: North America Plastic Embossed Carrier Tape Volume Share (%), by Application 2025 & 2033
- Figure 7: North America Plastic Embossed Carrier Tape Revenue (billion), by Type 2025 & 2033
- Figure 8: North America Plastic Embossed Carrier Tape Volume (K), by Type 2025 & 2033
- Figure 9: North America Plastic Embossed Carrier Tape Revenue Share (%), by Type 2025 & 2033
- Figure 10: North America Plastic Embossed Carrier Tape Volume Share (%), by Type 2025 & 2033
- Figure 11: North America Plastic Embossed Carrier Tape Revenue (billion), by Country 2025 & 2033
- Figure 12: North America Plastic Embossed Carrier Tape Volume (K), by Country 2025 & 2033
- Figure 13: North America Plastic Embossed Carrier Tape Revenue Share (%), by Country 2025 & 2033
- Figure 14: North America Plastic Embossed Carrier Tape Volume Share (%), by Country 2025 & 2033
- Figure 15: South America Plastic Embossed Carrier Tape Revenue (billion), by Application 2025 & 2033
- Figure 16: South America Plastic Embossed Carrier Tape Volume (K), by Application 2025 & 2033
- Figure 17: South America Plastic Embossed Carrier Tape Revenue Share (%), by Application 2025 & 2033
- Figure 18: South America Plastic Embossed Carrier Tape Volume Share (%), by Application 2025 & 2033
- Figure 19: South America Plastic Embossed Carrier Tape Revenue (billion), by Type 2025 & 2033
- Figure 20: South America Plastic Embossed Carrier Tape Volume (K), by Type 2025 & 2033
- Figure 21: South America Plastic Embossed Carrier Tape Revenue Share (%), by Type 2025 & 2033
- Figure 22: South America Plastic Embossed Carrier Tape Volume Share (%), by Type 2025 & 2033
- Figure 23: South America Plastic Embossed Carrier Tape Revenue (billion), by Country 2025 & 2033
- Figure 24: South America Plastic Embossed Carrier Tape Volume (K), by Country 2025 & 2033
- Figure 25: South America Plastic Embossed Carrier Tape Revenue Share (%), by Country 2025 & 2033
- Figure 26: South America Plastic Embossed Carrier Tape Volume Share (%), by Country 2025 & 2033
- Figure 27: Europe Plastic Embossed Carrier Tape Revenue (billion), by Application 2025 & 2033
- Figure 28: Europe Plastic Embossed Carrier Tape Volume (K), by Application 2025 & 2033
- Figure 29: Europe Plastic Embossed Carrier Tape Revenue Share (%), by Application 2025 & 2033
- Figure 30: Europe Plastic Embossed Carrier Tape Volume Share (%), by Application 2025 & 2033
- Figure 31: Europe Plastic Embossed Carrier Tape Revenue (billion), by Type 2025 & 2033
- Figure 32: Europe Plastic Embossed Carrier Tape Volume (K), by Type 2025 & 2033
- Figure 33: Europe Plastic Embossed Carrier Tape Revenue Share (%), by Type 2025 & 2033
- Figure 34: Europe Plastic Embossed Carrier Tape Volume Share (%), by Type 2025 & 2033
- Figure 35: Europe Plastic Embossed Carrier Tape Revenue (billion), by Country 2025 & 2033
- Figure 36: Europe Plastic Embossed Carrier Tape Volume (K), by Country 2025 & 2033
- Figure 37: Europe Plastic Embossed Carrier Tape Revenue Share (%), by Country 2025 & 2033
- Figure 38: Europe Plastic Embossed Carrier Tape Volume Share (%), by Country 2025 & 2033
- Figure 39: Middle East & Africa Plastic Embossed Carrier Tape Revenue (billion), by Application 2025 & 2033
- Figure 40: Middle East & Africa Plastic Embossed Carrier Tape Volume (K), by Application 2025 & 2033
- Figure 41: Middle East & Africa Plastic Embossed Carrier Tape Revenue Share (%), by Application 2025 & 2033
- Figure 42: Middle East & Africa Plastic Embossed Carrier Tape Volume Share (%), by Application 2025 & 2033
- Figure 43: Middle East & Africa Plastic Embossed Carrier Tape Revenue (billion), by Type 2025 & 2033
- Figure 44: Middle East & Africa Plastic Embossed Carrier Tape Volume (K), by Type 2025 & 2033
- Figure 45: Middle East & Africa Plastic Embossed Carrier Tape Revenue Share (%), by Type 2025 & 2033
- Figure 46: Middle East & Africa Plastic Embossed Carrier Tape Volume Share (%), by Type 2025 & 2033
- Figure 47: Middle East & Africa Plastic Embossed Carrier Tape Revenue (billion), by Country 2025 & 2033
- Figure 48: Middle East & Africa Plastic Embossed Carrier Tape Volume (K), by Country 2025 & 2033
- Figure 49: Middle East & Africa Plastic Embossed Carrier Tape Revenue Share (%), by Country 2025 & 2033
- Figure 50: Middle East & Africa Plastic Embossed Carrier Tape Volume Share (%), by Country 2025 & 2033
- Figure 51: Asia Pacific Plastic Embossed Carrier Tape Revenue (billion), by Application 2025 & 2033
- Figure 52: Asia Pacific Plastic Embossed Carrier Tape Volume (K), by Application 2025 & 2033
- Figure 53: Asia Pacific Plastic Embossed Carrier Tape Revenue Share (%), by Application 2025 & 2033
- Figure 54: Asia Pacific Plastic Embossed Carrier Tape Volume Share (%), by Application 2025 & 2033
- Figure 55: Asia Pacific Plastic Embossed Carrier Tape Revenue (billion), by Type 2025 & 2033
- Figure 56: Asia Pacific Plastic Embossed Carrier Tape Volume (K), by Type 2025 & 2033
- Figure 57: Asia Pacific Plastic Embossed Carrier Tape Revenue Share (%), by Type 2025 & 2033
- Figure 58: Asia Pacific Plastic Embossed Carrier Tape Volume Share (%), by Type 2025 & 2033
- Figure 59: Asia Pacific Plastic Embossed Carrier Tape Revenue (billion), by Country 2025 & 2033
- Figure 60: Asia Pacific Plastic Embossed Carrier Tape Volume (K), by Country 2025 & 2033
- Figure 61: Asia Pacific Plastic Embossed Carrier Tape Revenue Share (%), by Country 2025 & 2033
- Figure 62: Asia Pacific Plastic Embossed Carrier Tape Volume Share (%), by Country 2025 & 2033
List of Tables
- Table 1: Global Plastic Embossed Carrier Tape Revenue billion Forecast, by Application 2020 & 2033
- Table 2: Global Plastic Embossed Carrier Tape Volume K Forecast, by Application 2020 & 2033
- Table 3: Global Plastic Embossed Carrier Tape Revenue billion Forecast, by Type 2020 & 2033
- Table 4: Global Plastic Embossed Carrier Tape Volume K Forecast, by Type 2020 & 2033
- Table 5: Global Plastic Embossed Carrier Tape Revenue billion Forecast, by Region 2020 & 2033
- Table 6: Global Plastic Embossed Carrier Tape Volume K Forecast, by Region 2020 & 2033
- Table 7: Global Plastic Embossed Carrier Tape Revenue billion Forecast, by Application 2020 & 2033
- Table 8: Global Plastic Embossed Carrier Tape Volume K Forecast, by Application 2020 & 2033
- Table 9: Global Plastic Embossed Carrier Tape Revenue billion Forecast, by Type 2020 & 2033
- Table 10: Global Plastic Embossed Carrier Tape Volume K Forecast, by Type 2020 & 2033
- Table 11: Global Plastic Embossed Carrier Tape Revenue billion Forecast, by Country 2020 & 2033
- Table 12: Global Plastic Embossed Carrier Tape Volume K Forecast, by Country 2020 & 2033
- Table 13: United States Plastic Embossed Carrier Tape Revenue (billion) Forecast, by Application 2020 & 2033
- Table 14: United States Plastic Embossed Carrier Tape Volume (K) Forecast, by Application 2020 & 2033
- Table 15: Canada Plastic Embossed Carrier Tape Revenue (billion) Forecast, by Application 2020 & 2033
- Table 16: Canada Plastic Embossed Carrier Tape Volume (K) Forecast, by Application 2020 & 2033
- Table 17: Mexico Plastic Embossed Carrier Tape Revenue (billion) Forecast, by Application 2020 & 2033
- Table 18: Mexico Plastic Embossed Carrier Tape Volume (K) Forecast, by Application 2020 & 2033
- Table 19: Global Plastic Embossed Carrier Tape Revenue billion Forecast, by Application 2020 & 2033
- Table 20: Global Plastic Embossed Carrier Tape Volume K Forecast, by Application 2020 & 2033
- Table 21: Global Plastic Embossed Carrier Tape Revenue billion Forecast, by Type 2020 & 2033
- Table 22: Global Plastic Embossed Carrier Tape Volume K Forecast, by Type 2020 & 2033
- Table 23: Global Plastic Embossed Carrier Tape Revenue billion Forecast, by Country 2020 & 2033
- Table 24: Global Plastic Embossed Carrier Tape Volume K Forecast, by Country 2020 & 2033
- Table 25: Brazil Plastic Embossed Carrier Tape Revenue (billion) Forecast, by Application 2020 & 2033
- Table 26: Brazil Plastic Embossed Carrier Tape Volume (K) Forecast, by Application 2020 & 2033
- Table 27: Argentina Plastic Embossed Carrier Tape Revenue (billion) Forecast, by Application 2020 & 2033
- Table 28: Argentina Plastic Embossed Carrier Tape Volume (K) Forecast, by Application 2020 & 2033
- Table 29: Rest of South America Plastic Embossed Carrier Tape Revenue (billion) Forecast, by Application 2020 & 2033
- Table 30: Rest of South America Plastic Embossed Carrier Tape Volume (K) Forecast, by Application 2020 & 2033
- Table 31: Global Plastic Embossed Carrier Tape Revenue billion Forecast, by Application 2020 & 2033
- Table 32: Global Plastic Embossed Carrier Tape Volume K Forecast, by Application 2020 & 2033
- Table 33: Global Plastic Embossed Carrier Tape Revenue billion Forecast, by Type 2020 & 2033
- Table 34: Global Plastic Embossed Carrier Tape Volume K Forecast, by Type 2020 & 2033
- Table 35: Global Plastic Embossed Carrier Tape Revenue billion Forecast, by Country 2020 & 2033
- Table 36: Global Plastic Embossed Carrier Tape Volume K Forecast, by Country 2020 & 2033
- Table 37: United Kingdom Plastic Embossed Carrier Tape Revenue (billion) Forecast, by Application 2020 & 2033
- Table 38: United Kingdom Plastic Embossed Carrier Tape Volume (K) Forecast, by Application 2020 & 2033
- Table 39: Germany Plastic Embossed Carrier Tape Revenue (billion) Forecast, by Application 2020 & 2033
- Table 40: Germany Plastic Embossed Carrier Tape Volume (K) Forecast, by Application 2020 & 2033
- Table 41: France Plastic Embossed Carrier Tape Revenue (billion) Forecast, by Application 2020 & 2033
- Table 42: France Plastic Embossed Carrier Tape Volume (K) Forecast, by Application 2020 & 2033
- Table 43: Italy Plastic Embossed Carrier Tape Revenue (billion) Forecast, by Application 2020 & 2033
- Table 44: Italy Plastic Embossed Carrier Tape Volume (K) Forecast, by Application 2020 & 2033
- Table 45: Spain Plastic Embossed Carrier Tape Revenue (billion) Forecast, by Application 2020 & 2033
- Table 46: Spain Plastic Embossed Carrier Tape Volume (K) Forecast, by Application 2020 & 2033
- Table 47: Russia Plastic Embossed Carrier Tape Revenue (billion) Forecast, by Application 2020 & 2033
- Table 48: Russia Plastic Embossed Carrier Tape Volume (K) Forecast, by Application 2020 & 2033
- Table 49: Benelux Plastic Embossed Carrier Tape Revenue (billion) Forecast, by Application 2020 & 2033
- Table 50: Benelux Plastic Embossed Carrier Tape Volume (K) Forecast, by Application 2020 & 2033
- Table 51: Nordics Plastic Embossed Carrier Tape Revenue (billion) Forecast, by Application 2020 & 2033
- Table 52: Nordics Plastic Embossed Carrier Tape Volume (K) Forecast, by Application 2020 & 2033
- Table 53: Rest of Europe Plastic Embossed Carrier Tape Revenue (billion) Forecast, by Application 2020 & 2033
- Table 54: Rest of Europe Plastic Embossed Carrier Tape Volume (K) Forecast, by Application 2020 & 2033
- Table 55: Global Plastic Embossed Carrier Tape Revenue billion Forecast, by Application 2020 & 2033
- Table 56: Global Plastic Embossed Carrier Tape Volume K Forecast, by Application 2020 & 2033
- Table 57: Global Plastic Embossed Carrier Tape Revenue billion Forecast, by Type 2020 & 2033
- Table 58: Global Plastic Embossed Carrier Tape Volume K Forecast, by Type 2020 & 2033
- Table 59: Global Plastic Embossed Carrier Tape Revenue billion Forecast, by Country 2020 & 2033
- Table 60: Global Plastic Embossed Carrier Tape Volume K Forecast, by Country 2020 & 2033
- Table 61: Turkey Plastic Embossed Carrier Tape Revenue (billion) Forecast, by Application 2020 & 2033
- Table 62: Turkey Plastic Embossed Carrier Tape Volume (K) Forecast, by Application 2020 & 2033
- Table 63: Israel Plastic Embossed Carrier Tape Revenue (billion) Forecast, by Application 2020 & 2033
- Table 64: Israel Plastic Embossed Carrier Tape Volume (K) Forecast, by Application 2020 & 2033
- Table 65: GCC Plastic Embossed Carrier Tape Revenue (billion) Forecast, by Application 2020 & 2033
- Table 66: GCC Plastic Embossed Carrier Tape Volume (K) Forecast, by Application 2020 & 2033
- Table 67: North Africa Plastic Embossed Carrier Tape Revenue (billion) Forecast, by Application 2020 & 2033
- Table 68: North Africa Plastic Embossed Carrier Tape Volume (K) Forecast, by Application 2020 & 2033
- Table 69: South Africa Plastic Embossed Carrier Tape Revenue (billion) Forecast, by Application 2020 & 2033
- Table 70: South Africa Plastic Embossed Carrier Tape Volume (K) Forecast, by Application 2020 & 2033
- Table 71: Rest of Middle East & Africa Plastic Embossed Carrier Tape Revenue (billion) Forecast, by Application 2020 & 2033
- Table 72: Rest of Middle East & Africa Plastic Embossed Carrier Tape Volume (K) Forecast, by Application 2020 & 2033
- Table 73: Global Plastic Embossed Carrier Tape Revenue billion Forecast, by Application 2020 & 2033
- Table 74: Global Plastic Embossed Carrier Tape Volume K Forecast, by Application 2020 & 2033
- Table 75: Global Plastic Embossed Carrier Tape Revenue billion Forecast, by Type 2020 & 2033
- Table 76: Global Plastic Embossed Carrier Tape Volume K Forecast, by Type 2020 & 2033
- Table 77: Global Plastic Embossed Carrier Tape Revenue billion Forecast, by Country 2020 & 2033
- Table 78: Global Plastic Embossed Carrier Tape Volume K Forecast, by Country 2020 & 2033
- Table 79: China Plastic Embossed Carrier Tape Revenue (billion) Forecast, by Application 2020 & 2033
- Table 80: China Plastic Embossed Carrier Tape Volume (K) Forecast, by Application 2020 & 2033
- Table 81: India Plastic Embossed Carrier Tape Revenue (billion) Forecast, by Application 2020 & 2033
- Table 82: India Plastic Embossed Carrier Tape Volume (K) Forecast, by Application 2020 & 2033
- Table 83: Japan Plastic Embossed Carrier Tape Revenue (billion) Forecast, by Application 2020 & 2033
- Table 84: Japan Plastic Embossed Carrier Tape Volume (K) Forecast, by Application 2020 & 2033
- Table 85: South Korea Plastic Embossed Carrier Tape Revenue (billion) Forecast, by Application 2020 & 2033
- Table 86: South Korea Plastic Embossed Carrier Tape Volume (K) Forecast, by Application 2020 & 2033
- Table 87: ASEAN Plastic Embossed Carrier Tape Revenue (billion) Forecast, by Application 2020 & 2033
- Table 88: ASEAN Plastic Embossed Carrier Tape Volume (K) Forecast, by Application 2020 & 2033
- Table 89: Oceania Plastic Embossed Carrier Tape Revenue (billion) Forecast, by Application 2020 & 2033
- Table 90: Oceania Plastic Embossed Carrier Tape Volume (K) Forecast, by Application 2020 & 2033
- Table 91: Rest of Asia Pacific Plastic Embossed Carrier Tape Revenue (billion) Forecast, by Application 2020 & 2033
- Table 92: Rest of Asia Pacific Plastic Embossed Carrier Tape Volume (K) Forecast, by Application 2020 & 2033
Frequently Asked Questions
1. What is the projected Compound Annual Growth Rate (CAGR) of the Plastic Embossed Carrier Tape?
The projected CAGR is approximately 8.5%.
2. Which companies are prominent players in the Plastic Embossed Carrier Tape?
Key companies in the market include 3M, ZheJiang Jiemei, Advantek, Shin-Etsu, Lasertek, U-PAK, ROTHE, C-Pak, Accu Tech Plastics, Asahi Kasei, ACTECH, Ant Group (Acupaq), Advanced Component Taping, Argosy Inc..
3. What are the main segments of the Plastic Embossed Carrier Tape?
The market segments include Application, Type.
4. Can you provide details about the market size?
The market size is estimated to be USD 1.2 billion as of 2022.
5. What are some drivers contributing to market growth?
N/A
6. What are the notable trends driving market growth?
N/A
7. Are there any restraints impacting market growth?
N/A
8. Can you provide examples of recent developments in the market?
N/A
9. What pricing options are available for accessing the report?
Pricing options include single-user, multi-user, and enterprise licenses priced at USD 3950.00, USD 5925.00, and USD 7900.00 respectively.
10. Is the market size provided in terms of value or volume?
The market size is provided in terms of value, measured in billion and volume, measured in K.
11. Are there any specific market keywords associated with the report?
Yes, the market keyword associated with the report is "Plastic Embossed Carrier Tape," which aids in identifying and referencing the specific market segment covered.
12. How do I determine which pricing option suits my needs best?
The pricing options vary based on user requirements and access needs. Individual users may opt for single-user licenses, while businesses requiring broader access may choose multi-user or enterprise licenses for cost-effective access to the report.
13. Are there any additional resources or data provided in the Plastic Embossed Carrier Tape report?
While the report offers comprehensive insights, it's advisable to review the specific contents or supplementary materials provided to ascertain if additional resources or data are available.
14. How can I stay updated on further developments or reports in the Plastic Embossed Carrier Tape?
To stay informed about further developments, trends, and reports in the Plastic Embossed Carrier Tape, consider subscribing to industry newsletters, following relevant companies and organizations, or regularly checking reputable industry news sources and publications.
Methodology
Step 1 - Identification of Relevant Samples Size from Population Database


Step 2 - Approaches for Defining Global Market Size (Value, Volume* & Price*)

Note*: In applicable scenarios
Step 3 - Data Sources
Primary Research
- Web Analytics
- Survey Reports
- Research Institute
- Latest Research Reports
- Opinion Leaders
Secondary Research
- Annual Reports
- White Paper
- Latest Press Release
- Industry Association
- Paid Database
- Investor Presentations

Step 4 - Data Triangulation
Involves using different sources of information in order to increase the validity of a study
These sources are likely to be stakeholders in a program - participants, other researchers, program staff, other community members, and so on.
Then we put all data in single framework & apply various statistical tools to find out the dynamic on the market.
During the analysis stage, feedback from the stakeholder groups would be compared to determine areas of agreement as well as areas of divergence