

Key Insights
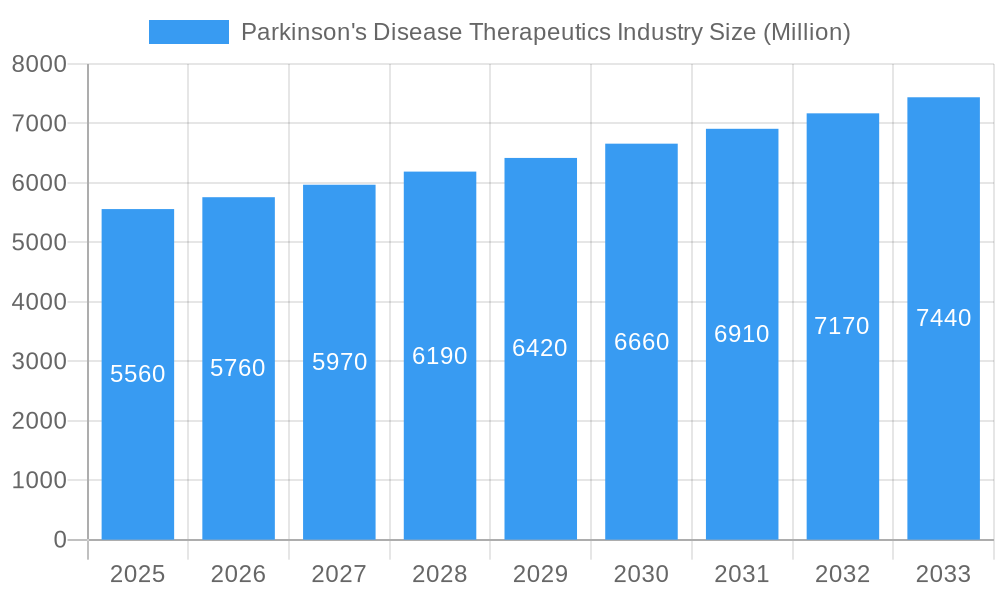
The Parkinson's Disease Therapeutics market, valued at $5.56 billion in 2025, is projected to experience steady growth, driven by an aging global population and increasing prevalence of Parkinson's disease. A compound annual growth rate (CAGR) of 3.58% is anticipated from 2025 to 2033, indicating a market size exceeding $7.5 billion by the end of the forecast period. Key growth drivers include the rising geriatric population susceptible to neurodegenerative disorders, increased awareness and diagnosis rates, and ongoing research and development leading to innovative therapies. Market segmentation reveals a diverse landscape with dopamine agonists, anticholinergics, MAO-B inhibitors, amantadine, carbidopa-levodopa, COMT inhibitors, and other mechanisms of action contributing to the overall market value. While advancements in drug development offer significant potential, challenges remain including the high cost of treatment, limited treatment options for advanced-stage Parkinson's, and potential side effects associated with certain medications. The competitive landscape is shaped by major pharmaceutical companies such as Boehringer Ingelheim, Novartis, Roche, and others, who are actively engaged in developing and commercializing new treatment options.
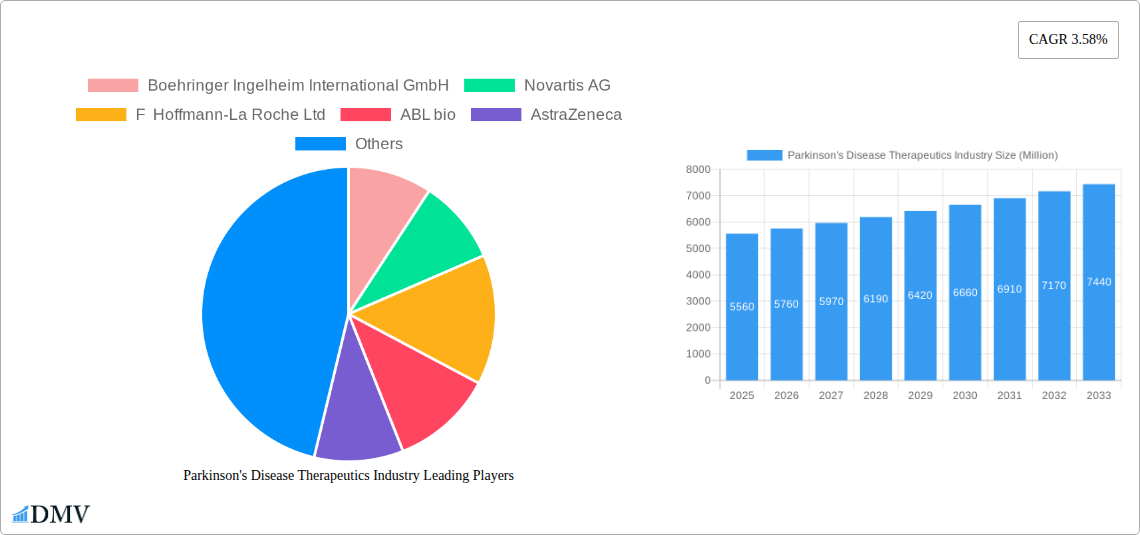
Parkinson's Disease Therapeutics Industry Market Size (In Billion)
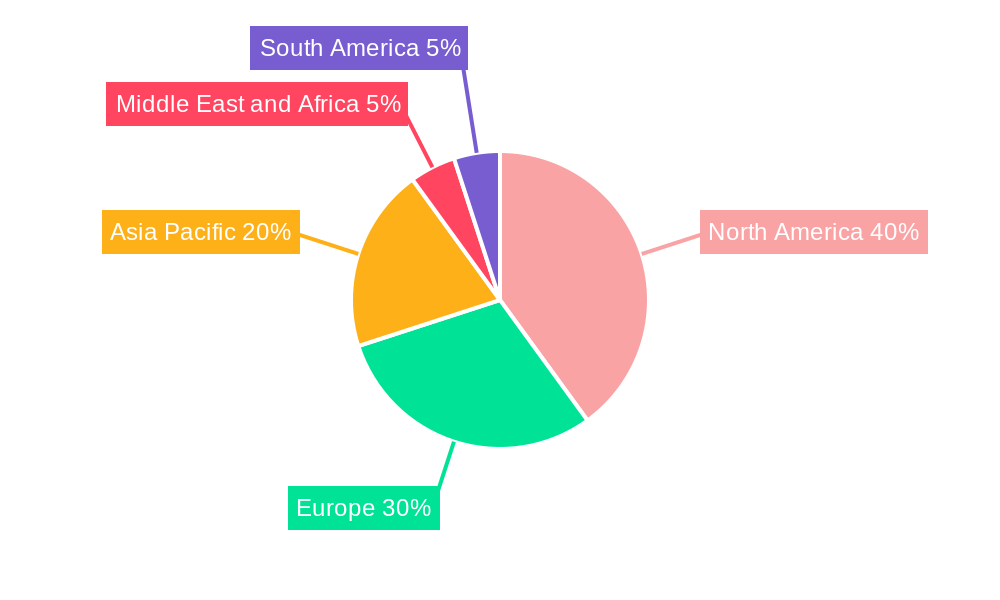
Geographical distribution reveals strong market presence across North America, Europe, and Asia Pacific, reflecting variations in healthcare infrastructure, disease prevalence, and access to advanced therapies. North America is currently the leading regional market, driven by high healthcare expenditure and advanced medical facilities. However, growth in Asia Pacific is expected to accelerate owing to the increasing prevalence of Parkinson's disease in rapidly aging populations and improving healthcare infrastructure. Despite the challenges, the Parkinson's Disease Therapeutics market presents significant opportunities for pharmaceutical companies involved in the research, development, and commercialization of effective and safe treatment modalities. Continued innovation, focusing on improved efficacy and safety profiles, alongside addressing affordability concerns, are crucial factors that will influence market dynamics in the coming years.
Parkinson's Disease Therapeutics Industry Company Market Share
Parkinson's Disease Therapeutics Industry: A Comprehensive Market Report (2019-2033)
This insightful report provides a detailed analysis of the Parkinson's Disease Therapeutics market, encompassing market size, segmentation, key players, and future growth projections. The study period covers 2019-2033, with 2025 as the base and estimated year. The report offers a crucial understanding for stakeholders seeking investment opportunities, competitive intelligence, or strategic planning within this rapidly evolving therapeutic area. The global market value is estimated at xx Million in 2025, projected to reach xx Million by 2033, exhibiting a CAGR of xx%.
Parkinson's Disease Therapeutics Industry Market Composition & Trends
This section dives deep into the competitive landscape of the Parkinson's disease therapeutics market, evaluating market concentration, innovation drivers, regulatory influences, and strategic activities. The market is characterized by a moderately concentrated structure, with a few major players holding significant market share. However, the presence of numerous smaller, innovative companies indicates a dynamic competitive environment.
- Market Share Distribution: The top five companies—Boehringer Ingelheim International GmbH, Novartis AG, F Hoffmann-La Roche Ltd, AstraZeneca, and AbbVie Inc—account for an estimated xx% of the global market share in 2025.
- M&A Activity: The Parkinson's disease therapeutics market has witnessed significant M&A activity in recent years, with deal values totaling xx Million in the period 2019-2024. These activities often focus on acquiring promising pipeline assets and expanding therapeutic capabilities.
- Innovation Catalysts: Significant investments in R&D, coupled with advancements in understanding disease mechanisms, are driving the development of novel therapeutics targeting diverse aspects of Parkinson's disease pathology.
- Regulatory Landscape: Stringent regulatory approvals and clinical trial requirements influence the pace of new drug launches and impact overall market growth. However, supportive regulatory frameworks, including accelerated approval pathways for innovative therapies, are creating opportunities for faster market entry.
- Substitute Products: While currently limited, the development of non-pharmaceutical interventions, such as advanced rehabilitation therapies and digital health solutions, presents potential substitute products for drug therapy, creating a dynamic competitive environment.
- End-User Profiles: The primary end-users are neurologists and other healthcare professionals specializing in treating neurological disorders. This report includes profiles of key stakeholders, including payers, regulatory authorities, and patient advocacy groups.
Parkinson's Disease Therapeutics Industry Industry Evolution
The Parkinson's disease therapeutics market has experienced substantial evolution in recent years, driven by several interconnected factors. Market growth has been robust, fueled by an aging global population and increased disease prevalence. Technological advancements, such as improved biomarkers and advanced imaging techniques, are enabling earlier and more accurate diagnosis, facilitating better treatment outcomes. Consumer demands are also evolving, with increasing emphasis on personalized medicine approaches and patient-centric care. The historical period (2019-2024) witnessed a CAGR of xx%, driven largely by the introduction of new therapies and increasing awareness of Parkinson’s Disease. The forecasted period (2025-2033) is anticipated to exhibit a CAGR of xx%, owing to the launch of several pipeline therapies and global market expansion. The adoption of new treatments has been steady, with a growing preference for therapies with improved efficacy and reduced side effects.
Leading Regions, Countries, or Segments in Parkinson's Disease Therapeutics Industry
North America currently dominates the Parkinson's disease therapeutics market, driven by factors such as higher healthcare expenditure, robust R&D infrastructure, and a relatively high prevalence of the disease. However, emerging markets in Asia-Pacific and other regions are poised for significant growth.
Key Drivers:
- High prevalence of Parkinson's Disease: The aging global population is increasing the number of individuals diagnosed with Parkinson's disease.
- Investment in R&D: Significant funding is directed towards research and development of new treatments, fostering innovation.
- Regulatory Support: Favorable regulatory frameworks facilitate faster approvals and market entry for innovative therapeutics.
Dominance Factors: North America's dominance stems from its well-established healthcare infrastructure, higher per capita healthcare spending, and a robust pipeline of new drugs. Europe follows closely, driven by similar factors. Asia-Pacific is experiencing rapid growth due to an expanding aging population and increasing healthcare awareness.
Dominant Segments by Mechanism of Action: Carbidopa-levodopa currently holds the largest market share among the mechanism of action segments, followed by Dopamine Agonists and MAO-B inhibitors. However, the "Other Mechanisms of Action" segment is projected to experience the highest growth rate in the forecast period due to the emergence of innovative therapies targeting different pathological pathways.
Parkinson's Disease Therapeutics Industry Product Innovations
Recent product innovations focus on improving efficacy, reducing side effects, and providing more convenient administration routes. Examples include long-acting formulations, combination therapies, and novel delivery systems designed to enhance drug penetration into the brain. The emphasis on personalized medicine is driving the development of therapies tailored to specific patient subgroups, improving treatment outcomes and reducing adverse effects. Technological advancements in drug delivery, such as nanoparticles and gene therapy, represent significant opportunities to transform the treatment landscape.
Propelling Factors for Parkinson's Disease Therapeutics Industry Growth
Technological advancements in drug discovery, combined with a deeper understanding of Parkinson's disease pathophysiology, are propelling market growth. Increasing healthcare expenditure and the aging global population create a substantial pool of potential patients. Favorable regulatory landscapes, such as accelerated approval pathways, reduce the time to market for promising new treatments.
Obstacles in the Parkinson's Disease Therapeutics Industry Market
Significant challenges remain. The high cost of developing and commercializing new therapies can limit access. Strict regulatory requirements necessitate extensive clinical trials, extending the time-to-market. Competition from existing therapies and the emergence of alternative treatment options further constrain market expansion.
Future Opportunities in Parkinson's Disease Therapeutics Industry
Future opportunities lie in developing disease-modifying therapies to slow or halt disease progression. The application of artificial intelligence and big data analytics will improve patient stratification and treatment selection. Emerging markets in Asia and Latin America present substantial untapped potential.
Major Players in the Parkinson's Disease Therapeutics Industry Ecosystem
- Boehringer Ingelheim International GmbH
- Novartis AG
- F Hoffmann-La Roche Ltd
- ABL bio
- AstraZeneca
- Teva Pharmaceuticals Industries Ltd
- Prevail Therapeutics
- Kissei Pharmaceutical Co Ltd
- Newron Pharmaceuticals SPA
- Viatris
- AbbVie Inc
- GSK plc
- Amneal Pharmaceuticals LLC
- Pfizer Inc
Key Developments in Parkinson's Disease Therapeutics Industry Industry
- March 2022: Neuron23 raised USD 100 Million to advance Parkinson's disease therapy, planning trials for NEU-723.
- January 2022: ABL Bio Inc. partnered with Sanofi to develop and commercialize ABL301, a bispecific antibody targeting alpha-synuclein and IGF1R.
Strategic Parkinson's Disease Therapeutics Industry Market Forecast
The Parkinson's Disease Therapeutics market is poised for substantial growth, driven by an aging population, technological advancements in treatment modalities, and increased awareness of the disease. Significant opportunities exist in developing disease-modifying therapies and personalized medicine approaches. The market's future trajectory is highly promising, with continuous innovation shaping the landscape and enhancing treatment options for patients worldwide.
Parkinson's Disease Therapeutics Industry Segmentation
-
1. Mechanism of Action
- 1.1. Dopamine Agonists
- 1.2. Anticholinergic
- 1.3. MAO-B inhibitors
- 1.4. Amantadine
- 1.5. Carbidopa-levodopa
- 1.6. COMT Inhibitors
- 1.7. Other Mechanisms of Action
Parkinson's Disease Therapeutics Industry Segmentation By Geography
-
1. North America
- 1.1. United States
- 1.2. Canada
- 1.3. Mexico
-
2. Europe
- 2.1. Germany
- 2.2. United Kingdom
- 2.3. France
- 2.4. Italy
- 2.5. Spain
- 2.6. Rest of Europe
-
3. Asia Pacific
- 3.1. China
- 3.2. Japan
- 3.3. India
- 3.4. Australia
- 3.5. South Korea
- 3.6. Rest of Asia Pacific
-
4. Middle East and Africa
- 4.1. GCC
- 4.2. South Africa
- 4.3. Rest of Middle East and Africa
-
5. South America
- 5.1. Brazil
- 5.2. Argentina
- 5.3. Rest of South America
Parkinson's Disease Therapeutics Industry Regional Market Share
Geographic Coverage of Parkinson's Disease Therapeutics Industry
Parkinson's Disease Therapeutics Industry REPORT HIGHLIGHTS
| Aspects | Details |
|---|---|
| Study Period | 2020-2034 |
| Base Year | 2025 |
| Estimated Year | 2026 |
| Forecast Period | 2026-2034 |
| Historical Period | 2020-2025 |
| Growth Rate | CAGR of 3.58% from 2020-2034 |
| Segmentation |
|
Table of Contents
- 1. Introduction
- 1.1. Research Scope
- 1.2. Market Segmentation
- 1.3. Research Methodology
- 1.4. Definitions and Assumptions
- 2. Executive Summary
- 2.1. Introduction
- 3. Market Dynamics
- 3.1. Introduction
- 3.2. Market Drivers
- 3.2.1. Rising Geriatric Population and Burden of Parkinson's Disease; Growing Awareness Among the Population; Increasing R&D and Continuous Drug Approvals
- 3.3. Market Restrains
- 3.3.1. Adverse Events Associated with Therapeutics; High Cost of Treatments Followed by Extremely High R&D Expenditure
- 3.4. Market Trends
- 3.4.1. MAO-B inhibitors Segment is Expected to Dominate the Market Over the Forecast Period
- 4. Market Factor Analysis
- 4.1. Porters Five Forces
- 4.2. Supply/Value Chain
- 4.3. PESTEL analysis
- 4.4. Market Entropy
- 4.5. Patent/Trademark Analysis
- 5. Global Parkinson's Disease Therapeutics Industry Analysis, Insights and Forecast, 2020-2032
- 5.1. Market Analysis, Insights and Forecast - by Mechanism of Action
- 5.1.1. Dopamine Agonists
- 5.1.2. Anticholinergic
- 5.1.3. MAO-B inhibitors
- 5.1.4. Amantadine
- 5.1.5. Carbidopa-levodopa
- 5.1.6. COMT Inhibitors
- 5.1.7. Other Mechanisms of Action
- 5.2. Market Analysis, Insights and Forecast - by Region
- 5.2.1. North America
- 5.2.2. Europe
- 5.2.3. Asia Pacific
- 5.2.4. Middle East and Africa
- 5.2.5. South America
- 5.1. Market Analysis, Insights and Forecast - by Mechanism of Action
- 6. North America Parkinson's Disease Therapeutics Industry Analysis, Insights and Forecast, 2020-2032
- 6.1. Market Analysis, Insights and Forecast - by Mechanism of Action
- 6.1.1. Dopamine Agonists
- 6.1.2. Anticholinergic
- 6.1.3. MAO-B inhibitors
- 6.1.4. Amantadine
- 6.1.5. Carbidopa-levodopa
- 6.1.6. COMT Inhibitors
- 6.1.7. Other Mechanisms of Action
- 6.1. Market Analysis, Insights and Forecast - by Mechanism of Action
- 7. Europe Parkinson's Disease Therapeutics Industry Analysis, Insights and Forecast, 2020-2032
- 7.1. Market Analysis, Insights and Forecast - by Mechanism of Action
- 7.1.1. Dopamine Agonists
- 7.1.2. Anticholinergic
- 7.1.3. MAO-B inhibitors
- 7.1.4. Amantadine
- 7.1.5. Carbidopa-levodopa
- 7.1.6. COMT Inhibitors
- 7.1.7. Other Mechanisms of Action
- 7.1. Market Analysis, Insights and Forecast - by Mechanism of Action
- 8. Asia Pacific Parkinson's Disease Therapeutics Industry Analysis, Insights and Forecast, 2020-2032
- 8.1. Market Analysis, Insights and Forecast - by Mechanism of Action
- 8.1.1. Dopamine Agonists
- 8.1.2. Anticholinergic
- 8.1.3. MAO-B inhibitors
- 8.1.4. Amantadine
- 8.1.5. Carbidopa-levodopa
- 8.1.6. COMT Inhibitors
- 8.1.7. Other Mechanisms of Action
- 8.1. Market Analysis, Insights and Forecast - by Mechanism of Action
- 9. Middle East and Africa Parkinson's Disease Therapeutics Industry Analysis, Insights and Forecast, 2020-2032
- 9.1. Market Analysis, Insights and Forecast - by Mechanism of Action
- 9.1.1. Dopamine Agonists
- 9.1.2. Anticholinergic
- 9.1.3. MAO-B inhibitors
- 9.1.4. Amantadine
- 9.1.5. Carbidopa-levodopa
- 9.1.6. COMT Inhibitors
- 9.1.7. Other Mechanisms of Action
- 9.1. Market Analysis, Insights and Forecast - by Mechanism of Action
- 10. South America Parkinson's Disease Therapeutics Industry Analysis, Insights and Forecast, 2020-2032
- 10.1. Market Analysis, Insights and Forecast - by Mechanism of Action
- 10.1.1. Dopamine Agonists
- 10.1.2. Anticholinergic
- 10.1.3. MAO-B inhibitors
- 10.1.4. Amantadine
- 10.1.5. Carbidopa-levodopa
- 10.1.6. COMT Inhibitors
- 10.1.7. Other Mechanisms of Action
- 10.1. Market Analysis, Insights and Forecast - by Mechanism of Action
- 11. Competitive Analysis
- 11.1. Global Market Share Analysis 2025
- 11.2. Company Profiles
- 11.2.1 Boehringer Ingelheim International GmbH
- 11.2.1.1. Overview
- 11.2.1.2. Products
- 11.2.1.3. SWOT Analysis
- 11.2.1.4. Recent Developments
- 11.2.1.5. Financials (Based on Availability)
- 11.2.2 Novartis AG
- 11.2.2.1. Overview
- 11.2.2.2. Products
- 11.2.2.3. SWOT Analysis
- 11.2.2.4. Recent Developments
- 11.2.2.5. Financials (Based on Availability)
- 11.2.3 F Hoffmann-La Roche Ltd
- 11.2.3.1. Overview
- 11.2.3.2. Products
- 11.2.3.3. SWOT Analysis
- 11.2.3.4. Recent Developments
- 11.2.3.5. Financials (Based on Availability)
- 11.2.4 ABL bio
- 11.2.4.1. Overview
- 11.2.4.2. Products
- 11.2.4.3. SWOT Analysis
- 11.2.4.4. Recent Developments
- 11.2.4.5. Financials (Based on Availability)
- 11.2.5 AstraZeneca
- 11.2.5.1. Overview
- 11.2.5.2. Products
- 11.2.5.3. SWOT Analysis
- 11.2.5.4. Recent Developments
- 11.2.5.5. Financials (Based on Availability)
- 11.2.6 Teva Pharmaceuticals Industries Ltd
- 11.2.6.1. Overview
- 11.2.6.2. Products
- 11.2.6.3. SWOT Analysis
- 11.2.6.4. Recent Developments
- 11.2.6.5. Financials (Based on Availability)
- 11.2.7 Prevail Therapeutics
- 11.2.7.1. Overview
- 11.2.7.2. Products
- 11.2.7.3. SWOT Analysis
- 11.2.7.4. Recent Developments
- 11.2.7.5. Financials (Based on Availability)
- 11.2.8 Kissei Pharmaceutical Co Ltd
- 11.2.8.1. Overview
- 11.2.8.2. Products
- 11.2.8.3. SWOT Analysis
- 11.2.8.4. Recent Developments
- 11.2.8.5. Financials (Based on Availability)
- 11.2.9 Newron Pharmaceuticals SPA
- 11.2.9.1. Overview
- 11.2.9.2. Products
- 11.2.9.3. SWOT Analysis
- 11.2.9.4. Recent Developments
- 11.2.9.5. Financials (Based on Availability)
- 11.2.10 Viatris
- 11.2.10.1. Overview
- 11.2.10.2. Products
- 11.2.10.3. SWOT Analysis
- 11.2.10.4. Recent Developments
- 11.2.10.5. Financials (Based on Availability)
- 11.2.11 AbbVie Inc
- 11.2.11.1. Overview
- 11.2.11.2. Products
- 11.2.11.3. SWOT Analysis
- 11.2.11.4. Recent Developments
- 11.2.11.5. Financials (Based on Availability)
- 11.2.12 GSK plc
- 11.2.12.1. Overview
- 11.2.12.2. Products
- 11.2.12.3. SWOT Analysis
- 11.2.12.4. Recent Developments
- 11.2.12.5. Financials (Based on Availability)
- 11.2.13 Amneal Pharmaceuticals LLC
- 11.2.13.1. Overview
- 11.2.13.2. Products
- 11.2.13.3. SWOT Analysis
- 11.2.13.4. Recent Developments
- 11.2.13.5. Financials (Based on Availability)
- 11.2.14 Pfizer Inc
- 11.2.14.1. Overview
- 11.2.14.2. Products
- 11.2.14.3. SWOT Analysis
- 11.2.14.4. Recent Developments
- 11.2.14.5. Financials (Based on Availability)
- 11.2.1 Boehringer Ingelheim International GmbH
List of Figures
- Figure 1: Global Parkinson's Disease Therapeutics Industry Revenue Breakdown (Million, %) by Region 2025 & 2033
- Figure 2: Global Parkinson's Disease Therapeutics Industry Volume Breakdown (K Unit, %) by Region 2025 & 2033
- Figure 3: North America Parkinson's Disease Therapeutics Industry Revenue (Million), by Mechanism of Action 2025 & 2033
- Figure 4: North America Parkinson's Disease Therapeutics Industry Volume (K Unit), by Mechanism of Action 2025 & 2033
- Figure 5: North America Parkinson's Disease Therapeutics Industry Revenue Share (%), by Mechanism of Action 2025 & 2033
- Figure 6: North America Parkinson's Disease Therapeutics Industry Volume Share (%), by Mechanism of Action 2025 & 2033
- Figure 7: North America Parkinson's Disease Therapeutics Industry Revenue (Million), by Country 2025 & 2033
- Figure 8: North America Parkinson's Disease Therapeutics Industry Volume (K Unit), by Country 2025 & 2033
- Figure 9: North America Parkinson's Disease Therapeutics Industry Revenue Share (%), by Country 2025 & 2033
- Figure 10: North America Parkinson's Disease Therapeutics Industry Volume Share (%), by Country 2025 & 2033
- Figure 11: Europe Parkinson's Disease Therapeutics Industry Revenue (Million), by Mechanism of Action 2025 & 2033
- Figure 12: Europe Parkinson's Disease Therapeutics Industry Volume (K Unit), by Mechanism of Action 2025 & 2033
- Figure 13: Europe Parkinson's Disease Therapeutics Industry Revenue Share (%), by Mechanism of Action 2025 & 2033
- Figure 14: Europe Parkinson's Disease Therapeutics Industry Volume Share (%), by Mechanism of Action 2025 & 2033
- Figure 15: Europe Parkinson's Disease Therapeutics Industry Revenue (Million), by Country 2025 & 2033
- Figure 16: Europe Parkinson's Disease Therapeutics Industry Volume (K Unit), by Country 2025 & 2033
- Figure 17: Europe Parkinson's Disease Therapeutics Industry Revenue Share (%), by Country 2025 & 2033
- Figure 18: Europe Parkinson's Disease Therapeutics Industry Volume Share (%), by Country 2025 & 2033
- Figure 19: Asia Pacific Parkinson's Disease Therapeutics Industry Revenue (Million), by Mechanism of Action 2025 & 2033
- Figure 20: Asia Pacific Parkinson's Disease Therapeutics Industry Volume (K Unit), by Mechanism of Action 2025 & 2033
- Figure 21: Asia Pacific Parkinson's Disease Therapeutics Industry Revenue Share (%), by Mechanism of Action 2025 & 2033
- Figure 22: Asia Pacific Parkinson's Disease Therapeutics Industry Volume Share (%), by Mechanism of Action 2025 & 2033
- Figure 23: Asia Pacific Parkinson's Disease Therapeutics Industry Revenue (Million), by Country 2025 & 2033
- Figure 24: Asia Pacific Parkinson's Disease Therapeutics Industry Volume (K Unit), by Country 2025 & 2033
- Figure 25: Asia Pacific Parkinson's Disease Therapeutics Industry Revenue Share (%), by Country 2025 & 2033
- Figure 26: Asia Pacific Parkinson's Disease Therapeutics Industry Volume Share (%), by Country 2025 & 2033
- Figure 27: Middle East and Africa Parkinson's Disease Therapeutics Industry Revenue (Million), by Mechanism of Action 2025 & 2033
- Figure 28: Middle East and Africa Parkinson's Disease Therapeutics Industry Volume (K Unit), by Mechanism of Action 2025 & 2033
- Figure 29: Middle East and Africa Parkinson's Disease Therapeutics Industry Revenue Share (%), by Mechanism of Action 2025 & 2033
- Figure 30: Middle East and Africa Parkinson's Disease Therapeutics Industry Volume Share (%), by Mechanism of Action 2025 & 2033
- Figure 31: Middle East and Africa Parkinson's Disease Therapeutics Industry Revenue (Million), by Country 2025 & 2033
- Figure 32: Middle East and Africa Parkinson's Disease Therapeutics Industry Volume (K Unit), by Country 2025 & 2033
- Figure 33: Middle East and Africa Parkinson's Disease Therapeutics Industry Revenue Share (%), by Country 2025 & 2033
- Figure 34: Middle East and Africa Parkinson's Disease Therapeutics Industry Volume Share (%), by Country 2025 & 2033
- Figure 35: South America Parkinson's Disease Therapeutics Industry Revenue (Million), by Mechanism of Action 2025 & 2033
- Figure 36: South America Parkinson's Disease Therapeutics Industry Volume (K Unit), by Mechanism of Action 2025 & 2033
- Figure 37: South America Parkinson's Disease Therapeutics Industry Revenue Share (%), by Mechanism of Action 2025 & 2033
- Figure 38: South America Parkinson's Disease Therapeutics Industry Volume Share (%), by Mechanism of Action 2025 & 2033
- Figure 39: South America Parkinson's Disease Therapeutics Industry Revenue (Million), by Country 2025 & 2033
- Figure 40: South America Parkinson's Disease Therapeutics Industry Volume (K Unit), by Country 2025 & 2033
- Figure 41: South America Parkinson's Disease Therapeutics Industry Revenue Share (%), by Country 2025 & 2033
- Figure 42: South America Parkinson's Disease Therapeutics Industry Volume Share (%), by Country 2025 & 2033
List of Tables
- Table 1: Global Parkinson's Disease Therapeutics Industry Revenue Million Forecast, by Mechanism of Action 2020 & 2033
- Table 2: Global Parkinson's Disease Therapeutics Industry Volume K Unit Forecast, by Mechanism of Action 2020 & 2033
- Table 3: Global Parkinson's Disease Therapeutics Industry Revenue Million Forecast, by Region 2020 & 2033
- Table 4: Global Parkinson's Disease Therapeutics Industry Volume K Unit Forecast, by Region 2020 & 2033
- Table 5: Global Parkinson's Disease Therapeutics Industry Revenue Million Forecast, by Mechanism of Action 2020 & 2033
- Table 6: Global Parkinson's Disease Therapeutics Industry Volume K Unit Forecast, by Mechanism of Action 2020 & 2033
- Table 7: Global Parkinson's Disease Therapeutics Industry Revenue Million Forecast, by Country 2020 & 2033
- Table 8: Global Parkinson's Disease Therapeutics Industry Volume K Unit Forecast, by Country 2020 & 2033
- Table 9: United States Parkinson's Disease Therapeutics Industry Revenue (Million) Forecast, by Application 2020 & 2033
- Table 10: United States Parkinson's Disease Therapeutics Industry Volume (K Unit) Forecast, by Application 2020 & 2033
- Table 11: Canada Parkinson's Disease Therapeutics Industry Revenue (Million) Forecast, by Application 2020 & 2033
- Table 12: Canada Parkinson's Disease Therapeutics Industry Volume (K Unit) Forecast, by Application 2020 & 2033
- Table 13: Mexico Parkinson's Disease Therapeutics Industry Revenue (Million) Forecast, by Application 2020 & 2033
- Table 14: Mexico Parkinson's Disease Therapeutics Industry Volume (K Unit) Forecast, by Application 2020 & 2033
- Table 15: Global Parkinson's Disease Therapeutics Industry Revenue Million Forecast, by Mechanism of Action 2020 & 2033
- Table 16: Global Parkinson's Disease Therapeutics Industry Volume K Unit Forecast, by Mechanism of Action 2020 & 2033
- Table 17: Global Parkinson's Disease Therapeutics Industry Revenue Million Forecast, by Country 2020 & 2033
- Table 18: Global Parkinson's Disease Therapeutics Industry Volume K Unit Forecast, by Country 2020 & 2033
- Table 19: Germany Parkinson's Disease Therapeutics Industry Revenue (Million) Forecast, by Application 2020 & 2033
- Table 20: Germany Parkinson's Disease Therapeutics Industry Volume (K Unit) Forecast, by Application 2020 & 2033
- Table 21: United Kingdom Parkinson's Disease Therapeutics Industry Revenue (Million) Forecast, by Application 2020 & 2033
- Table 22: United Kingdom Parkinson's Disease Therapeutics Industry Volume (K Unit) Forecast, by Application 2020 & 2033
- Table 23: France Parkinson's Disease Therapeutics Industry Revenue (Million) Forecast, by Application 2020 & 2033
- Table 24: France Parkinson's Disease Therapeutics Industry Volume (K Unit) Forecast, by Application 2020 & 2033
- Table 25: Italy Parkinson's Disease Therapeutics Industry Revenue (Million) Forecast, by Application 2020 & 2033
- Table 26: Italy Parkinson's Disease Therapeutics Industry Volume (K Unit) Forecast, by Application 2020 & 2033
- Table 27: Spain Parkinson's Disease Therapeutics Industry Revenue (Million) Forecast, by Application 2020 & 2033
- Table 28: Spain Parkinson's Disease Therapeutics Industry Volume (K Unit) Forecast, by Application 2020 & 2033
- Table 29: Rest of Europe Parkinson's Disease Therapeutics Industry Revenue (Million) Forecast, by Application 2020 & 2033
- Table 30: Rest of Europe Parkinson's Disease Therapeutics Industry Volume (K Unit) Forecast, by Application 2020 & 2033
- Table 31: Global Parkinson's Disease Therapeutics Industry Revenue Million Forecast, by Mechanism of Action 2020 & 2033
- Table 32: Global Parkinson's Disease Therapeutics Industry Volume K Unit Forecast, by Mechanism of Action 2020 & 2033
- Table 33: Global Parkinson's Disease Therapeutics Industry Revenue Million Forecast, by Country 2020 & 2033
- Table 34: Global Parkinson's Disease Therapeutics Industry Volume K Unit Forecast, by Country 2020 & 2033
- Table 35: China Parkinson's Disease Therapeutics Industry Revenue (Million) Forecast, by Application 2020 & 2033
- Table 36: China Parkinson's Disease Therapeutics Industry Volume (K Unit) Forecast, by Application 2020 & 2033
- Table 37: Japan Parkinson's Disease Therapeutics Industry Revenue (Million) Forecast, by Application 2020 & 2033
- Table 38: Japan Parkinson's Disease Therapeutics Industry Volume (K Unit) Forecast, by Application 2020 & 2033
- Table 39: India Parkinson's Disease Therapeutics Industry Revenue (Million) Forecast, by Application 2020 & 2033
- Table 40: India Parkinson's Disease Therapeutics Industry Volume (K Unit) Forecast, by Application 2020 & 2033
- Table 41: Australia Parkinson's Disease Therapeutics Industry Revenue (Million) Forecast, by Application 2020 & 2033
- Table 42: Australia Parkinson's Disease Therapeutics Industry Volume (K Unit) Forecast, by Application 2020 & 2033
- Table 43: South Korea Parkinson's Disease Therapeutics Industry Revenue (Million) Forecast, by Application 2020 & 2033
- Table 44: South Korea Parkinson's Disease Therapeutics Industry Volume (K Unit) Forecast, by Application 2020 & 2033
- Table 45: Rest of Asia Pacific Parkinson's Disease Therapeutics Industry Revenue (Million) Forecast, by Application 2020 & 2033
- Table 46: Rest of Asia Pacific Parkinson's Disease Therapeutics Industry Volume (K Unit) Forecast, by Application 2020 & 2033
- Table 47: Global Parkinson's Disease Therapeutics Industry Revenue Million Forecast, by Mechanism of Action 2020 & 2033
- Table 48: Global Parkinson's Disease Therapeutics Industry Volume K Unit Forecast, by Mechanism of Action 2020 & 2033
- Table 49: Global Parkinson's Disease Therapeutics Industry Revenue Million Forecast, by Country 2020 & 2033
- Table 50: Global Parkinson's Disease Therapeutics Industry Volume K Unit Forecast, by Country 2020 & 2033
- Table 51: GCC Parkinson's Disease Therapeutics Industry Revenue (Million) Forecast, by Application 2020 & 2033
- Table 52: GCC Parkinson's Disease Therapeutics Industry Volume (K Unit) Forecast, by Application 2020 & 2033
- Table 53: South Africa Parkinson's Disease Therapeutics Industry Revenue (Million) Forecast, by Application 2020 & 2033
- Table 54: South Africa Parkinson's Disease Therapeutics Industry Volume (K Unit) Forecast, by Application 2020 & 2033
- Table 55: Rest of Middle East and Africa Parkinson's Disease Therapeutics Industry Revenue (Million) Forecast, by Application 2020 & 2033
- Table 56: Rest of Middle East and Africa Parkinson's Disease Therapeutics Industry Volume (K Unit) Forecast, by Application 2020 & 2033
- Table 57: Global Parkinson's Disease Therapeutics Industry Revenue Million Forecast, by Mechanism of Action 2020 & 2033
- Table 58: Global Parkinson's Disease Therapeutics Industry Volume K Unit Forecast, by Mechanism of Action 2020 & 2033
- Table 59: Global Parkinson's Disease Therapeutics Industry Revenue Million Forecast, by Country 2020 & 2033
- Table 60: Global Parkinson's Disease Therapeutics Industry Volume K Unit Forecast, by Country 2020 & 2033
- Table 61: Brazil Parkinson's Disease Therapeutics Industry Revenue (Million) Forecast, by Application 2020 & 2033
- Table 62: Brazil Parkinson's Disease Therapeutics Industry Volume (K Unit) Forecast, by Application 2020 & 2033
- Table 63: Argentina Parkinson's Disease Therapeutics Industry Revenue (Million) Forecast, by Application 2020 & 2033
- Table 64: Argentina Parkinson's Disease Therapeutics Industry Volume (K Unit) Forecast, by Application 2020 & 2033
- Table 65: Rest of South America Parkinson's Disease Therapeutics Industry Revenue (Million) Forecast, by Application 2020 & 2033
- Table 66: Rest of South America Parkinson's Disease Therapeutics Industry Volume (K Unit) Forecast, by Application 2020 & 2033
Frequently Asked Questions
1. What is the projected Compound Annual Growth Rate (CAGR) of the Parkinson's Disease Therapeutics Industry?
The projected CAGR is approximately 3.58%.
2. Which companies are prominent players in the Parkinson's Disease Therapeutics Industry?
Key companies in the market include Boehringer Ingelheim International GmbH, Novartis AG, F Hoffmann-La Roche Ltd, ABL bio, AstraZeneca, Teva Pharmaceuticals Industries Ltd, Prevail Therapeutics, Kissei Pharmaceutical Co Ltd, Newron Pharmaceuticals SPA, Viatris, AbbVie Inc, GSK plc, Amneal Pharmaceuticals LLC, Pfizer Inc.
3. What are the main segments of the Parkinson's Disease Therapeutics Industry?
The market segments include Mechanism of Action.
4. Can you provide details about the market size?
The market size is estimated to be USD 5.56 Million as of 2022.
5. What are some drivers contributing to market growth?
Rising Geriatric Population and Burden of Parkinson's Disease; Growing Awareness Among the Population; Increasing R&D and Continuous Drug Approvals.
6. What are the notable trends driving market growth?
MAO-B inhibitors Segment is Expected to Dominate the Market Over the Forecast Period.
7. Are there any restraints impacting market growth?
Adverse Events Associated with Therapeutics; High Cost of Treatments Followed by Extremely High R&D Expenditure.
8. Can you provide examples of recent developments in the market?
In March 2022, Neuron23 raised USD 100 million to advance Parkinson's disease therapy. The company intends to commence the trials of NEU-723 to potentially treat Parkinson's disease by the end of this year.
9. What pricing options are available for accessing the report?
Pricing options include single-user, multi-user, and enterprise licenses priced at USD 4750, USD 5250, and USD 8750 respectively.
10. Is the market size provided in terms of value or volume?
The market size is provided in terms of value, measured in Million and volume, measured in K Unit.
11. Are there any specific market keywords associated with the report?
Yes, the market keyword associated with the report is "Parkinson's Disease Therapeutics Industry," which aids in identifying and referencing the specific market segment covered.
12. How do I determine which pricing option suits my needs best?
The pricing options vary based on user requirements and access needs. Individual users may opt for single-user licenses, while businesses requiring broader access may choose multi-user or enterprise licenses for cost-effective access to the report.
13. Are there any additional resources or data provided in the Parkinson's Disease Therapeutics Industry report?
While the report offers comprehensive insights, it's advisable to review the specific contents or supplementary materials provided to ascertain if additional resources or data are available.
14. How can I stay updated on further developments or reports in the Parkinson's Disease Therapeutics Industry?
To stay informed about further developments, trends, and reports in the Parkinson's Disease Therapeutics Industry, consider subscribing to industry newsletters, following relevant companies and organizations, or regularly checking reputable industry news sources and publications.
Methodology
Step 1 - Identification of Relevant Samples Size from Population Database


Step 2 - Approaches for Defining Global Market Size (Value, Volume* & Price*)

Note*: In applicable scenarios
Step 3 - Data Sources
Primary Research
- Web Analytics
- Survey Reports
- Research Institute
- Latest Research Reports
- Opinion Leaders
Secondary Research
- Annual Reports
- White Paper
- Latest Press Release
- Industry Association
- Paid Database
- Investor Presentations

Step 4 - Data Triangulation
Involves using different sources of information in order to increase the validity of a study
These sources are likely to be stakeholders in a program - participants, other researchers, program staff, other community members, and so on.
Then we put all data in single framework & apply various statistical tools to find out the dynamic on the market.
During the analysis stage, feedback from the stakeholder groups would be compared to determine areas of agreement as well as areas of divergence