

Key Insights
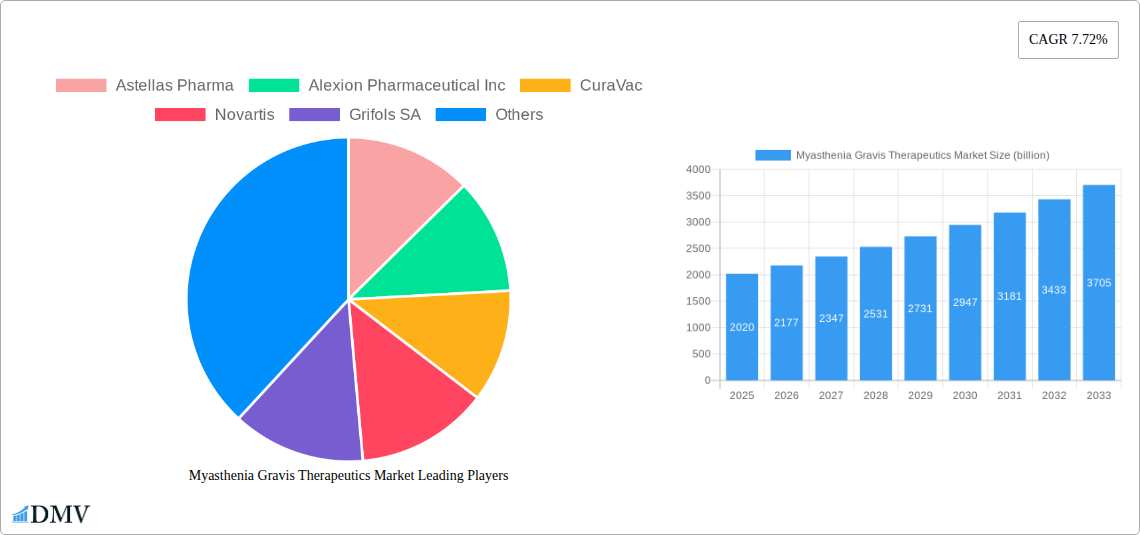
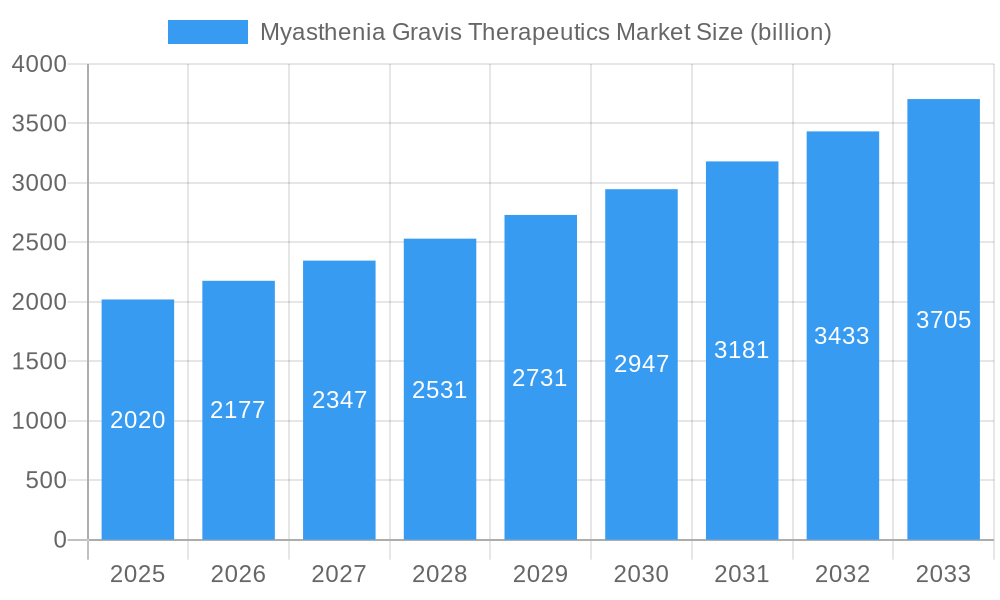
The Myasthenia Gravis (MG) Therapeutics Market is poised for significant expansion, projected to reach USD 2.02 billion in 2025 and experience a robust CAGR of 7.72% through 2033. This growth trajectory is primarily fueled by advancements in treatment methodologies and increasing global awareness of the disease. The market is segmented into medication, surgery, and other treatment options, with medication likely dominating due to its accessibility and evolving efficacy. On the end-user front, hospitals and clinics are expected to be the primary consumers of these therapeutics. Key drivers include the rising prevalence of autoimmune disorders, enhanced diagnostic capabilities leading to earlier detection of MG, and a growing pipeline of innovative drugs targeting the underlying mechanisms of the disease. Pharmaceutical giants like Astellas Pharma, Alexion Pharmaceutical Inc., Novartis, and Argenx are actively investing in research and development, pushing the boundaries of what's possible in MG treatment.
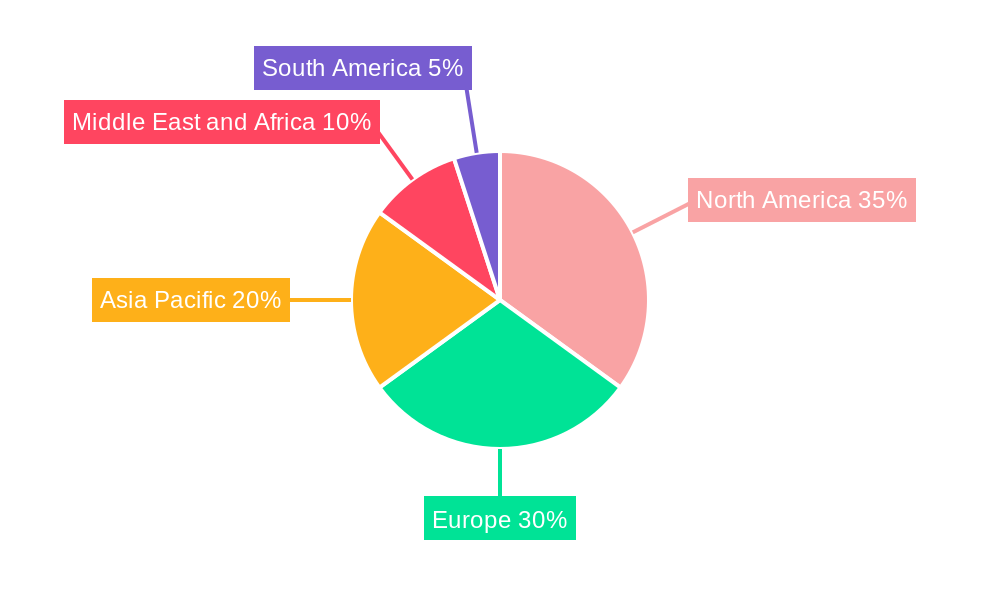
Myasthenia Gravis Therapeutics Market Market Size (In Billion)
Several trends are shaping the Myasthenia Gravis Therapeutics Market. The development of targeted therapies, such as acetylcholine receptor (AChR) and muscle-specific kinase (MuSK) inhibitors, is gaining traction, offering more personalized treatment approaches. The increasing integration of telemedicine and digital health solutions is also facilitating remote patient monitoring and improving access to specialized care, especially in underserved regions. However, the market also faces certain restraints. High treatment costs associated with novel biologics and the potential for side effects can limit widespread adoption. Furthermore, the complex nature of MG and the need for long-term management pose challenges for both patients and healthcare providers. Geographically, North America and Europe currently lead the market, driven by sophisticated healthcare infrastructure and higher healthcare spending. The Asia Pacific region, however, is expected to witness substantial growth due to increasing healthcare investments and a rising number of diagnosed cases.
Myasthenia Gravis Therapeutics Market Company Market Share
This in-depth report provides a strategic analysis of the global Myasthenia Gravis (MG) Therapeutics Market, offering critical insights into market dynamics, growth drivers, and future opportunities. Covering the period from 2019 to 2033, with a base year of 2025 and a forecast period from 2025 to 2033, this report is an essential resource for stakeholders seeking to understand the evolving landscape of MG treatment. The market is projected to reach a valuation of $XX billion by 2033, exhibiting a compound annual growth rate (CAGR) of XX% during the forecast period.
Myasthenia Gravis Therapeutics Market Market Composition & Trends
The Myasthenia Gravis Therapeutics Market is characterized by a moderate level of concentration, with key players continuously innovating to capture market share. The market's trajectory is heavily influenced by advancements in drug discovery, particularly in the development of targeted therapies and biologics. Regulatory landscapes, spearheaded by agencies like the FDA and EMA, play a pivotal role in shaping the approval processes and market access for novel MG treatments. The presence of established medications and the emergence of substitute products, including emerging gene therapies, necessitate a keen understanding of competitive dynamics. End-user profiles are diverse, encompassing hospitals, specialized clinics, and home healthcare settings, each with distinct procurement patterns and treatment preferences. Mergers and acquisitions (M&A) are significant catalysts for market expansion and consolidation, with recent M&A deal values estimated at $XX billion within the historical period. For instance, [Company Name A]’s acquisition of [Company Name B] for $XX million has significantly altered market share distribution.
- Market Share Distribution: Dominant players like Astellas Pharma, Alexion Pharmaceutical Inc., and Novartis hold substantial market shares, driven by their robust pipelines and established product portfolios.
- Innovation Catalysts: The focus on developing disease-modifying therapies, alongside symptomatic relief, is a primary innovation driver.
- Regulatory Landscapes: Stringent but encouraging approval pathways for orphan drugs are fostering investment in rare disease therapeutics.
- Substitute Products: Emerging non-pharmacological interventions and advanced surgical techniques present evolving competition.
- End-User Profiles: Increasing prevalence of home-based care is shaping the demand for accessible and convenient therapeutic solutions.
- M&A Activities: Strategic partnerships and acquisitions are aimed at bolstering R&D capabilities and expanding therapeutic offerings.
Myasthenia Gravis Therapeutics Market Industry Evolution
The Myasthenia Gravis Therapeutics Market has witnessed a significant evolution driven by a confluence of scientific breakthroughs, increasing disease awareness, and a growing unmet medical need. Historically, the treatment of MG primarily relied on symptomatic management, including acetylcholinesterase inhibitors and immunosuppressants. However, the last decade has seen a paradigm shift towards understanding the underlying immunological mechanisms of the disease, leading to the development of targeted therapies. This has profoundly impacted market growth trajectories, moving from a market focused on palliative care to one actively pursuing disease modification and remission. Technological advancements in drug delivery systems, such as long-acting formulations and subcutaneous injections, have enhanced patient compliance and therapeutic efficacy. Furthermore, shifting consumer demands, influenced by greater access to health information and a desire for improved quality of life, are pushing for less invasive and more personalized treatment options. The adoption of biologics and novel small molecules has been steadily increasing, reflecting a growing confidence in these advanced therapeutic modalities. The market size, which was approximately $XX billion in 2019, has experienced a consistent upward trend, driven by a CAGR of XX% during the historical period. This growth is further substantiated by the increasing number of clinical trials and the subsequent approvals of new therapeutic agents. The market's evolution is also a testament to the collaborative efforts between pharmaceutical companies, research institutions, and patient advocacy groups, all working towards better outcomes for individuals living with MG.
Leading Regions, Countries, or Segments in Myasthenia Gravis Therapeutics Market
The Myasthenia Gravis Therapeutics Market is witnessing robust growth across various geographical regions and therapeutic segments, with North America currently leading in market dominance. This leadership is attributed to several key factors, including a high prevalence of rare diseases, a well-established healthcare infrastructure, significant investment in pharmaceutical R&D, and a favorable regulatory environment that encourages innovation. The United States, in particular, stands out as a key country due to its advanced healthcare systems and strong reimbursement policies for novel therapeutics.
Within the Treatment segment, Medication remains the dominant category, encompassing a wide array of therapeutic approaches. This includes anticholinesterase inhibitors, immunosuppressants (corticosteroids, azathioprine, mycophenolate mofetil), and newer biologics targeting specific immune pathways. The introduction of agents like eculizumab (Soliris®) and ravulizumab (Ultomiris®) by Alexion Pharmaceutical Inc., and argenx's efgartigimod alfa (Vyvgart®), has significantly expanded the treatment armamentarium, driving growth in this segment. Surgery, primarily thymectomy, while still a crucial intervention for certain patients, represents a smaller but important segment. The "Others" segment, encompassing plasma exchange and intravenous immunoglobulin (IVIg) therapy, provides critical short-term management but sees less sustained market growth compared to pharmacological interventions.
In terms of End-User, Hospitals are the primary consumers of Myasthenia Gravis therapeutics, owing to the complexity of the disease and the need for specialized medical care, intensive monitoring, and infusion services often required for advanced therapies. Clinics, particularly neurology and specialized autoimmune disease clinics, also play a vital role, offering outpatient management and follow-up care. The "Others" segment, which includes home healthcare providers and specialized pharmacies, is gradually gaining prominence as the market moves towards more patient-centric and decentralized care models, particularly for long-term maintenance therapies.
Dominant Region Drivers (North America):
- High incidence and diagnosis rates of Myasthenia Gravis.
- Significant government and private funding for rare disease research.
- Advanced healthcare infrastructure and early adoption of novel therapies.
- Presence of major pharmaceutical companies with robust MG therapeutic pipelines.
- Supportive reimbursement policies from insurers.
Dominant Treatment Segment Drivers (Medication):
- Continuous development of targeted biologics and disease-modifying agents.
- Increased understanding of MG pathophysiology leading to precise therapeutic interventions.
- Improved patient outcomes and quality of life with newer medications.
- Demand for personalized treatment regimens.
Dominant End-User Drivers (Hospitals):
- Need for specialized medical expertise and intensive patient monitoring.
- Administration requirements for intravenous biologics.
- Comprehensive diagnostic and treatment facilities.
- Prevalence of severe MG cases requiring inpatient care.
Myasthenia Gravis Therapeutics Market Product Innovations
The Myasthenia Gravis Therapeutics Market is a hotbed of innovation, with continuous advancements in drug development and delivery systems. Key product innovations include the development of highly selective antibody-based therapies that target specific immune system components responsible for attacking the neuromuscular junction. For instance, FcRn inhibitors, like efgartigimod alfa, offer a novel mechanism of action by reducing pathogenic IgG autoantibodies, leading to significant symptom improvement. Furthermore, advancements in gene therapy and cell-based therapies are on the horizon, promising long-term remission by addressing the root causes of the disease. These innovations are characterized by improved efficacy, enhanced safety profiles, and more convenient administration routes, such as subcutaneous injections, which significantly improve patient adherence and quality of life.
Propelling Factors for Myasthenia Gravis Therapeutics Market Growth
The growth of the Myasthenia Gravis Therapeutics Market is propelled by a confluence of factors, including rising global awareness and diagnosis rates of MG, leading to a larger patient pool seeking treatment. Significant investments in research and development by leading pharmaceutical companies are yielding a pipeline of innovative and targeted therapies, particularly biologics and small molecules that address the underlying autoimmune mechanisms. Favorable regulatory pathways for orphan drugs, coupled with increasing healthcare expenditure globally, further stimulate market expansion. Technological advancements in drug delivery systems are enhancing therapeutic efficacy and patient compliance.
Obstacles in the Myasthenia Gravis Therapeutics Market Market
Despite promising growth, the Myasthenia Gravis Therapeutics Market faces several obstacles. The high cost of novel biologic therapies poses a significant barrier to access for many patients, leading to concerns about affordability and reimbursement. Stringent and lengthy regulatory approval processes for new drug candidates can delay market entry and increase development costs. Furthermore, the complex and often heterogeneous nature of MG can make diagnosis challenging, leading to delayed treatment initiation. Intense competition from existing treatments and the potential emergence of alternative therapeutic modalities also present competitive pressures. Supply chain disruptions for specialized raw materials and manufacturing challenges for biologics can impact product availability.
Future Opportunities in Myasthenia Gravis Therapeutics Market
The Myasthenia Gravis Therapeutics Market is ripe with emerging opportunities. The development of personalized medicine approaches, leveraging advancements in genetic sequencing and biomarker identification, holds significant potential for tailoring treatments to individual patient needs. Expansion into emerging markets with increasing healthcare access and diagnosis rates presents a vast untapped potential. The exploration of novel therapeutic targets, including those related to T-cell therapies and B-cell depletion, offers avenues for developing next-generation treatments. Furthermore, the increasing focus on patient-reported outcomes and quality of life is driving the demand for therapies that offer sustained symptom control and minimize treatment burden.
Major Players in the Myasthenia Gravis Therapeutics Market Ecosystem
- Astellas Pharma
- Alexion Pharmaceutical Inc
- CuraVac
- Novartis
- Grifols SA
- Argenx
- UCB Pharma
- Immunovant
- Bausch Health
- Mitsubishi Tanabe Pharma
Key Developments in Myasthenia Gravis Therapeutics Market Industry
- January 2024: Argenx announced positive top-line results from a Phase 3 trial of efgartigimod alfa, reinforcing its potential for broaderMG treatment.
- November 2023: UCB Pharma initiated a Phase 2 study for a novel oral therapeutic candidate for MG, signaling continued pipeline expansion.
- August 2023: Alexion Pharmaceutical Inc. received regulatory approval for an expanded indication of ravulizumab, broadening its patient reach.
- March 2023: Immunovant reported promising early-stage data for its FcRn inhibitor, IMVT-1402, in generalized MG.
- December 2022: Novartis presented long-term follow-up data for its investigational MG therapy, highlighting sustained efficacy and safety.
- June 2022: Grifols SA announced the initiation of a global clinical trial program for a novel immunoglobulin therapy for MG.
- February 2022: Astellas Pharma entered into a strategic partnership to accelerate the development of gene therapies for rare neuromuscular diseases, including MG.
- October 2021: Mitsubishi Tanabe Pharma reported successful completion of a Phase 2 study for an oral immunosuppressant in MG patients.
- July 2020: CuraVac announced preliminary results from its early-stage vaccine development program for autoimmune diseases.
- April 2019: Bausch Health expanded its portfolio through an acquisition of a company specializing in rare disease treatments, including potential MG therapies.
Strategic Myasthenia Gravis Therapeutics Market Market Forecast
The strategic outlook for the Myasthenia Gravis Therapeutics Market is exceptionally positive, driven by relentless innovation and an expanding understanding of disease pathogenesis. Key growth catalysts include the anticipated launch of novel biologics and small molecules targeting specific immunological pathways, offering enhanced efficacy and improved patient outcomes. The increasing adoption of personalized medicine, tailored to individual patient profiles and genetic predispositions, will further propel market growth. Furthermore, the expansion of healthcare infrastructure in emerging economies and a growing awareness of MG will unlock significant market potential, positioning the Myasthenia Gravis Therapeutics Market for sustained and robust expansion in the coming years.
Myasthenia Gravis Therapeutics Market Segmentation
-
1. Treatment
- 1.1. Medication
- 1.2. Surgery
- 1.3. Others
-
2. End-User
- 2.1. Hospitals
- 2.2. Clinics
- 2.3. Others
Myasthenia Gravis Therapeutics Market Segmentation By Geography
-
1. North America
- 1.1. United States
- 1.2. Canada
- 1.3. Mexico
-
2. Europe
- 2.1. Germany
- 2.2. United Kingdom
- 2.3. France
- 2.4. Italy
- 2.5. Spain
- 2.6. Rest of Europe
-
3. Asia Pacific
- 3.1. China
- 3.2. Japan
- 3.3. India
- 3.4. Australia
- 3.5. South Korea
- 3.6. Rest of Asia Pacific
-
4. Middle East and Africa
- 4.1. GCC
- 4.2. South Africa
- 4.3. Rest of Middle East and Africa
-
5. South America
- 5.1. Brazil
- 5.2. Argentina
- 5.3. Rest of South America
Myasthenia Gravis Therapeutics Market Regional Market Share
Geographic Coverage of Myasthenia Gravis Therapeutics Market
Myasthenia Gravis Therapeutics Market REPORT HIGHLIGHTS
| Aspects | Details |
|---|---|
| Study Period | 2020-2034 |
| Base Year | 2025 |
| Estimated Year | 2026 |
| Forecast Period | 2026-2034 |
| Historical Period | 2020-2025 |
| Growth Rate | CAGR of 7.72% from 2020-2034 |
| Segmentation |
|
Table of Contents
- 1. Introduction
- 1.1. Research Scope
- 1.2. Market Segmentation
- 1.3. Research Objective
- 1.4. Definitions and Assumptions
- 2. Executive Summary
- 2.1. Market Snapshot
- 3. Market Dynamics
- 3.1. Market Drivers
- 3.2. Market Restrains
- 3.3. Market Trends
- 3.4. Market Opportunities
- 4. Market Factor Analysis
- 4.1. Porters Five Forces
- 4.1.1. Bargaining Power of Suppliers
- 4.1.2. Bargaining Power of Buyers
- 4.1.3. Threat of New Entrants
- 4.1.4. Threat of Substitutes
- 4.1.5. Competitive Rivalry
- 4.2. PESTEL analysis
- 4.3. BCG Analysis
- 4.3.1. Stars (High Growth, High Market Share)
- 4.3.2. Cash Cows (Low Growth, High Market Share)
- 4.3.3. Question Mark (High Growth, Low Market Share)
- 4.3.4. Dogs (Low Growth, Low Market Share)
- 4.4. Ansoff Matrix Analysis
- 4.5. Supply Chain Analysis
- 4.6. Regulatory Landscape
- 4.7. Current Market Potential and Opportunity Assessment (TAM–SAM–SOM Framework)
- 4.8. DMV Analyst Note
- 4.1. Porters Five Forces
- 5. Market Analysis, Insights and Forecast 2021-2033
- 5.1. Market Analysis, Insights and Forecast - by Treatment
- 5.1.1. Medication
- 5.1.2. Surgery
- 5.1.3. Others
- 5.2. Market Analysis, Insights and Forecast - by End-User
- 5.2.1. Hospitals
- 5.2.2. Clinics
- 5.2.3. Others
- 5.3. Market Analysis, Insights and Forecast - by Region
- 5.3.1. North America
- 5.3.2. Europe
- 5.3.3. Asia Pacific
- 5.3.4. Middle East and Africa
- 5.3.5. South America
- 5.1. Market Analysis, Insights and Forecast - by Treatment
- 6. Global Myasthenia Gravis Therapeutics Market Analysis, Insights and Forecast, 2021-2033
- 6.1. Market Analysis, Insights and Forecast - by Treatment
- 6.1.1. Medication
- 6.1.2. Surgery
- 6.1.3. Others
- 6.2. Market Analysis, Insights and Forecast - by End-User
- 6.2.1. Hospitals
- 6.2.2. Clinics
- 6.2.3. Others
- 6.1. Market Analysis, Insights and Forecast - by Treatment
- 7. North America Myasthenia Gravis Therapeutics Market Analysis, Insights and Forecast, 2020-2032
- 7.1. Market Analysis, Insights and Forecast - by Treatment
- 7.1.1. Medication
- 7.1.2. Surgery
- 7.1.3. Others
- 7.2. Market Analysis, Insights and Forecast - by End-User
- 7.2.1. Hospitals
- 7.2.2. Clinics
- 7.2.3. Others
- 7.1. Market Analysis, Insights and Forecast - by Treatment
- 8. Europe Myasthenia Gravis Therapeutics Market Analysis, Insights and Forecast, 2020-2032
- 8.1. Market Analysis, Insights and Forecast - by Treatment
- 8.1.1. Medication
- 8.1.2. Surgery
- 8.1.3. Others
- 8.2. Market Analysis, Insights and Forecast - by End-User
- 8.2.1. Hospitals
- 8.2.2. Clinics
- 8.2.3. Others
- 8.1. Market Analysis, Insights and Forecast - by Treatment
- 9. Asia Pacific Myasthenia Gravis Therapeutics Market Analysis, Insights and Forecast, 2020-2032
- 9.1. Market Analysis, Insights and Forecast - by Treatment
- 9.1.1. Medication
- 9.1.2. Surgery
- 9.1.3. Others
- 9.2. Market Analysis, Insights and Forecast - by End-User
- 9.2.1. Hospitals
- 9.2.2. Clinics
- 9.2.3. Others
- 9.1. Market Analysis, Insights and Forecast - by Treatment
- 10. Middle East and Africa Myasthenia Gravis Therapeutics Market Analysis, Insights and Forecast, 2020-2032
- 10.1. Market Analysis, Insights and Forecast - by Treatment
- 10.1.1. Medication
- 10.1.2. Surgery
- 10.1.3. Others
- 10.2. Market Analysis, Insights and Forecast - by End-User
- 10.2.1. Hospitals
- 10.2.2. Clinics
- 10.2.3. Others
- 10.1. Market Analysis, Insights and Forecast - by Treatment
- 11. South America Myasthenia Gravis Therapeutics Market Analysis, Insights and Forecast, 2020-2032
- 11.1. Market Analysis, Insights and Forecast - by Treatment
- 11.1.1. Medication
- 11.1.2. Surgery
- 11.1.3. Others
- 11.2. Market Analysis, Insights and Forecast - by End-User
- 11.2.1. Hospitals
- 11.2.2. Clinics
- 11.2.3. Others
- 11.1. Market Analysis, Insights and Forecast - by Treatment
- 12. Competitive Analysis
- 12.1. Company Profiles
- 12.1.1 Astellas Pharma
- 12.1.1.1. Company Overview
- 12.1.1.2. Products
- 12.1.1.3. Company Financials
- 12.1.1.4. SWOT Analysis
- 12.1.2 Alexion Pharmaceutical Inc
- 12.1.2.1. Company Overview
- 12.1.2.2. Products
- 12.1.2.3. Company Financials
- 12.1.2.4. SWOT Analysis
- 12.1.3 CuraVac
- 12.1.3.1. Company Overview
- 12.1.3.2. Products
- 12.1.3.3. Company Financials
- 12.1.3.4. SWOT Analysis
- 12.1.4 Novartis
- 12.1.4.1. Company Overview
- 12.1.4.2. Products
- 12.1.4.3. Company Financials
- 12.1.4.4. SWOT Analysis
- 12.1.5 Grifols SA
- 12.1.5.1. Company Overview
- 12.1.5.2. Products
- 12.1.5.3. Company Financials
- 12.1.5.4. SWOT Analysis
- 12.1.6 Argenx
- 12.1.6.1. Company Overview
- 12.1.6.2. Products
- 12.1.6.3. Company Financials
- 12.1.6.4. SWOT Analysis
- 12.1.7 UCB Pharma
- 12.1.7.1. Company Overview
- 12.1.7.2. Products
- 12.1.7.3. Company Financials
- 12.1.7.4. SWOT Analysis
- 12.1.8 Immunovant
- 12.1.8.1. Company Overview
- 12.1.8.2. Products
- 12.1.8.3. Company Financials
- 12.1.8.4. SWOT Analysis
- 12.1.9 Bausch Health
- 12.1.9.1. Company Overview
- 12.1.9.2. Products
- 12.1.9.3. Company Financials
- 12.1.9.4. SWOT Analysis
- 12.1.10 Mitsubishi Tanabe Pharma
- 12.1.10.1. Company Overview
- 12.1.10.2. Products
- 12.1.10.3. Company Financials
- 12.1.10.4. SWOT Analysis
- 12.1.1 Astellas Pharma
- 12.2. Market Entropy
- 12.2.1 Company's Key Areas Served
- 12.2.2 Recent Developments
- 12.3. Company Market Share Analysis 2025
- 12.3.1 Top 5 Companies Market Share Analysis
- 12.3.2 Top 3 Companies Market Share Analysis
- 12.4. List of Potential Customers
- 13. Research Methodology
List of Figures
- Figure 1: Global Myasthenia Gravis Therapeutics Market Revenue Breakdown (billion, %) by Region 2025 & 2033
- Figure 2: Global Myasthenia Gravis Therapeutics Market Volume Breakdown (K Unit, %) by Region 2025 & 2033
- Figure 3: North America Myasthenia Gravis Therapeutics Market Revenue (billion), by Treatment 2025 & 2033
- Figure 4: North America Myasthenia Gravis Therapeutics Market Volume (K Unit), by Treatment 2025 & 2033
- Figure 5: North America Myasthenia Gravis Therapeutics Market Revenue Share (%), by Treatment 2025 & 2033
- Figure 6: North America Myasthenia Gravis Therapeutics Market Volume Share (%), by Treatment 2025 & 2033
- Figure 7: North America Myasthenia Gravis Therapeutics Market Revenue (billion), by End-User 2025 & 2033
- Figure 8: North America Myasthenia Gravis Therapeutics Market Volume (K Unit), by End-User 2025 & 2033
- Figure 9: North America Myasthenia Gravis Therapeutics Market Revenue Share (%), by End-User 2025 & 2033
- Figure 10: North America Myasthenia Gravis Therapeutics Market Volume Share (%), by End-User 2025 & 2033
- Figure 11: North America Myasthenia Gravis Therapeutics Market Revenue (billion), by Country 2025 & 2033
- Figure 12: North America Myasthenia Gravis Therapeutics Market Volume (K Unit), by Country 2025 & 2033
- Figure 13: North America Myasthenia Gravis Therapeutics Market Revenue Share (%), by Country 2025 & 2033
- Figure 14: North America Myasthenia Gravis Therapeutics Market Volume Share (%), by Country 2025 & 2033
- Figure 15: Europe Myasthenia Gravis Therapeutics Market Revenue (billion), by Treatment 2025 & 2033
- Figure 16: Europe Myasthenia Gravis Therapeutics Market Volume (K Unit), by Treatment 2025 & 2033
- Figure 17: Europe Myasthenia Gravis Therapeutics Market Revenue Share (%), by Treatment 2025 & 2033
- Figure 18: Europe Myasthenia Gravis Therapeutics Market Volume Share (%), by Treatment 2025 & 2033
- Figure 19: Europe Myasthenia Gravis Therapeutics Market Revenue (billion), by End-User 2025 & 2033
- Figure 20: Europe Myasthenia Gravis Therapeutics Market Volume (K Unit), by End-User 2025 & 2033
- Figure 21: Europe Myasthenia Gravis Therapeutics Market Revenue Share (%), by End-User 2025 & 2033
- Figure 22: Europe Myasthenia Gravis Therapeutics Market Volume Share (%), by End-User 2025 & 2033
- Figure 23: Europe Myasthenia Gravis Therapeutics Market Revenue (billion), by Country 2025 & 2033
- Figure 24: Europe Myasthenia Gravis Therapeutics Market Volume (K Unit), by Country 2025 & 2033
- Figure 25: Europe Myasthenia Gravis Therapeutics Market Revenue Share (%), by Country 2025 & 2033
- Figure 26: Europe Myasthenia Gravis Therapeutics Market Volume Share (%), by Country 2025 & 2033
- Figure 27: Asia Pacific Myasthenia Gravis Therapeutics Market Revenue (billion), by Treatment 2025 & 2033
- Figure 28: Asia Pacific Myasthenia Gravis Therapeutics Market Volume (K Unit), by Treatment 2025 & 2033
- Figure 29: Asia Pacific Myasthenia Gravis Therapeutics Market Revenue Share (%), by Treatment 2025 & 2033
- Figure 30: Asia Pacific Myasthenia Gravis Therapeutics Market Volume Share (%), by Treatment 2025 & 2033
- Figure 31: Asia Pacific Myasthenia Gravis Therapeutics Market Revenue (billion), by End-User 2025 & 2033
- Figure 32: Asia Pacific Myasthenia Gravis Therapeutics Market Volume (K Unit), by End-User 2025 & 2033
- Figure 33: Asia Pacific Myasthenia Gravis Therapeutics Market Revenue Share (%), by End-User 2025 & 2033
- Figure 34: Asia Pacific Myasthenia Gravis Therapeutics Market Volume Share (%), by End-User 2025 & 2033
- Figure 35: Asia Pacific Myasthenia Gravis Therapeutics Market Revenue (billion), by Country 2025 & 2033
- Figure 36: Asia Pacific Myasthenia Gravis Therapeutics Market Volume (K Unit), by Country 2025 & 2033
- Figure 37: Asia Pacific Myasthenia Gravis Therapeutics Market Revenue Share (%), by Country 2025 & 2033
- Figure 38: Asia Pacific Myasthenia Gravis Therapeutics Market Volume Share (%), by Country 2025 & 2033
- Figure 39: Middle East and Africa Myasthenia Gravis Therapeutics Market Revenue (billion), by Treatment 2025 & 2033
- Figure 40: Middle East and Africa Myasthenia Gravis Therapeutics Market Volume (K Unit), by Treatment 2025 & 2033
- Figure 41: Middle East and Africa Myasthenia Gravis Therapeutics Market Revenue Share (%), by Treatment 2025 & 2033
- Figure 42: Middle East and Africa Myasthenia Gravis Therapeutics Market Volume Share (%), by Treatment 2025 & 2033
- Figure 43: Middle East and Africa Myasthenia Gravis Therapeutics Market Revenue (billion), by End-User 2025 & 2033
- Figure 44: Middle East and Africa Myasthenia Gravis Therapeutics Market Volume (K Unit), by End-User 2025 & 2033
- Figure 45: Middle East and Africa Myasthenia Gravis Therapeutics Market Revenue Share (%), by End-User 2025 & 2033
- Figure 46: Middle East and Africa Myasthenia Gravis Therapeutics Market Volume Share (%), by End-User 2025 & 2033
- Figure 47: Middle East and Africa Myasthenia Gravis Therapeutics Market Revenue (billion), by Country 2025 & 2033
- Figure 48: Middle East and Africa Myasthenia Gravis Therapeutics Market Volume (K Unit), by Country 2025 & 2033
- Figure 49: Middle East and Africa Myasthenia Gravis Therapeutics Market Revenue Share (%), by Country 2025 & 2033
- Figure 50: Middle East and Africa Myasthenia Gravis Therapeutics Market Volume Share (%), by Country 2025 & 2033
- Figure 51: South America Myasthenia Gravis Therapeutics Market Revenue (billion), by Treatment 2025 & 2033
- Figure 52: South America Myasthenia Gravis Therapeutics Market Volume (K Unit), by Treatment 2025 & 2033
- Figure 53: South America Myasthenia Gravis Therapeutics Market Revenue Share (%), by Treatment 2025 & 2033
- Figure 54: South America Myasthenia Gravis Therapeutics Market Volume Share (%), by Treatment 2025 & 2033
- Figure 55: South America Myasthenia Gravis Therapeutics Market Revenue (billion), by End-User 2025 & 2033
- Figure 56: South America Myasthenia Gravis Therapeutics Market Volume (K Unit), by End-User 2025 & 2033
- Figure 57: South America Myasthenia Gravis Therapeutics Market Revenue Share (%), by End-User 2025 & 2033
- Figure 58: South America Myasthenia Gravis Therapeutics Market Volume Share (%), by End-User 2025 & 2033
- Figure 59: South America Myasthenia Gravis Therapeutics Market Revenue (billion), by Country 2025 & 2033
- Figure 60: South America Myasthenia Gravis Therapeutics Market Volume (K Unit), by Country 2025 & 2033
- Figure 61: South America Myasthenia Gravis Therapeutics Market Revenue Share (%), by Country 2025 & 2033
- Figure 62: South America Myasthenia Gravis Therapeutics Market Volume Share (%), by Country 2025 & 2033
List of Tables
- Table 1: Global Myasthenia Gravis Therapeutics Market Revenue billion Forecast, by Treatment 2020 & 2033
- Table 2: Global Myasthenia Gravis Therapeutics Market Volume K Unit Forecast, by Treatment 2020 & 2033
- Table 3: Global Myasthenia Gravis Therapeutics Market Revenue billion Forecast, by End-User 2020 & 2033
- Table 4: Global Myasthenia Gravis Therapeutics Market Volume K Unit Forecast, by End-User 2020 & 2033
- Table 5: Global Myasthenia Gravis Therapeutics Market Revenue billion Forecast, by Region 2020 & 2033
- Table 6: Global Myasthenia Gravis Therapeutics Market Volume K Unit Forecast, by Region 2020 & 2033
- Table 7: Global Myasthenia Gravis Therapeutics Market Revenue billion Forecast, by Treatment 2020 & 2033
- Table 8: Global Myasthenia Gravis Therapeutics Market Volume K Unit Forecast, by Treatment 2020 & 2033
- Table 9: Global Myasthenia Gravis Therapeutics Market Revenue billion Forecast, by End-User 2020 & 2033
- Table 10: Global Myasthenia Gravis Therapeutics Market Volume K Unit Forecast, by End-User 2020 & 2033
- Table 11: Global Myasthenia Gravis Therapeutics Market Revenue billion Forecast, by Country 2020 & 2033
- Table 12: Global Myasthenia Gravis Therapeutics Market Volume K Unit Forecast, by Country 2020 & 2033
- Table 13: United States Myasthenia Gravis Therapeutics Market Revenue (billion) Forecast, by Application 2020 & 2033
- Table 14: United States Myasthenia Gravis Therapeutics Market Volume (K Unit) Forecast, by Application 2020 & 2033
- Table 15: Canada Myasthenia Gravis Therapeutics Market Revenue (billion) Forecast, by Application 2020 & 2033
- Table 16: Canada Myasthenia Gravis Therapeutics Market Volume (K Unit) Forecast, by Application 2020 & 2033
- Table 17: Mexico Myasthenia Gravis Therapeutics Market Revenue (billion) Forecast, by Application 2020 & 2033
- Table 18: Mexico Myasthenia Gravis Therapeutics Market Volume (K Unit) Forecast, by Application 2020 & 2033
- Table 19: Global Myasthenia Gravis Therapeutics Market Revenue billion Forecast, by Treatment 2020 & 2033
- Table 20: Global Myasthenia Gravis Therapeutics Market Volume K Unit Forecast, by Treatment 2020 & 2033
- Table 21: Global Myasthenia Gravis Therapeutics Market Revenue billion Forecast, by End-User 2020 & 2033
- Table 22: Global Myasthenia Gravis Therapeutics Market Volume K Unit Forecast, by End-User 2020 & 2033
- Table 23: Global Myasthenia Gravis Therapeutics Market Revenue billion Forecast, by Country 2020 & 2033
- Table 24: Global Myasthenia Gravis Therapeutics Market Volume K Unit Forecast, by Country 2020 & 2033
- Table 25: Germany Myasthenia Gravis Therapeutics Market Revenue (billion) Forecast, by Application 2020 & 2033
- Table 26: Germany Myasthenia Gravis Therapeutics Market Volume (K Unit) Forecast, by Application 2020 & 2033
- Table 27: United Kingdom Myasthenia Gravis Therapeutics Market Revenue (billion) Forecast, by Application 2020 & 2033
- Table 28: United Kingdom Myasthenia Gravis Therapeutics Market Volume (K Unit) Forecast, by Application 2020 & 2033
- Table 29: France Myasthenia Gravis Therapeutics Market Revenue (billion) Forecast, by Application 2020 & 2033
- Table 30: France Myasthenia Gravis Therapeutics Market Volume (K Unit) Forecast, by Application 2020 & 2033
- Table 31: Italy Myasthenia Gravis Therapeutics Market Revenue (billion) Forecast, by Application 2020 & 2033
- Table 32: Italy Myasthenia Gravis Therapeutics Market Volume (K Unit) Forecast, by Application 2020 & 2033
- Table 33: Spain Myasthenia Gravis Therapeutics Market Revenue (billion) Forecast, by Application 2020 & 2033
- Table 34: Spain Myasthenia Gravis Therapeutics Market Volume (K Unit) Forecast, by Application 2020 & 2033
- Table 35: Rest of Europe Myasthenia Gravis Therapeutics Market Revenue (billion) Forecast, by Application 2020 & 2033
- Table 36: Rest of Europe Myasthenia Gravis Therapeutics Market Volume (K Unit) Forecast, by Application 2020 & 2033
- Table 37: Global Myasthenia Gravis Therapeutics Market Revenue billion Forecast, by Treatment 2020 & 2033
- Table 38: Global Myasthenia Gravis Therapeutics Market Volume K Unit Forecast, by Treatment 2020 & 2033
- Table 39: Global Myasthenia Gravis Therapeutics Market Revenue billion Forecast, by End-User 2020 & 2033
- Table 40: Global Myasthenia Gravis Therapeutics Market Volume K Unit Forecast, by End-User 2020 & 2033
- Table 41: Global Myasthenia Gravis Therapeutics Market Revenue billion Forecast, by Country 2020 & 2033
- Table 42: Global Myasthenia Gravis Therapeutics Market Volume K Unit Forecast, by Country 2020 & 2033
- Table 43: China Myasthenia Gravis Therapeutics Market Revenue (billion) Forecast, by Application 2020 & 2033
- Table 44: China Myasthenia Gravis Therapeutics Market Volume (K Unit) Forecast, by Application 2020 & 2033
- Table 45: Japan Myasthenia Gravis Therapeutics Market Revenue (billion) Forecast, by Application 2020 & 2033
- Table 46: Japan Myasthenia Gravis Therapeutics Market Volume (K Unit) Forecast, by Application 2020 & 2033
- Table 47: India Myasthenia Gravis Therapeutics Market Revenue (billion) Forecast, by Application 2020 & 2033
- Table 48: India Myasthenia Gravis Therapeutics Market Volume (K Unit) Forecast, by Application 2020 & 2033
- Table 49: Australia Myasthenia Gravis Therapeutics Market Revenue (billion) Forecast, by Application 2020 & 2033
- Table 50: Australia Myasthenia Gravis Therapeutics Market Volume (K Unit) Forecast, by Application 2020 & 2033
- Table 51: South Korea Myasthenia Gravis Therapeutics Market Revenue (billion) Forecast, by Application 2020 & 2033
- Table 52: South Korea Myasthenia Gravis Therapeutics Market Volume (K Unit) Forecast, by Application 2020 & 2033
- Table 53: Rest of Asia Pacific Myasthenia Gravis Therapeutics Market Revenue (billion) Forecast, by Application 2020 & 2033
- Table 54: Rest of Asia Pacific Myasthenia Gravis Therapeutics Market Volume (K Unit) Forecast, by Application 2020 & 2033
- Table 55: Global Myasthenia Gravis Therapeutics Market Revenue billion Forecast, by Treatment 2020 & 2033
- Table 56: Global Myasthenia Gravis Therapeutics Market Volume K Unit Forecast, by Treatment 2020 & 2033
- Table 57: Global Myasthenia Gravis Therapeutics Market Revenue billion Forecast, by End-User 2020 & 2033
- Table 58: Global Myasthenia Gravis Therapeutics Market Volume K Unit Forecast, by End-User 2020 & 2033
- Table 59: Global Myasthenia Gravis Therapeutics Market Revenue billion Forecast, by Country 2020 & 2033
- Table 60: Global Myasthenia Gravis Therapeutics Market Volume K Unit Forecast, by Country 2020 & 2033
- Table 61: GCC Myasthenia Gravis Therapeutics Market Revenue (billion) Forecast, by Application 2020 & 2033
- Table 62: GCC Myasthenia Gravis Therapeutics Market Volume (K Unit) Forecast, by Application 2020 & 2033
- Table 63: South Africa Myasthenia Gravis Therapeutics Market Revenue (billion) Forecast, by Application 2020 & 2033
- Table 64: South Africa Myasthenia Gravis Therapeutics Market Volume (K Unit) Forecast, by Application 2020 & 2033
- Table 65: Rest of Middle East and Africa Myasthenia Gravis Therapeutics Market Revenue (billion) Forecast, by Application 2020 & 2033
- Table 66: Rest of Middle East and Africa Myasthenia Gravis Therapeutics Market Volume (K Unit) Forecast, by Application 2020 & 2033
- Table 67: Global Myasthenia Gravis Therapeutics Market Revenue billion Forecast, by Treatment 2020 & 2033
- Table 68: Global Myasthenia Gravis Therapeutics Market Volume K Unit Forecast, by Treatment 2020 & 2033
- Table 69: Global Myasthenia Gravis Therapeutics Market Revenue billion Forecast, by End-User 2020 & 2033
- Table 70: Global Myasthenia Gravis Therapeutics Market Volume K Unit Forecast, by End-User 2020 & 2033
- Table 71: Global Myasthenia Gravis Therapeutics Market Revenue billion Forecast, by Country 2020 & 2033
- Table 72: Global Myasthenia Gravis Therapeutics Market Volume K Unit Forecast, by Country 2020 & 2033
- Table 73: Brazil Myasthenia Gravis Therapeutics Market Revenue (billion) Forecast, by Application 2020 & 2033
- Table 74: Brazil Myasthenia Gravis Therapeutics Market Volume (K Unit) Forecast, by Application 2020 & 2033
- Table 75: Argentina Myasthenia Gravis Therapeutics Market Revenue (billion) Forecast, by Application 2020 & 2033
- Table 76: Argentina Myasthenia Gravis Therapeutics Market Volume (K Unit) Forecast, by Application 2020 & 2033
- Table 77: Rest of South America Myasthenia Gravis Therapeutics Market Revenue (billion) Forecast, by Application 2020 & 2033
- Table 78: Rest of South America Myasthenia Gravis Therapeutics Market Volume (K Unit) Forecast, by Application 2020 & 2033
Frequently Asked Questions
1. What is the projected Compound Annual Growth Rate (CAGR) of the Myasthenia Gravis Therapeutics Market?
The projected CAGR is approximately 7.72%.
2. Which companies are prominent players in the Myasthenia Gravis Therapeutics Market?
Key companies in the market include Astellas Pharma, Alexion Pharmaceutical Inc, CuraVac, Novartis, Grifols SA, Argenx, UCB Pharma, Immunovant, Bausch Health, Mitsubishi Tanabe Pharma.
3. What are the main segments of the Myasthenia Gravis Therapeutics Market?
The market segments include Treatment, End-User.
4. Can you provide details about the market size?
The market size is estimated to be USD 2.02 billion as of 2022.
5. What are some drivers contributing to market growth?
; Rising Incidence of Myasthenia Gravis; Increasing Research and Development for Myasthenia Gravis.
6. What are the notable trends driving market growth?
Medications are Expected to Cover a Large Share of the Market.
7. Are there any restraints impacting market growth?
; High Cost of Treatment.
8. Can you provide examples of recent developments in the market?
N/A
9. What pricing options are available for accessing the report?
Pricing options include single-user, multi-user, and enterprise licenses priced at USD 4750, USD 5250, and USD 8750 respectively.
10. Is the market size provided in terms of value or volume?
The market size is provided in terms of value, measured in billion and volume, measured in K Unit.
11. Are there any specific market keywords associated with the report?
Yes, the market keyword associated with the report is "Myasthenia Gravis Therapeutics Market," which aids in identifying and referencing the specific market segment covered.
12. How do I determine which pricing option suits my needs best?
The pricing options vary based on user requirements and access needs. Individual users may opt for single-user licenses, while businesses requiring broader access may choose multi-user or enterprise licenses for cost-effective access to the report.
13. Are there any additional resources or data provided in the Myasthenia Gravis Therapeutics Market report?
While the report offers comprehensive insights, it's advisable to review the specific contents or supplementary materials provided to ascertain if additional resources or data are available.
14. How can I stay updated on further developments or reports in the Myasthenia Gravis Therapeutics Market?
To stay informed about further developments, trends, and reports in the Myasthenia Gravis Therapeutics Market, consider subscribing to industry newsletters, following relevant companies and organizations, or regularly checking reputable industry news sources and publications.
Methodology
Step 1 - Identification of Relevant Samples Size from Population Database


Step 2 - Approaches for Defining Global Market Size (Value, Volume* & Price*)

Note*: In applicable scenarios
Step 3 - Data Sources
Primary Research
- Web Analytics
- Survey Reports
- Research Institute
- Latest Research Reports
- Opinion Leaders
Secondary Research
- Annual Reports
- White Paper
- Latest Press Release
- Industry Association
- Paid Database
- Investor Presentations

Step 4 - Data Triangulation
Involves using different sources of information in order to increase the validity of a study
These sources are likely to be stakeholders in a program - participants, other researchers, program staff, other community members, and so on.
Then we put all data in single framework & apply various statistical tools to find out the dynamic on the market.
During the analysis stage, feedback from the stakeholder groups would be compared to determine areas of agreement as well as areas of divergence