

Key Insights
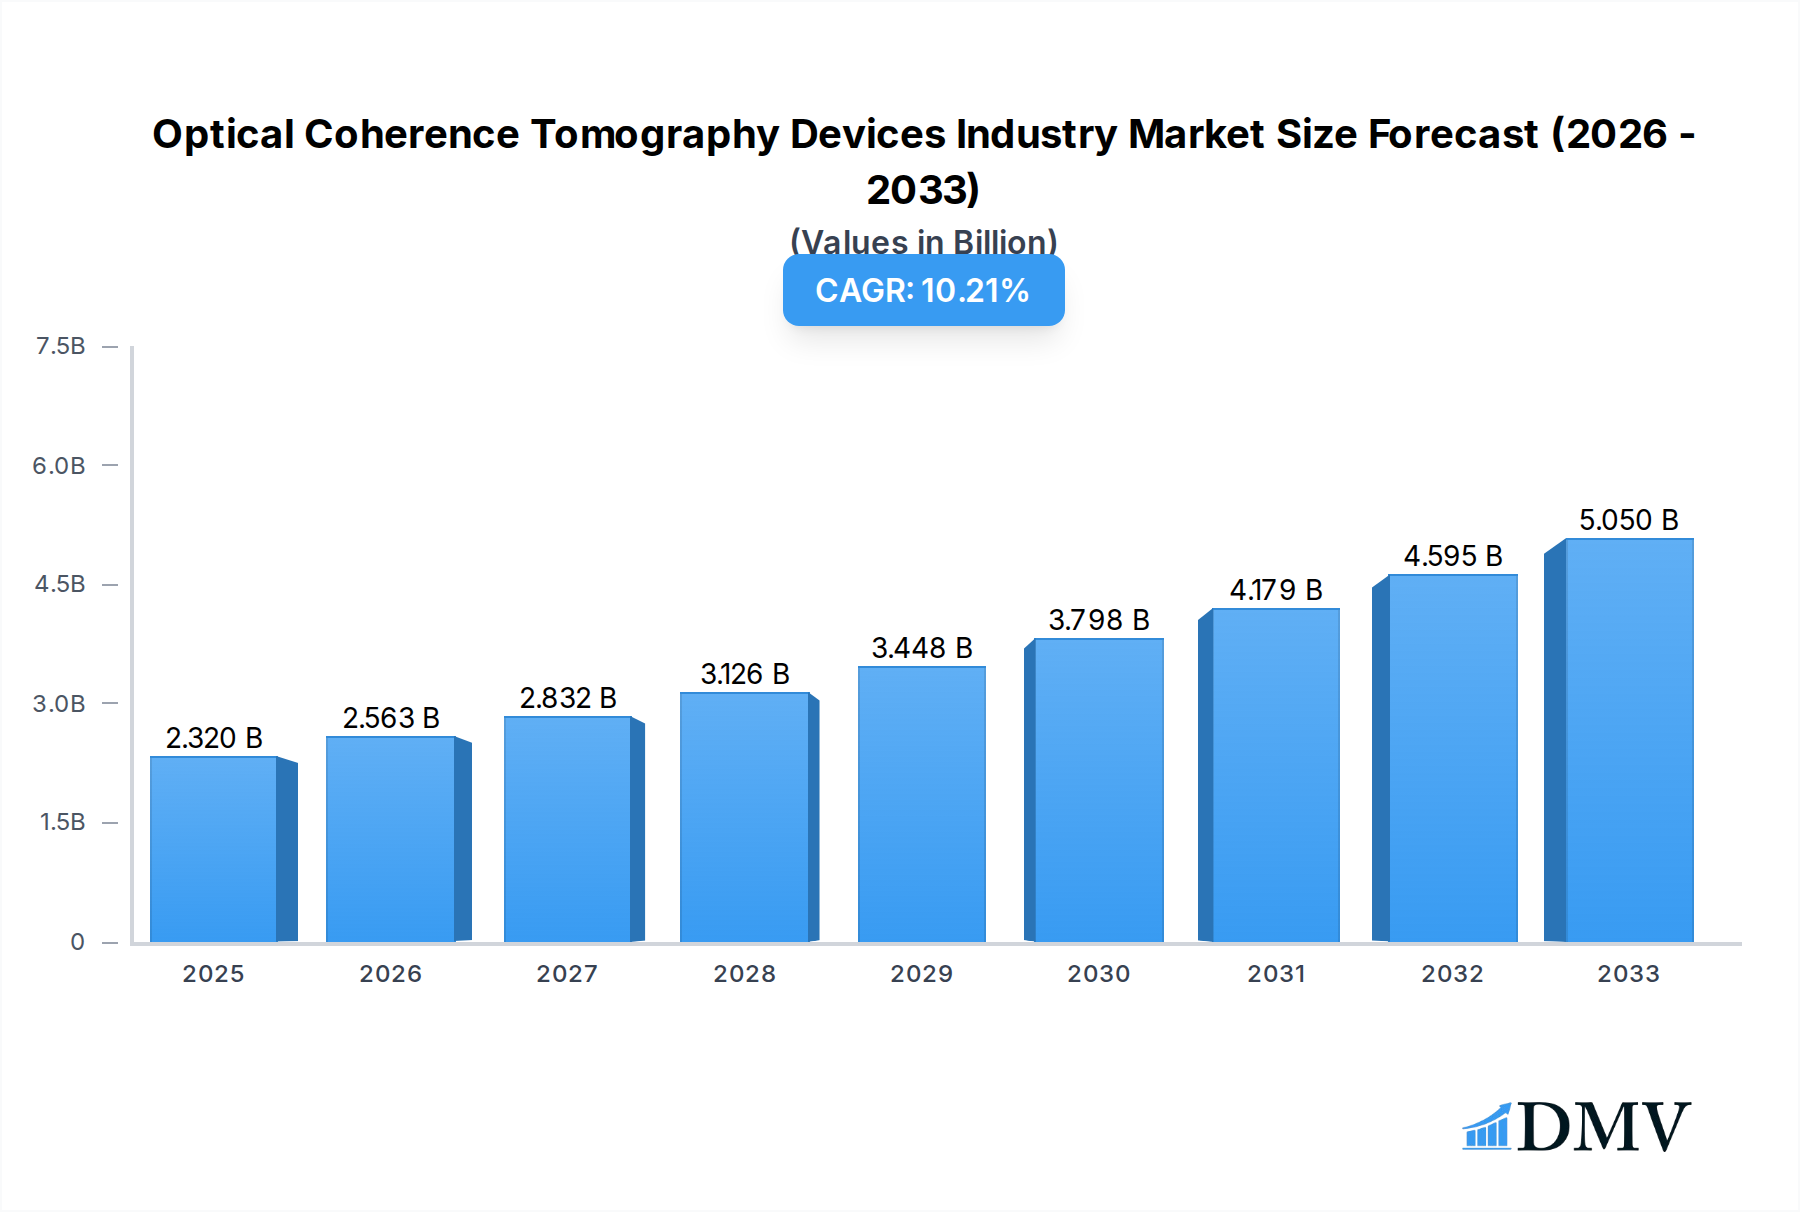
The global Optical Coherence Tomography (OCT) Devices market is poised for substantial growth, projected to reach $2.32 billion in 2025 and expand at a robust Compound Annual Growth Rate (CAGR) of 10.5% from 2025 to 2033. This impressive trajectory is propelled by several key drivers, including the increasing prevalence of chronic diseases such as cardiovascular conditions and eye disorders, demanding advanced diagnostic capabilities. The growing adoption of OCT in ophthalmology for retinal imaging, glaucoma diagnosis, and diabetic retinopathy assessment is a significant contributor. Furthermore, the expanding applications of OCT in dermatology for skin cancer detection and in cardiovascular imaging for plaque characterization are creating new avenues for market expansion. Technological advancements, leading to higher resolution, faster scanning speeds, and miniaturized, portable OCT devices, are also playing a crucial role in driving market penetration across diverse healthcare settings. The rising global healthcare expenditure and increasing demand for minimally invasive diagnostic procedures further bolster the market's positive outlook.

Optical Coherence Tomography Devices Industry Market Size (In Billion)
The market segmentation reveals a dynamic landscape, with handheld OCT devices gaining traction due to their portability and ease of use, complementing traditional tabletop systems. In terms of applications, ophthalmology remains the dominant segment, owing to its established use and continuous innovation. However, the dermatology and cardiovascular segments are exhibiting rapid growth, driven by the development of specialized OCT probes and algorithms. Geographically, North America and Europe currently lead the market, fueled by advanced healthcare infrastructure and high R&D investments. The Asia Pacific region is anticipated to witness the fastest growth, propelled by increasing healthcare access, a burgeoning patient pool, and growing government initiatives to promote advanced medical technologies. Restraints such as the high cost of OCT devices and the need for skilled personnel are being gradually addressed through technological innovation and training programs, paving the way for sustained market expansion. Key players like Heidelberg Engineering Inc., Optovue Inc., and Carl Zeiss AG are actively involved in research and development, launching innovative products and expanding their market reach to capitalize on these growth opportunities.
Optical Coherence Tomography Devices Industry Company Market Share
This comprehensive report delves into the dynamic Optical Coherence Tomography (OCT) devices market, providing an in-depth analysis of its composition, trends, evolution, and future trajectory. Covering the study period of 2019–2033, with a base year of 2025, this report offers actionable insights for stakeholders, including manufacturers, healthcare providers, investors, and researchers. We explore market segmentation by type (Handheld OCT devices, Tabletop OCT devices) and application (Dermatology, Ophthalmology, Cardiovascular, Others), alongside a detailed examination of leading regions and key industry developments. The analysis includes market size projections in billions, technological advancements, competitive landscapes, and strategic forecasts, ensuring a complete understanding of this critical medical imaging sector.
Optical Coherence Tomography Devices Industry Market Composition & Trends
The Optical Coherence Tomography (OCT) devices market is characterized by a moderate to high concentration, with key players like Carl Zeiss AG, Heidelberg Engineering Inc., and Topcon Corporation holding significant market shares. Innovation catalysts are primarily driven by advancements in imaging resolution, speed, and miniaturization, leading to the development of portable and user-friendly devices. The regulatory landscape, overseen by bodies such as the FDA and EMA, plays a crucial role in product approval and market access, influencing market entry strategies for new entrants. Substitute products, though limited in their ability to replicate OCT’s subsurface imaging capabilities, include ultrasound and MRI in certain diagnostic contexts. End-user profiles range from large hospital networks and specialized clinics to private practices, each with varying demands for OCT technology based on budget, patient volume, and specific clinical needs. Merger and acquisition (M&A) activities are present, with deal values ranging from tens to hundreds of millions of dollars, as companies seek to expand their product portfolios, gain access to new technologies, or consolidate their market positions. Recent M&A activities and strategic partnerships are expected to further shape market dynamics in the coming years, impacting market share distribution. The market is projected to reach a valuation of over $5 billion by 2025, with continued growth driven by increasing adoption in various medical specialties.
Optical Coherence Tomography Devices Industry Industry Evolution
The Optical Coherence Tomography (OCT) devices industry has witnessed a remarkable evolution over the historical period of 2019–2024, demonstrating consistent growth and technological sophistication. Driven by an escalating need for non-invasive, high-resolution imaging, the market has transitioned from predominantly specialized ophthalmic applications to broader clinical use across dermatology, cardiovascular imaging, and other medical fields. The compound annual growth rate (CAGR) during the historical period averaged approximately 8% to 10%, underscoring strong market momentum. This growth trajectory is directly correlated with significant technological advancements. Early OCT systems, while groundbreaking, were often bulky and complex. However, continuous research and development have led to the miniaturization of devices, enhanced scan speeds, and improved image processing algorithms. This evolution has resulted in the development of handheld OCT devices, offering greater portability and accessibility in diverse clinical settings. The adoption metrics for OCT technology have steadily increased, with a notable surge in its use for early disease detection and treatment monitoring. Shifting consumer demands, influenced by a greater awareness of the benefits of early and accurate diagnosis, have further propelled the adoption of OCT. Patients and healthcare providers alike are increasingly prioritizing diagnostic tools that offer non-invasive procedures, reduced patient discomfort, and faster diagnostic turnaround times, all of which are core advantages of OCT technology. The market size, estimated to be around $3.5 billion in 2024, is on track for substantial expansion. The increasing prevalence of chronic diseases, such as age-related macular degeneration (AMD) in ophthalmology and various dermatological conditions, coupled with an aging global population, are creating a sustained demand for advanced diagnostic imaging solutions like OCT. Furthermore, ongoing efforts by manufacturers to reduce the cost of OCT devices and to integrate them seamlessly into existing healthcare IT infrastructure are facilitating wider adoption, particularly in emerging economies. The industry is also benefiting from a growing body of clinical evidence validating the efficacy of OCT in various diagnostic and therapeutic applications, which further bolsters confidence among clinicians and payers. The projected market size for the base year of 2025 is anticipated to exceed $5 billion, reflecting this sustained upward trend.
Leading Regions, Countries, or Segments in Optical Coherence Tomography Devices Industry
The Optical Coherence Tomography (OCT) devices industry demonstrates clear leadership across several key segments and geographical regions, driven by distinct factors.
Type Segmentation Dominance:
Tabletop OCT Devices: This segment currently holds the dominant market share, accounting for an estimated 70% of the total market value.
- Key Drivers:
- Established Clinical Integration: Tabletop OCT devices have a long-standing presence in ophthalmology clinics and diagnostic centers, making them the go-to solution for detailed retinal imaging and other sub-surface analyses.
- Higher Resolution and Advanced Features: These devices often offer superior image resolution, wider field of view, and a more extensive range of advanced imaging modalities compared to handheld counterparts, catering to complex diagnostic needs.
- Robust Performance: The larger footprint allows for more sophisticated optical components and processing power, leading to enhanced performance and reliability for critical diagnostic procedures.
- Reimbursement Frameworks: Well-established reimbursement codes for procedures utilizing tabletop OCT systems further incentivize their adoption and continued use in healthcare settings.
- Key Drivers:
Handheld OCT Devices: While currently holding a smaller market share (estimated 30%), this segment is experiencing the fastest growth.
- Key Drivers:
- Increasing Portability and Accessibility: The miniaturization of OCT technology has enabled the development of handheld devices, offering unprecedented portability for use at the point of care, in remote locations, or during surgical procedures.
- Cost-Effectiveness: Handheld OCT devices are generally more affordable than their tabletop counterparts, making them accessible to a wider range of healthcare providers, including smaller clinics and physician offices.
- Expanding Applications: Innovations are continuously expanding the application scope of handheld OCT into areas like dermatology and bedside diagnostics, driving demand.
- Ease of Use: User-friendly interfaces and simplified operation are making handheld OCT devices more appealing to clinicians seeking efficient diagnostic tools.
- Key Drivers:
Application Segmentation Dominance:
Ophthalmology: This remains the largest and most mature application segment for OCT devices, representing approximately 65% of the total market.
- Key Drivers:
- Critical Diagnostic Tool: OCT is indispensable for diagnosing and monitoring a wide spectrum of retinal diseases, including age-related macular degeneration (AMD), diabetic retinopathy, glaucoma, and macular edema.
- Technological Sophistication: The segment benefits from continuous advancements in OCT angiography (OCTA) and swept-source OCT, offering deeper penetration and higher resolution for intricate ocular structures.
- High Prevalence of Eye Diseases: The global rise in the prevalence of age-related eye conditions and diabetes, a major contributor to diabetic retinopathy, fuels sustained demand.
- Key Drivers:
Dermatology: This segment is experiencing rapid growth and is projected to become a significant market contributor, currently holding around 15% of the market.
- Key Drivers:
- Non-Invasive Skin Imaging: OCT allows for in-vivo imaging of skin layers, aiding in the diagnosis and management of conditions like skin cancer, psoriasis, and inflammatory diseases without the need for biopsies.
- Pre-Surgical Planning: Dermatologists utilize OCT for precise demarcation of tumor margins, guiding surgical excisions and improving cosmetic outcomes.
- Therapeutic Monitoring: OCT can track the efficacy of topical treatments and monitor disease progression in real-time.
- Key Drivers:
Cardiovascular: This segment represents about 10% of the market, with growing potential.
- Key Drivers:
- Intravascular OCT (IV-OCT): IV-OCT is crucial for visualizing atherosclerotic plaques, assessing stent placement, and guiding interventions in cardiology.
- Improved Plaque Characterization: OCT provides detailed insights into plaque composition, thickness, and morphology, aiding in risk stratification and personalized treatment strategies.
- Key Drivers:
Others: This segment, encompassing applications in neurology, gastroenterology, and research, accounts for the remaining 10%.
- Key Drivers:
- Emerging Research Applications: Ongoing research is exploring OCT’s potential in various preclinical and clinical settings, paving the way for new diagnostic and therapeutic uses.
- Advancements in Endoscopy: Integration of OCT with endoscopic platforms is opening new avenues for internal organ imaging.
- Key Drivers:
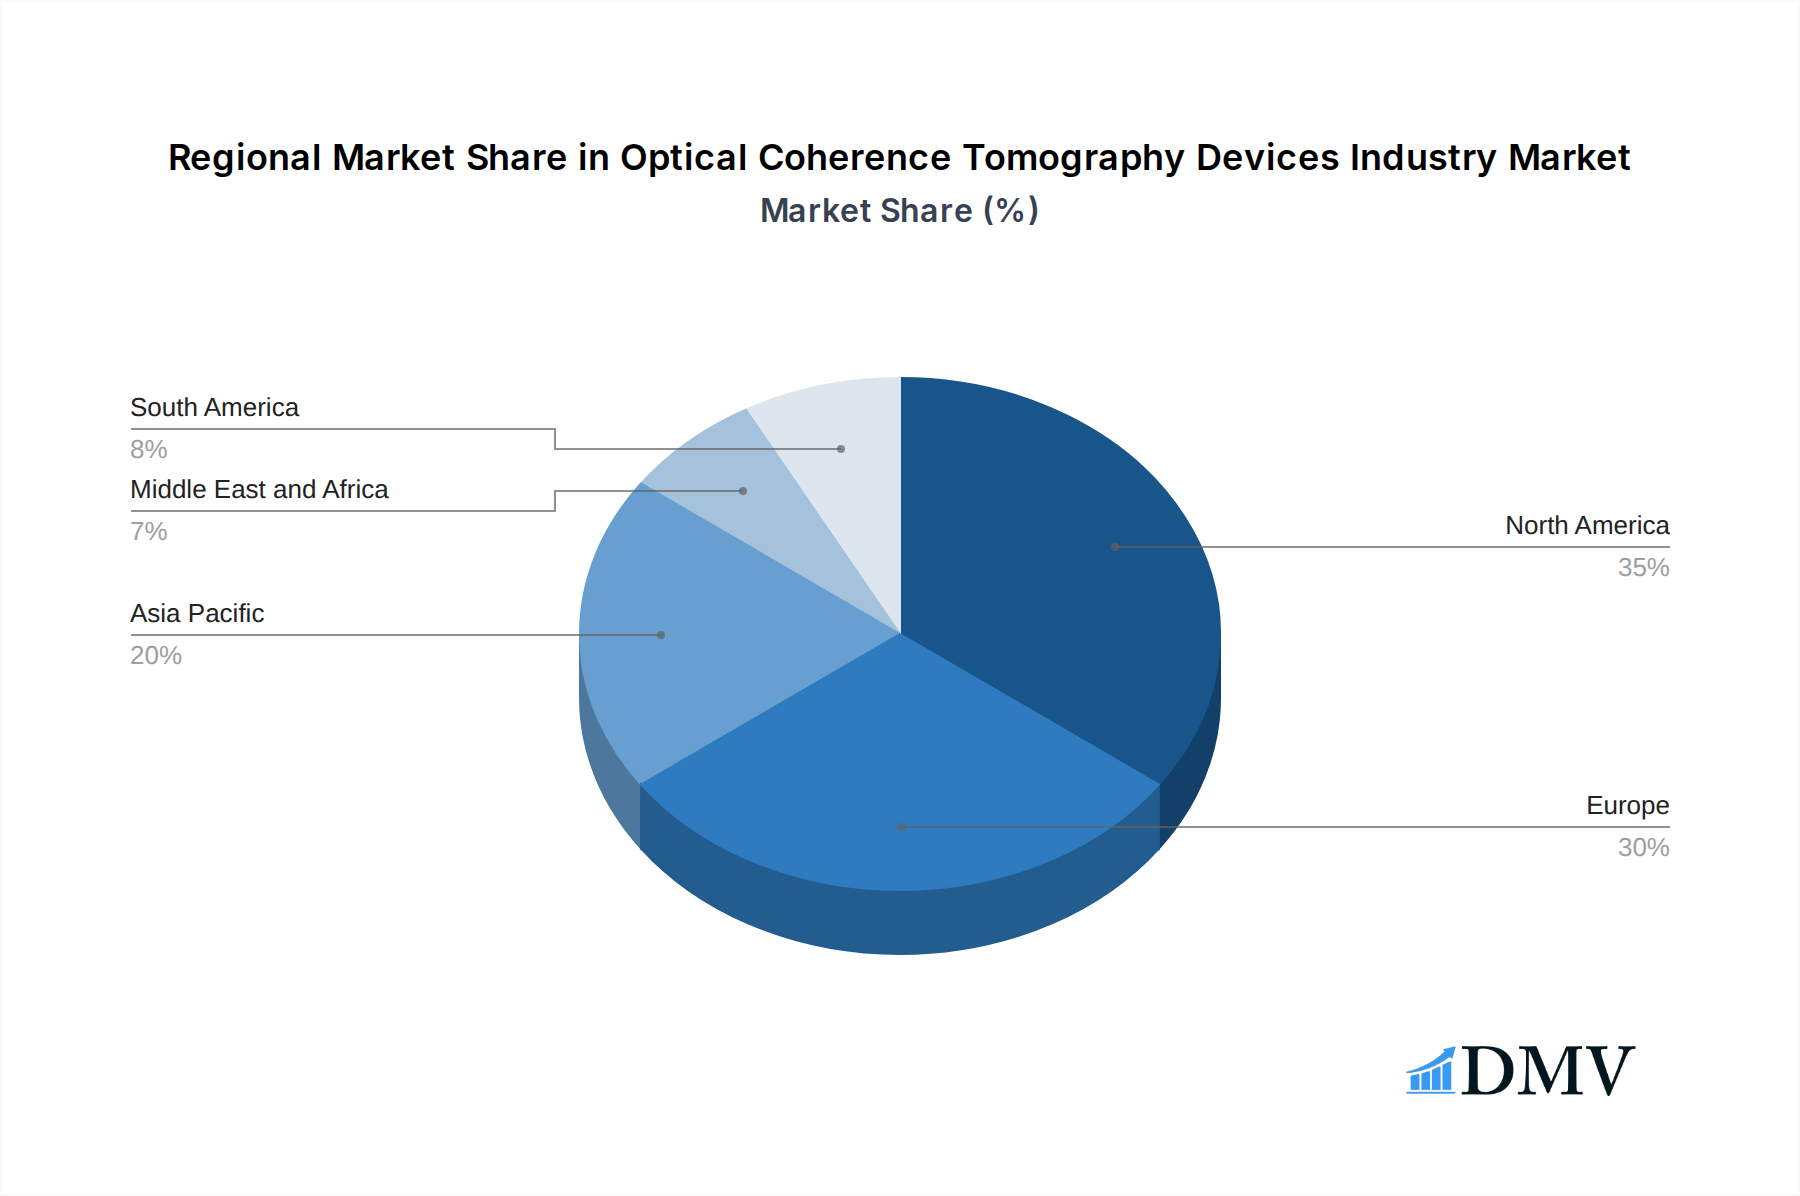
Geographical Dominance:
North America currently leads the global OCT devices market, estimated to account for over 35% of the market share. This dominance is attributed to several factors:
- Advanced Healthcare Infrastructure: The presence of a well-established healthcare system with significant investment in medical technology drives the adoption of advanced diagnostic tools.
- High Prevalence of Chronic Diseases: The high incidence of ophthalmic, dermatological, and cardiovascular diseases necessitates sophisticated diagnostic solutions.
- Strong R&D Ecosystem: Robust research institutions and funding initiatives foster innovation and the development of cutting-edge OCT technologies.
- Favorable Regulatory Environment: A supportive regulatory framework, including efficient approval processes by the FDA, facilitates market entry for new OCT devices.
Europe follows closely, driven by similar factors, including a strong healthcare sector and a growing aging population. The Asia-Pacific region is emerging as a high-growth market due to increasing healthcare expenditure, rising awareness of advanced diagnostic imaging, and a large patient pool.
Optical Coherence Tomography Devices Industry Product Innovations
Product innovations in the Optical Coherence Tomography (OCT) devices industry are focused on enhancing imaging capabilities, improving user experience, and expanding application reach. Recent advancements include the development of ultra-high resolution OCT systems capable of visualizing cellular-level details, crucial for early disease detection in ophthalmology and precise tissue characterization in dermatology. The integration of Artificial Intelligence (AI) and machine learning algorithms is revolutionizing image analysis, enabling automated disease detection, quantification, and prognostication, thereby improving diagnostic accuracy and efficiency. Furthermore, the miniaturization of OCT technology has led to the proliferation of handheld and portable devices, offering greater accessibility and enabling point-of-care diagnostics in diverse clinical settings. OCT Angiography (OCTA) has emerged as a significant innovation, providing non-invasive visualization of microvasculature without the need for contrast agents, particularly transformative in ophthalmology and cardiology. These innovations collectively aim to provide faster, more accurate, and less invasive diagnostic solutions, driving market growth and clinical adoption.
Propelling Factors for Optical Coherence Tomography Devices Industry Growth
Several key factors are propelling the Optical Coherence Tomography (OCT) devices industry toward sustained growth. Technological advancements, particularly in imaging resolution, speed, and miniaturization, are making OCT systems more versatile and accessible. The increasing prevalence of chronic diseases, such as age-related macular degeneration, glaucoma, and cardiovascular diseases, creates a substantial demand for accurate diagnostic tools. Furthermore, the growing global geriatric population, which is more susceptible to these conditions, amplifies this demand. A rising awareness among healthcare professionals and patients regarding the benefits of early and non-invasive diagnosis through OCT contributes significantly. Favorable reimbursement policies and increasing healthcare expenditure, especially in emerging economies, are also playing a crucial role in expanding market penetration. The continuous exploration and validation of new clinical applications, beyond traditional ophthalmology, into fields like dermatology and neurology, are opening up significant market opportunities.
Obstacles in the Optical Coherence Tomography Devices Industry Market
Despite its promising growth, the Optical Coherence Tomography (OCT) devices industry faces several obstacles. The high cost of advanced OCT systems remains a significant barrier to adoption, particularly for smaller clinics and in developing economies. Stringent regulatory approval processes for new OCT devices and software updates can lead to lengthy market entry timelines and increased development costs. The need for specialized training for healthcare professionals to effectively operate and interpret OCT scans can also be a hurdle, requiring substantial investment in education and skill development. Furthermore, the presence of established imaging modalities and the development of competitive technologies can pose market challenges. Supply chain disruptions, as experienced in recent years, can impact the availability of components and the timely delivery of OCT devices, potentially affecting market growth and customer satisfaction.
Future Opportunities in Optical Coherence Tomography Devices Industry
The Optical Coherence Tomography (OCT) devices industry is poised for significant future opportunities. The expanding applications of OCT in dermatology, cardiovascular imaging, and neurology present substantial avenues for market growth. The integration of Artificial Intelligence (AI) and machine learning with OCT systems promises to enhance diagnostic accuracy, automate image analysis, and personalize treatment plans, creating a strong demand for AI-enabled OCT devices. The development of more compact, portable, and affordable handheld OCT devices will drive adoption in point-of-care settings and underserved regions. Furthermore, ongoing research into novel OCT techniques, such as ultra-high resolution OCT and OCT angiography with enhanced contrast, will unlock new diagnostic capabilities and clinical applications. The increasing global healthcare spending, coupled with a growing focus on preventive healthcare and early disease detection, will continue to fuel the demand for advanced OCT imaging solutions.
Major Players in the Optical Coherence Tomography Devices Industry Ecosystem
- Heidelberg Engineering Inc.
- Optovue Inc.
- Agfa Healthcare
- Thorlabs
- Carl Zeiss AG
- Terumo Medical Corporation
- Topcon Corporation
- OPTOPOL Technology
- Leica Microsystems (Danaher)
- Novacam Technologies
Key Developments in Optical Coherence Tomography Devices Industry Industry
- April 2022: Alcon reinforced its training and education initiatives with the introduction of the Alcon Fidelis Virtual Reality (VR) Ophthalmic Surgical Simulator, a portable VR tool designed for training cataract surgeons. This development underscores the industry's focus on innovative educational tools and advanced simulation for medical professionals.
- January 2022: Haag-Streit UK (HS-UK) launched its Optovue iScan80 in the country. This high-speed OCT system is designed for practices seeking an affordable and versatile solution. The iScan80's integrated design, combining the operator interface, display, patient interface, and scan head into a single console, makes it particularly suitable for space-constrained environments and enhances user efficiency.
Strategic Optical Coherence Tomography Devices Industry Market Forecast
The Optical Coherence Tomography (OCT) devices industry is projected for robust growth, driven by ongoing technological innovation and expanding clinical applications. The increasing adoption of OCT in ophthalmology, dermatology, and cardiovascular imaging, coupled with its growing use in emerging markets, will fuel market expansion. The integration of AI and machine learning in OCT systems presents a significant opportunity for enhanced diagnostic accuracy and personalized medicine, thereby creating demand for advanced solutions. The continuous development of portable and cost-effective OCT devices will further democratize access to this crucial diagnostic technology, especially in resource-limited settings. Strategic investments in research and development, coupled with favorable regulatory pathways, are expected to foster a dynamic market landscape. The market is anticipated to witness a CAGR of approximately 7-9% during the forecast period, reaching an estimated value exceeding $10 billion by 2033.
Optical Coherence Tomography Devices Industry Segmentation
-
1. Type
- 1.1. Handheld OCT devices
- 1.2. Tabletop OCT devices
-
2. Application
- 2.1. Dermatology
- 2.2. Ophthalmology
- 2.3. Cardiovascular
- 2.4. Others
Optical Coherence Tomography Devices Industry Segmentation By Geography
-
1. North America
- 1.1. United States
- 1.2. Canada
- 1.3. Mexico
-
2. Europe
- 2.1. Germany
- 2.2. United Kingdom
- 2.3. France
- 2.4. Italy
- 2.5. Spain
- 2.6. Rest of Europe
-
3. Asia Pacific
- 3.1. China
- 3.2. Japan
- 3.3. India
- 3.4. Australia
- 3.5. South Korea
- 3.6. Rest of Asia Pacific
-
4. Middle East and Africa
- 4.1. GCC
- 4.2. South Africa
- 4.3. Rest of Middle East and Africa
-
5. South America
- 5.1. Brazil
- 5.2. Argentina
- 5.3. Rest of South America
Optical Coherence Tomography Devices Industry Regional Market Share
Geographic Coverage of Optical Coherence Tomography Devices Industry
Optical Coherence Tomography Devices Industry REPORT HIGHLIGHTS
| Aspects | Details |
|---|---|
| Study Period | 2020-2034 |
| Base Year | 2025 |
| Estimated Year | 2026 |
| Forecast Period | 2026-2034 |
| Historical Period | 2020-2025 |
| Growth Rate | CAGR of 10.5% from 2020-2034 |
| Segmentation |
|
Table of Contents
- 1. Introduction
- 1.1. Research Scope
- 1.2. Market Segmentation
- 1.3. Research Objective
- 1.4. Definitions and Assumptions
- 2. Executive Summary
- 2.1. Market Snapshot
- 3. Market Dynamics
- 3.1. Market Drivers
- 3.2. Market Restrains
- 3.3. Market Trends
- 3.4. Market Opportunities
- 4. Market Factor Analysis
- 4.1. Porters Five Forces
- 4.1.1. Bargaining Power of Suppliers
- 4.1.2. Bargaining Power of Buyers
- 4.1.3. Threat of New Entrants
- 4.1.4. Threat of Substitutes
- 4.1.5. Competitive Rivalry
- 4.2. PESTEL analysis
- 4.3. BCG Analysis
- 4.3.1. Stars (High Growth, High Market Share)
- 4.3.2. Cash Cows (Low Growth, High Market Share)
- 4.3.3. Question Mark (High Growth, Low Market Share)
- 4.3.4. Dogs (Low Growth, Low Market Share)
- 4.4. Ansoff Matrix Analysis
- 4.5. Supply Chain Analysis
- 4.6. Regulatory Landscape
- 4.7. Current Market Potential and Opportunity Assessment (TAM–SAM–SOM Framework)
- 4.8. DMV Analyst Note
- 4.1. Porters Five Forces
- 5. Market Analysis, Insights and Forecast 2021-2033
- 5.1. Market Analysis, Insights and Forecast - by Type
- 5.1.1. Handheld OCT devices
- 5.1.2. Tabletop OCT devices
- 5.2. Market Analysis, Insights and Forecast - by Application
- 5.2.1. Dermatology
- 5.2.2. Ophthalmology
- 5.2.3. Cardiovascular
- 5.2.4. Others
- 5.3. Market Analysis, Insights and Forecast - by Region
- 5.3.1. North America
- 5.3.2. Europe
- 5.3.3. Asia Pacific
- 5.3.4. Middle East and Africa
- 5.3.5. South America
- 5.1. Market Analysis, Insights and Forecast - by Type
- 6. Global Optical Coherence Tomography Devices Industry Analysis, Insights and Forecast, 2021-2033
- 6.1. Market Analysis, Insights and Forecast - by Type
- 6.1.1. Handheld OCT devices
- 6.1.2. Tabletop OCT devices
- 6.2. Market Analysis, Insights and Forecast - by Application
- 6.2.1. Dermatology
- 6.2.2. Ophthalmology
- 6.2.3. Cardiovascular
- 6.2.4. Others
- 6.1. Market Analysis, Insights and Forecast - by Type
- 7. North America Optical Coherence Tomography Devices Industry Analysis, Insights and Forecast, 2020-2032
- 7.1. Market Analysis, Insights and Forecast - by Type
- 7.1.1. Handheld OCT devices
- 7.1.2. Tabletop OCT devices
- 7.2. Market Analysis, Insights and Forecast - by Application
- 7.2.1. Dermatology
- 7.2.2. Ophthalmology
- 7.2.3. Cardiovascular
- 7.2.4. Others
- 7.1. Market Analysis, Insights and Forecast - by Type
- 8. Europe Optical Coherence Tomography Devices Industry Analysis, Insights and Forecast, 2020-2032
- 8.1. Market Analysis, Insights and Forecast - by Type
- 8.1.1. Handheld OCT devices
- 8.1.2. Tabletop OCT devices
- 8.2. Market Analysis, Insights and Forecast - by Application
- 8.2.1. Dermatology
- 8.2.2. Ophthalmology
- 8.2.3. Cardiovascular
- 8.2.4. Others
- 8.1. Market Analysis, Insights and Forecast - by Type
- 9. Asia Pacific Optical Coherence Tomography Devices Industry Analysis, Insights and Forecast, 2020-2032
- 9.1. Market Analysis, Insights and Forecast - by Type
- 9.1.1. Handheld OCT devices
- 9.1.2. Tabletop OCT devices
- 9.2. Market Analysis, Insights and Forecast - by Application
- 9.2.1. Dermatology
- 9.2.2. Ophthalmology
- 9.2.3. Cardiovascular
- 9.2.4. Others
- 9.1. Market Analysis, Insights and Forecast - by Type
- 10. Middle East and Africa Optical Coherence Tomography Devices Industry Analysis, Insights and Forecast, 2020-2032
- 10.1. Market Analysis, Insights and Forecast - by Type
- 10.1.1. Handheld OCT devices
- 10.1.2. Tabletop OCT devices
- 10.2. Market Analysis, Insights and Forecast - by Application
- 10.2.1. Dermatology
- 10.2.2. Ophthalmology
- 10.2.3. Cardiovascular
- 10.2.4. Others
- 10.1. Market Analysis, Insights and Forecast - by Type
- 11. South America Optical Coherence Tomography Devices Industry Analysis, Insights and Forecast, 2020-2032
- 11.1. Market Analysis, Insights and Forecast - by Type
- 11.1.1. Handheld OCT devices
- 11.1.2. Tabletop OCT devices
- 11.2. Market Analysis, Insights and Forecast - by Application
- 11.2.1. Dermatology
- 11.2.2. Ophthalmology
- 11.2.3. Cardiovascular
- 11.2.4. Others
- 11.1. Market Analysis, Insights and Forecast - by Type
- 12. Competitive Analysis
- 12.1. Company Profiles
- 12.1.1 Heidelberg Engineering Inc
- 12.1.1.1. Company Overview
- 12.1.1.2. Products
- 12.1.1.3. Company Financials
- 12.1.1.4. SWOT Analysis
- 12.1.2 Optovue Inc
- 12.1.2.1. Company Overview
- 12.1.2.2. Products
- 12.1.2.3. Company Financials
- 12.1.2.4. SWOT Analysis
- 12.1.3 Agfa Healthcare
- 12.1.3.1. Company Overview
- 12.1.3.2. Products
- 12.1.3.3. Company Financials
- 12.1.3.4. SWOT Analysis
- 12.1.4 Thorlabs
- 12.1.4.1. Company Overview
- 12.1.4.2. Products
- 12.1.4.3. Company Financials
- 12.1.4.4. SWOT Analysis
- 12.1.5 Carl Zeiss AG
- 12.1.5.1. Company Overview
- 12.1.5.2. Products
- 12.1.5.3. Company Financials
- 12.1.5.4. SWOT Analysis
- 12.1.6 Terumo Medical Corporation
- 12.1.6.1. Company Overview
- 12.1.6.2. Products
- 12.1.6.3. Company Financials
- 12.1.6.4. SWOT Analysis
- 12.1.7 Topcon Corporation
- 12.1.7.1. Company Overview
- 12.1.7.2. Products
- 12.1.7.3. Company Financials
- 12.1.7.4. SWOT Analysis
- 12.1.8 OPTOPOL Technology
- 12.1.8.1. Company Overview
- 12.1.8.2. Products
- 12.1.8.3. Company Financials
- 12.1.8.4. SWOT Analysis
- 12.1.9 Leica Microsystems (Danaher)
- 12.1.9.1. Company Overview
- 12.1.9.2. Products
- 12.1.9.3. Company Financials
- 12.1.9.4. SWOT Analysis
- 12.1.10 Novacam Technologies
- 12.1.10.1. Company Overview
- 12.1.10.2. Products
- 12.1.10.3. Company Financials
- 12.1.10.4. SWOT Analysis
- 12.1.1 Heidelberg Engineering Inc
- 12.2. Market Entropy
- 12.2.1 Company's Key Areas Served
- 12.2.2 Recent Developments
- 12.3. Company Market Share Analysis 2025
- 12.3.1 Top 5 Companies Market Share Analysis
- 12.3.2 Top 3 Companies Market Share Analysis
- 12.4. List of Potential Customers
- 13. Research Methodology
List of Figures
- Figure 1: Global Optical Coherence Tomography Devices Industry Revenue Breakdown (billion, %) by Region 2025 & 2033
- Figure 2: Global Optical Coherence Tomography Devices Industry Volume Breakdown (K Unit, %) by Region 2025 & 2033
- Figure 3: North America Optical Coherence Tomography Devices Industry Revenue (billion), by Type 2025 & 2033
- Figure 4: North America Optical Coherence Tomography Devices Industry Volume (K Unit), by Type 2025 & 2033
- Figure 5: North America Optical Coherence Tomography Devices Industry Revenue Share (%), by Type 2025 & 2033
- Figure 6: North America Optical Coherence Tomography Devices Industry Volume Share (%), by Type 2025 & 2033
- Figure 7: North America Optical Coherence Tomography Devices Industry Revenue (billion), by Application 2025 & 2033
- Figure 8: North America Optical Coherence Tomography Devices Industry Volume (K Unit), by Application 2025 & 2033
- Figure 9: North America Optical Coherence Tomography Devices Industry Revenue Share (%), by Application 2025 & 2033
- Figure 10: North America Optical Coherence Tomography Devices Industry Volume Share (%), by Application 2025 & 2033
- Figure 11: North America Optical Coherence Tomography Devices Industry Revenue (billion), by Country 2025 & 2033
- Figure 12: North America Optical Coherence Tomography Devices Industry Volume (K Unit), by Country 2025 & 2033
- Figure 13: North America Optical Coherence Tomography Devices Industry Revenue Share (%), by Country 2025 & 2033
- Figure 14: North America Optical Coherence Tomography Devices Industry Volume Share (%), by Country 2025 & 2033
- Figure 15: Europe Optical Coherence Tomography Devices Industry Revenue (billion), by Type 2025 & 2033
- Figure 16: Europe Optical Coherence Tomography Devices Industry Volume (K Unit), by Type 2025 & 2033
- Figure 17: Europe Optical Coherence Tomography Devices Industry Revenue Share (%), by Type 2025 & 2033
- Figure 18: Europe Optical Coherence Tomography Devices Industry Volume Share (%), by Type 2025 & 2033
- Figure 19: Europe Optical Coherence Tomography Devices Industry Revenue (billion), by Application 2025 & 2033
- Figure 20: Europe Optical Coherence Tomography Devices Industry Volume (K Unit), by Application 2025 & 2033
- Figure 21: Europe Optical Coherence Tomography Devices Industry Revenue Share (%), by Application 2025 & 2033
- Figure 22: Europe Optical Coherence Tomography Devices Industry Volume Share (%), by Application 2025 & 2033
- Figure 23: Europe Optical Coherence Tomography Devices Industry Revenue (billion), by Country 2025 & 2033
- Figure 24: Europe Optical Coherence Tomography Devices Industry Volume (K Unit), by Country 2025 & 2033
- Figure 25: Europe Optical Coherence Tomography Devices Industry Revenue Share (%), by Country 2025 & 2033
- Figure 26: Europe Optical Coherence Tomography Devices Industry Volume Share (%), by Country 2025 & 2033
- Figure 27: Asia Pacific Optical Coherence Tomography Devices Industry Revenue (billion), by Type 2025 & 2033
- Figure 28: Asia Pacific Optical Coherence Tomography Devices Industry Volume (K Unit), by Type 2025 & 2033
- Figure 29: Asia Pacific Optical Coherence Tomography Devices Industry Revenue Share (%), by Type 2025 & 2033
- Figure 30: Asia Pacific Optical Coherence Tomography Devices Industry Volume Share (%), by Type 2025 & 2033
- Figure 31: Asia Pacific Optical Coherence Tomography Devices Industry Revenue (billion), by Application 2025 & 2033
- Figure 32: Asia Pacific Optical Coherence Tomography Devices Industry Volume (K Unit), by Application 2025 & 2033
- Figure 33: Asia Pacific Optical Coherence Tomography Devices Industry Revenue Share (%), by Application 2025 & 2033
- Figure 34: Asia Pacific Optical Coherence Tomography Devices Industry Volume Share (%), by Application 2025 & 2033
- Figure 35: Asia Pacific Optical Coherence Tomography Devices Industry Revenue (billion), by Country 2025 & 2033
- Figure 36: Asia Pacific Optical Coherence Tomography Devices Industry Volume (K Unit), by Country 2025 & 2033
- Figure 37: Asia Pacific Optical Coherence Tomography Devices Industry Revenue Share (%), by Country 2025 & 2033
- Figure 38: Asia Pacific Optical Coherence Tomography Devices Industry Volume Share (%), by Country 2025 & 2033
- Figure 39: Middle East and Africa Optical Coherence Tomography Devices Industry Revenue (billion), by Type 2025 & 2033
- Figure 40: Middle East and Africa Optical Coherence Tomography Devices Industry Volume (K Unit), by Type 2025 & 2033
- Figure 41: Middle East and Africa Optical Coherence Tomography Devices Industry Revenue Share (%), by Type 2025 & 2033
- Figure 42: Middle East and Africa Optical Coherence Tomography Devices Industry Volume Share (%), by Type 2025 & 2033
- Figure 43: Middle East and Africa Optical Coherence Tomography Devices Industry Revenue (billion), by Application 2025 & 2033
- Figure 44: Middle East and Africa Optical Coherence Tomography Devices Industry Volume (K Unit), by Application 2025 & 2033
- Figure 45: Middle East and Africa Optical Coherence Tomography Devices Industry Revenue Share (%), by Application 2025 & 2033
- Figure 46: Middle East and Africa Optical Coherence Tomography Devices Industry Volume Share (%), by Application 2025 & 2033
- Figure 47: Middle East and Africa Optical Coherence Tomography Devices Industry Revenue (billion), by Country 2025 & 2033
- Figure 48: Middle East and Africa Optical Coherence Tomography Devices Industry Volume (K Unit), by Country 2025 & 2033
- Figure 49: Middle East and Africa Optical Coherence Tomography Devices Industry Revenue Share (%), by Country 2025 & 2033
- Figure 50: Middle East and Africa Optical Coherence Tomography Devices Industry Volume Share (%), by Country 2025 & 2033
- Figure 51: South America Optical Coherence Tomography Devices Industry Revenue (billion), by Type 2025 & 2033
- Figure 52: South America Optical Coherence Tomography Devices Industry Volume (K Unit), by Type 2025 & 2033
- Figure 53: South America Optical Coherence Tomography Devices Industry Revenue Share (%), by Type 2025 & 2033
- Figure 54: South America Optical Coherence Tomography Devices Industry Volume Share (%), by Type 2025 & 2033
- Figure 55: South America Optical Coherence Tomography Devices Industry Revenue (billion), by Application 2025 & 2033
- Figure 56: South America Optical Coherence Tomography Devices Industry Volume (K Unit), by Application 2025 & 2033
- Figure 57: South America Optical Coherence Tomography Devices Industry Revenue Share (%), by Application 2025 & 2033
- Figure 58: South America Optical Coherence Tomography Devices Industry Volume Share (%), by Application 2025 & 2033
- Figure 59: South America Optical Coherence Tomography Devices Industry Revenue (billion), by Country 2025 & 2033
- Figure 60: South America Optical Coherence Tomography Devices Industry Volume (K Unit), by Country 2025 & 2033
- Figure 61: South America Optical Coherence Tomography Devices Industry Revenue Share (%), by Country 2025 & 2033
- Figure 62: South America Optical Coherence Tomography Devices Industry Volume Share (%), by Country 2025 & 2033
List of Tables
- Table 1: Global Optical Coherence Tomography Devices Industry Revenue billion Forecast, by Type 2020 & 2033
- Table 2: Global Optical Coherence Tomography Devices Industry Volume K Unit Forecast, by Type 2020 & 2033
- Table 3: Global Optical Coherence Tomography Devices Industry Revenue billion Forecast, by Application 2020 & 2033
- Table 4: Global Optical Coherence Tomography Devices Industry Volume K Unit Forecast, by Application 2020 & 2033
- Table 5: Global Optical Coherence Tomography Devices Industry Revenue billion Forecast, by Region 2020 & 2033
- Table 6: Global Optical Coherence Tomography Devices Industry Volume K Unit Forecast, by Region 2020 & 2033
- Table 7: Global Optical Coherence Tomography Devices Industry Revenue billion Forecast, by Type 2020 & 2033
- Table 8: Global Optical Coherence Tomography Devices Industry Volume K Unit Forecast, by Type 2020 & 2033
- Table 9: Global Optical Coherence Tomography Devices Industry Revenue billion Forecast, by Application 2020 & 2033
- Table 10: Global Optical Coherence Tomography Devices Industry Volume K Unit Forecast, by Application 2020 & 2033
- Table 11: Global Optical Coherence Tomography Devices Industry Revenue billion Forecast, by Country 2020 & 2033
- Table 12: Global Optical Coherence Tomography Devices Industry Volume K Unit Forecast, by Country 2020 & 2033
- Table 13: United States Optical Coherence Tomography Devices Industry Revenue (billion) Forecast, by Application 2020 & 2033
- Table 14: United States Optical Coherence Tomography Devices Industry Volume (K Unit) Forecast, by Application 2020 & 2033
- Table 15: Canada Optical Coherence Tomography Devices Industry Revenue (billion) Forecast, by Application 2020 & 2033
- Table 16: Canada Optical Coherence Tomography Devices Industry Volume (K Unit) Forecast, by Application 2020 & 2033
- Table 17: Mexico Optical Coherence Tomography Devices Industry Revenue (billion) Forecast, by Application 2020 & 2033
- Table 18: Mexico Optical Coherence Tomography Devices Industry Volume (K Unit) Forecast, by Application 2020 & 2033
- Table 19: Global Optical Coherence Tomography Devices Industry Revenue billion Forecast, by Type 2020 & 2033
- Table 20: Global Optical Coherence Tomography Devices Industry Volume K Unit Forecast, by Type 2020 & 2033
- Table 21: Global Optical Coherence Tomography Devices Industry Revenue billion Forecast, by Application 2020 & 2033
- Table 22: Global Optical Coherence Tomography Devices Industry Volume K Unit Forecast, by Application 2020 & 2033
- Table 23: Global Optical Coherence Tomography Devices Industry Revenue billion Forecast, by Country 2020 & 2033
- Table 24: Global Optical Coherence Tomography Devices Industry Volume K Unit Forecast, by Country 2020 & 2033
- Table 25: Germany Optical Coherence Tomography Devices Industry Revenue (billion) Forecast, by Application 2020 & 2033
- Table 26: Germany Optical Coherence Tomography Devices Industry Volume (K Unit) Forecast, by Application 2020 & 2033
- Table 27: United Kingdom Optical Coherence Tomography Devices Industry Revenue (billion) Forecast, by Application 2020 & 2033
- Table 28: United Kingdom Optical Coherence Tomography Devices Industry Volume (K Unit) Forecast, by Application 2020 & 2033
- Table 29: France Optical Coherence Tomography Devices Industry Revenue (billion) Forecast, by Application 2020 & 2033
- Table 30: France Optical Coherence Tomography Devices Industry Volume (K Unit) Forecast, by Application 2020 & 2033
- Table 31: Italy Optical Coherence Tomography Devices Industry Revenue (billion) Forecast, by Application 2020 & 2033
- Table 32: Italy Optical Coherence Tomography Devices Industry Volume (K Unit) Forecast, by Application 2020 & 2033
- Table 33: Spain Optical Coherence Tomography Devices Industry Revenue (billion) Forecast, by Application 2020 & 2033
- Table 34: Spain Optical Coherence Tomography Devices Industry Volume (K Unit) Forecast, by Application 2020 & 2033
- Table 35: Rest of Europe Optical Coherence Tomography Devices Industry Revenue (billion) Forecast, by Application 2020 & 2033
- Table 36: Rest of Europe Optical Coherence Tomography Devices Industry Volume (K Unit) Forecast, by Application 2020 & 2033
- Table 37: Global Optical Coherence Tomography Devices Industry Revenue billion Forecast, by Type 2020 & 2033
- Table 38: Global Optical Coherence Tomography Devices Industry Volume K Unit Forecast, by Type 2020 & 2033
- Table 39: Global Optical Coherence Tomography Devices Industry Revenue billion Forecast, by Application 2020 & 2033
- Table 40: Global Optical Coherence Tomography Devices Industry Volume K Unit Forecast, by Application 2020 & 2033
- Table 41: Global Optical Coherence Tomography Devices Industry Revenue billion Forecast, by Country 2020 & 2033
- Table 42: Global Optical Coherence Tomography Devices Industry Volume K Unit Forecast, by Country 2020 & 2033
- Table 43: China Optical Coherence Tomography Devices Industry Revenue (billion) Forecast, by Application 2020 & 2033
- Table 44: China Optical Coherence Tomography Devices Industry Volume (K Unit) Forecast, by Application 2020 & 2033
- Table 45: Japan Optical Coherence Tomography Devices Industry Revenue (billion) Forecast, by Application 2020 & 2033
- Table 46: Japan Optical Coherence Tomography Devices Industry Volume (K Unit) Forecast, by Application 2020 & 2033
- Table 47: India Optical Coherence Tomography Devices Industry Revenue (billion) Forecast, by Application 2020 & 2033
- Table 48: India Optical Coherence Tomography Devices Industry Volume (K Unit) Forecast, by Application 2020 & 2033
- Table 49: Australia Optical Coherence Tomography Devices Industry Revenue (billion) Forecast, by Application 2020 & 2033
- Table 50: Australia Optical Coherence Tomography Devices Industry Volume (K Unit) Forecast, by Application 2020 & 2033
- Table 51: South Korea Optical Coherence Tomography Devices Industry Revenue (billion) Forecast, by Application 2020 & 2033
- Table 52: South Korea Optical Coherence Tomography Devices Industry Volume (K Unit) Forecast, by Application 2020 & 2033
- Table 53: Rest of Asia Pacific Optical Coherence Tomography Devices Industry Revenue (billion) Forecast, by Application 2020 & 2033
- Table 54: Rest of Asia Pacific Optical Coherence Tomography Devices Industry Volume (K Unit) Forecast, by Application 2020 & 2033
- Table 55: Global Optical Coherence Tomography Devices Industry Revenue billion Forecast, by Type 2020 & 2033
- Table 56: Global Optical Coherence Tomography Devices Industry Volume K Unit Forecast, by Type 2020 & 2033
- Table 57: Global Optical Coherence Tomography Devices Industry Revenue billion Forecast, by Application 2020 & 2033
- Table 58: Global Optical Coherence Tomography Devices Industry Volume K Unit Forecast, by Application 2020 & 2033
- Table 59: Global Optical Coherence Tomography Devices Industry Revenue billion Forecast, by Country 2020 & 2033
- Table 60: Global Optical Coherence Tomography Devices Industry Volume K Unit Forecast, by Country 2020 & 2033
- Table 61: GCC Optical Coherence Tomography Devices Industry Revenue (billion) Forecast, by Application 2020 & 2033
- Table 62: GCC Optical Coherence Tomography Devices Industry Volume (K Unit) Forecast, by Application 2020 & 2033
- Table 63: South Africa Optical Coherence Tomography Devices Industry Revenue (billion) Forecast, by Application 2020 & 2033
- Table 64: South Africa Optical Coherence Tomography Devices Industry Volume (K Unit) Forecast, by Application 2020 & 2033
- Table 65: Rest of Middle East and Africa Optical Coherence Tomography Devices Industry Revenue (billion) Forecast, by Application 2020 & 2033
- Table 66: Rest of Middle East and Africa Optical Coherence Tomography Devices Industry Volume (K Unit) Forecast, by Application 2020 & 2033
- Table 67: Global Optical Coherence Tomography Devices Industry Revenue billion Forecast, by Type 2020 & 2033
- Table 68: Global Optical Coherence Tomography Devices Industry Volume K Unit Forecast, by Type 2020 & 2033
- Table 69: Global Optical Coherence Tomography Devices Industry Revenue billion Forecast, by Application 2020 & 2033
- Table 70: Global Optical Coherence Tomography Devices Industry Volume K Unit Forecast, by Application 2020 & 2033
- Table 71: Global Optical Coherence Tomography Devices Industry Revenue billion Forecast, by Country 2020 & 2033
- Table 72: Global Optical Coherence Tomography Devices Industry Volume K Unit Forecast, by Country 2020 & 2033
- Table 73: Brazil Optical Coherence Tomography Devices Industry Revenue (billion) Forecast, by Application 2020 & 2033
- Table 74: Brazil Optical Coherence Tomography Devices Industry Volume (K Unit) Forecast, by Application 2020 & 2033
- Table 75: Argentina Optical Coherence Tomography Devices Industry Revenue (billion) Forecast, by Application 2020 & 2033
- Table 76: Argentina Optical Coherence Tomography Devices Industry Volume (K Unit) Forecast, by Application 2020 & 2033
- Table 77: Rest of South America Optical Coherence Tomography Devices Industry Revenue (billion) Forecast, by Application 2020 & 2033
- Table 78: Rest of South America Optical Coherence Tomography Devices Industry Volume (K Unit) Forecast, by Application 2020 & 2033
Frequently Asked Questions
1. What is the projected Compound Annual Growth Rate (CAGR) of the Optical Coherence Tomography Devices Industry?
The projected CAGR is approximately 10.5%.
2. Which companies are prominent players in the Optical Coherence Tomography Devices Industry?
Key companies in the market include Heidelberg Engineering Inc, Optovue Inc, Agfa Healthcare, Thorlabs, Carl Zeiss AG, Terumo Medical Corporation, Topcon Corporation, OPTOPOL Technology, Leica Microsystems (Danaher), Novacam Technologies.
3. What are the main segments of the Optical Coherence Tomography Devices Industry?
The market segments include Type, Application.
4. Can you provide details about the market size?
The market size is estimated to be USD 2.32 billion as of 2022.
5. What are some drivers contributing to market growth?
Increasing Demand in Biomedical Application; Recent Technological Developments in Diagnostics.
6. What are the notable trends driving market growth?
Opthalmology by Application in Optical Coherence Tomography Market is Expected to Witness a Healthy Growth in Future..
7. Are there any restraints impacting market growth?
Reimbursement Policies.
8. Can you provide examples of recent developments in the market?
In April 2022, Alcon reinforced its training and education with the Alcon Fidelis Virtual Reality (VR) Ophthalmic Surgical Simulator, a portable VR tool for cataract surgeons in training.
9. What pricing options are available for accessing the report?
Pricing options include single-user, multi-user, and enterprise licenses priced at USD 4750, USD 5250, and USD 8750 respectively.
10. Is the market size provided in terms of value or volume?
The market size is provided in terms of value, measured in billion and volume, measured in K Unit.
11. Are there any specific market keywords associated with the report?
Yes, the market keyword associated with the report is "Optical Coherence Tomography Devices Industry," which aids in identifying and referencing the specific market segment covered.
12. How do I determine which pricing option suits my needs best?
The pricing options vary based on user requirements and access needs. Individual users may opt for single-user licenses, while businesses requiring broader access may choose multi-user or enterprise licenses for cost-effective access to the report.
13. Are there any additional resources or data provided in the Optical Coherence Tomography Devices Industry report?
While the report offers comprehensive insights, it's advisable to review the specific contents or supplementary materials provided to ascertain if additional resources or data are available.
14. How can I stay updated on further developments or reports in the Optical Coherence Tomography Devices Industry?
To stay informed about further developments, trends, and reports in the Optical Coherence Tomography Devices Industry, consider subscribing to industry newsletters, following relevant companies and organizations, or regularly checking reputable industry news sources and publications.
Methodology
Step 1 - Identification of Relevant Samples Size from Population Database


Step 2 - Approaches for Defining Global Market Size (Value, Volume* & Price*)

Note*: In applicable scenarios
Step 3 - Data Sources
Primary Research
- Web Analytics
- Survey Reports
- Research Institute
- Latest Research Reports
- Opinion Leaders
Secondary Research
- Annual Reports
- White Paper
- Latest Press Release
- Industry Association
- Paid Database
- Investor Presentations

Step 4 - Data Triangulation
Involves using different sources of information in order to increase the validity of a study
These sources are likely to be stakeholders in a program - participants, other researchers, program staff, other community members, and so on.
Then we put all data in single framework & apply various statistical tools to find out the dynamic on the market.
During the analysis stage, feedback from the stakeholder groups would be compared to determine areas of agreement as well as areas of divergence