

Key Insights
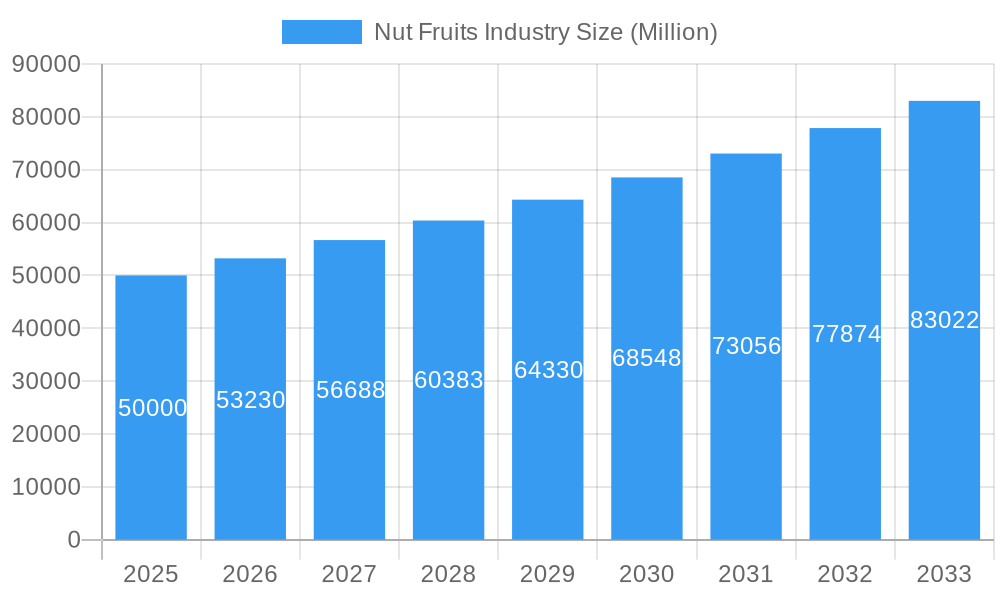
The global nut and dried fruit market, estimated at $923.94 billion in the base year 2025, is projected for significant expansion. It is expected to achieve a Compound Annual Growth Rate (CAGR) of 6.24% from 2025 to 2033. This robust growth is propelled by several key drivers. Increased consumer health consciousness, recognizing the nutritional value of nuts (protein, healthy fats, vitamins, minerals), is fueling demand. The surge in plant-based diets and the integration of nuts into a wide array of food products, from snack bars to dairy alternatives, further accelerate market expansion. Additionally, a growing global middle class, particularly in emerging economies, is increasing consumption of nutritious and convenient snack options, including nuts and dried fruits. The market is segmented by product type (e.g., almonds, cashews, walnuts), category (conventional, organic), coating (coated, uncoated), form (whole, diced, roasted), and end-user (household/retail, food service). The online distribution channel is experiencing substantial growth, mirroring the broader e-commerce trend in the food sector. However, challenges such as raw material price volatility and seasonal supply variations may impact market stability. Furthermore, the rising incidence of nut allergies presents a significant constraint requiring careful management by manufacturers and retailers.
Nut Fruits Industry Market Size (In Billion)
Organic nut and dried fruit sales are witnessing accelerated growth, driven by heightened consumer preference for natural and sustainable food choices. The increasing demand for convenient, ready-to-consume products, such as roasted and pre-packaged nuts and dried fruits, supports this expansion. Regional consumption patterns vary, with North America and Europe currently leading the market due to high per capita consumption and well-established distribution networks. Nevertheless, significant growth potential resides in the Asia-Pacific region and other emerging markets, where rising disposable incomes and evolving dietary habits are creating new opportunities for nut and dried fruit producers and distributors. The competitive environment features a blend of major multinational corporations and smaller regional enterprises, all striving for market share through product innovation, strategic alliances, and effective branding. Future growth trajectories will be shaped by factors including successful product diversification, targeted marketing initiatives, and the implementation of sustainable and ethical sourcing practices.
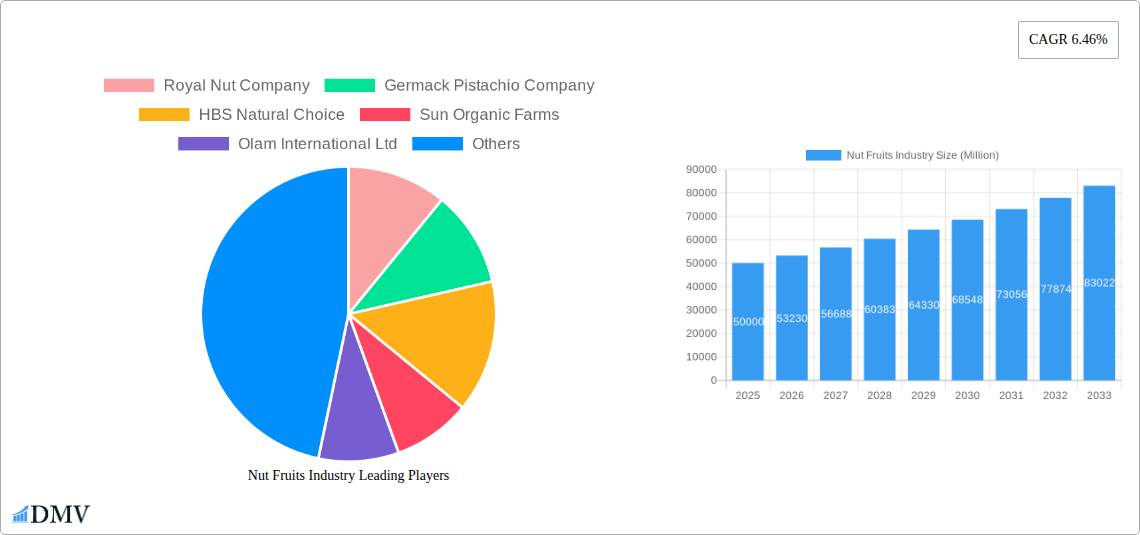
Nut Fruits Industry Company Market Share
Nut Fruits Industry: A Comprehensive Market Report (2019-2033)
This insightful report provides a detailed analysis of the global nut fruits industry, offering a comprehensive overview of market trends, key players, and future growth prospects. The study period spans from 2019 to 2033, with a base year of 2025 and a forecast period from 2025 to 2033. Valuations are expressed in Millions USD. This report is crucial for stakeholders seeking to understand the dynamics of this lucrative market and make informed strategic decisions.
Nut Fruits Industry Market Composition & Trends
The global nut fruits market, valued at $XX Million in 2024, is characterized by moderate concentration, with key players such as Olam International Ltd, Blue Diamond Growers, and Borges Agricultural & Industrial Nuts holding significant market share. The market is witnessing increasing innovation driven by consumer demand for healthier snacks and functional foods. Regulatory landscapes concerning food safety and labeling are evolving, influencing production and distribution. Substitute products, such as seeds and other snacks, pose competitive pressure. End-user preferences are shifting towards organic and coated options, impacting product demand. Mergers and acquisitions (M&A) activity is moderate, with deal values averaging $XX Million in recent years.
- Market Share Distribution (2024): Olam International: xx%, Blue Diamond Growers: xx%, Borges Agricultural & Industrial Nuts: xx%, Others: xx%
- M&A Activity (2019-2024): Average deal value: $XX Million; Number of deals: xx
Nut Fruits Industry Industry Evolution
The nut fruits industry has experienced steady growth over the past five years (2019-2024), with a Compound Annual Growth Rate (CAGR) of xx%. This growth is attributed to several factors, including rising health consciousness, increasing disposable incomes in developing economies, and the versatility of nut fruits in various food applications. Technological advancements in processing and packaging have improved product quality and shelf life, further bolstering market expansion. Consumer demand is shifting towards convenient, value-added products like roasted, coated, and pre-portioned nuts. The adoption rate of organic and sustainable farming practices is gradually increasing, driven by consumer preference and regulatory pressures. The projected CAGR for the forecast period (2025-2033) is xx%, indicating continued market expansion.
Leading Regions, Countries, or Segments in Nut Fruits Industry
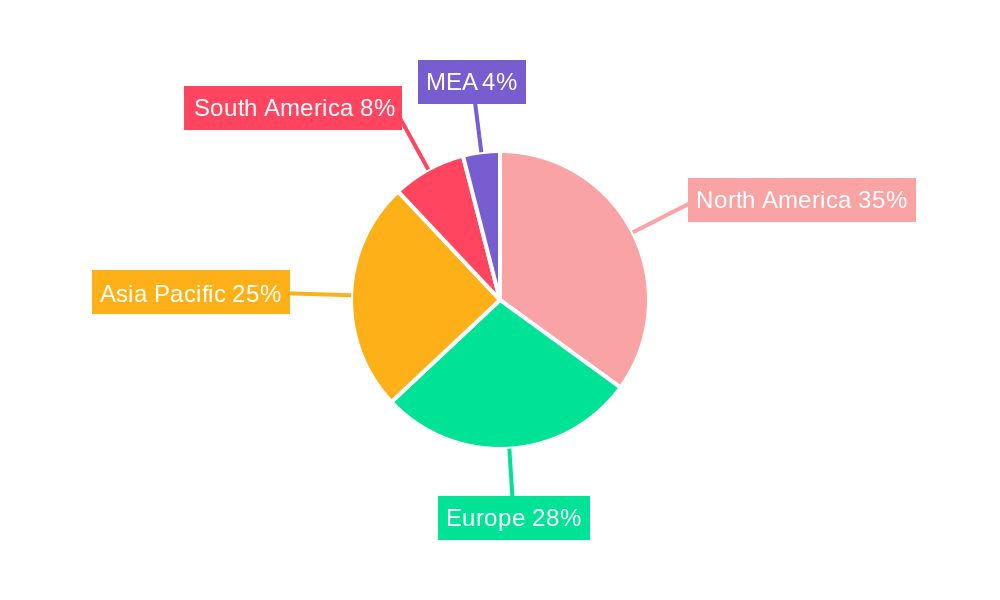
The North American region dominates the global nut fruits market, driven by high consumption rates and established production capabilities. Within this region, the United States holds the largest market share.
Key Drivers:
- High per capita consumption: North America displays consistently higher per capita consumption of nuts compared to other regions.
- Strong domestic production: The US boasts significant almond, pecan, and walnut production, contributing to market dominance.
- Robust retail infrastructure: Well-established retail channels effectively distribute nut products to consumers.
Product Type: Almonds and walnuts consistently account for the largest market share, followed by cashews and pistachios. Within the category segment, conventional nuts hold a larger market share than organic, although organic nut sales are experiencing faster growth. Whole nuts are the most popular form, followed by roasted and diced/cut options. The household/retail segment dominates end-user consumption. Offline channels remain the primary distribution method, however, online sales are steadily increasing.
Nut Fruits Industry Product Innovations
Recent innovations include the development of enhanced flavor profiles, the introduction of convenient packaging formats (e.g., single-serve packs), and the expansion of nut-based ingredient offerings for food manufacturers. Technological advancements in processing techniques are improving nut quality, yield, and efficiency. Unique selling propositions focus on health benefits, sustainability, and convenience.
Propelling Factors for Nut Fruits Industry Growth
Technological advancements in farming and processing, increased consumer awareness of health benefits, and supportive government policies are driving market growth. Economic factors such as rising disposable incomes in emerging markets are further boosting demand.
Obstacles in the Nut Fruits Industry Market
Fluctuations in raw material prices, climate change impacting crop yields, and stringent regulatory compliance requirements pose significant challenges. Supply chain disruptions, particularly during periods of adverse weather conditions, can lead to price volatility and shortages. Intense competition among established players and the emergence of new entrants also create pressure on profit margins.
Future Opportunities in Nut Fruits Industry
Expanding into emerging markets with high growth potential, developing innovative product formats catering to specific dietary needs (e.g., vegan, gluten-free), and leveraging technology to enhance traceability and sustainability are key opportunities.
Major Players in the Nut Fruits Industry Ecosystem
- Royal Nut Company
- Germack Pistachio Company
- HBS Natural Choice
- Sun Organic Farms
- Olam International Ltd
- Blue Diamond Growers
- South Valley Farms
- Tierra Farms
- Borges Agricultural & Industrial Nuts
- Ludlow Nut Co Ltd
Key Developments in Nut Fruits Industry Industry
- 2022 Q4: Olam International launched a new range of sustainably sourced nuts.
- 2023 Q1: Blue Diamond Growers announced a significant investment in its processing facilities.
- 2023 Q2: A major merger between two smaller nut producers was finalized.
Strategic Nut Fruits Industry Market Forecast
The global nut fruits market is poised for continued growth, driven by several factors including rising health consciousness, increasing demand for convenient snacks, and the development of innovative products. The market is expected to witness significant expansion in emerging markets and within the organic segment. The long-term outlook for the industry remains positive, with strong growth potential over the next decade.
Nut Fruits Industry Segmentation
-
1. Product Type
- 1.1. Almonds
- 1.2. Brazil Nuts
- 1.3. Cashews
- 1.4. Chestnuts
- 1.5. Macadamia Nuts
- 1.6. Walnuts
- 1.7. Peanuts
- 1.8. Pecans
- 1.9. Pine Nuts
- 1.10. Hazelnuts
- 1.11. Hickory Nuts
- 1.12. Pistachios
- 1.13. Others
-
2. Category
- 2.1. Conventional
- 2.2. Organic
-
3. Coating Type
- 3.1. Coated
- 3.2. Uncoated
-
4. Form
- 4.1. Whole
- 4.2. Diced/Cut
- 4.3. Roasted
- 4.4. Granular
-
5. End-User
- 5.1. Household/Retail
- 5.2. Food Service Sectors
-
6. Distribution Channel
- 6.1. Offline Channel
- 6.2. Online Channel
Nut Fruits Industry Segmentation By Geography
-
1. North America
- 1.1. United States
- 1.2. Canada
- 1.3. Mexico
- 1.4. Rest of North America
-
2. Europe
- 2.1. United Kingdom
- 2.2. Germany
- 2.3. Spain
- 2.4. France
- 2.5. Italy
- 2.6. Russia
- 2.7. Rest of Europe
-
3. Asia Pacific
- 3.1. China
- 3.2. Japan
- 3.3. India
- 3.4. Australia
- 3.5. Rest of Asia Pacific
-
4. South America
- 4.1. Brazil
- 4.2. Argentina
- 4.3. Rest of South America
- 5. Middle East
-
6. Saudi Arabia
- 6.1. South Africa
- 6.2. Rest of Middle East
Nut Fruits Industry Regional Market Share
Geographic Coverage of Nut Fruits Industry
Nut Fruits Industry REPORT HIGHLIGHTS
| Aspects | Details |
|---|---|
| Study Period | 2020-2034 |
| Base Year | 2025 |
| Estimated Year | 2026 |
| Forecast Period | 2026-2034 |
| Historical Period | 2020-2025 |
| Growth Rate | CAGR of 6.24% from 2020-2034 |
| Segmentation |
|
Table of Contents
- 1. Introduction
- 1.1. Research Scope
- 1.2. Market Segmentation
- 1.3. Research Methodology
- 1.4. Definitions and Assumptions
- 2. Executive Summary
- 2.1. Introduction
- 3. Market Dynamics
- 3.1. Introduction
- 3.2. Market Drivers
- 3.2.1. Increasing consumer awareness about health benefits of nuts and fruits
- 3.3. Market Restrains
- 3.3.1. Cost of nuts and fruits can be relatively high compared to other snacks
- 3.4. Market Trends
- 3.4.1. Increasing demand for organic and non-GMO nuts and fruits
- 4. Market Factor Analysis
- 4.1. Porters Five Forces
- 4.2. Supply/Value Chain
- 4.3. PESTEL analysis
- 4.4. Market Entropy
- 4.5. Patent/Trademark Analysis
- 5. Global Nut Fruits Industry Analysis, Insights and Forecast, 2020-2032
- 5.1. Market Analysis, Insights and Forecast - by Product Type
- 5.1.1. Almonds
- 5.1.2. Brazil Nuts
- 5.1.3. Cashews
- 5.1.4. Chestnuts
- 5.1.5. Macadamia Nuts
- 5.1.6. Walnuts
- 5.1.7. Peanuts
- 5.1.8. Pecans
- 5.1.9. Pine Nuts
- 5.1.10. Hazelnuts
- 5.1.11. Hickory Nuts
- 5.1.12. Pistachios
- 5.1.13. Others
- 5.2. Market Analysis, Insights and Forecast - by Category
- 5.2.1. Conventional
- 5.2.2. Organic
- 5.3. Market Analysis, Insights and Forecast - by Coating Type
- 5.3.1. Coated
- 5.3.2. Uncoated
- 5.4. Market Analysis, Insights and Forecast - by Form
- 5.4.1. Whole
- 5.4.2. Diced/Cut
- 5.4.3. Roasted
- 5.4.4. Granular
- 5.5. Market Analysis, Insights and Forecast - by End-User
- 5.5.1. Household/Retail
- 5.5.2. Food Service Sectors
- 5.6. Market Analysis, Insights and Forecast - by Distribution Channel
- 5.6.1. Offline Channel
- 5.6.2. Online Channel
- 5.7. Market Analysis, Insights and Forecast - by Region
- 5.7.1. North America
- 5.7.2. Europe
- 5.7.3. Asia Pacific
- 5.7.4. South America
- 5.7.5. Middle East
- 5.7.6. Saudi Arabia
- 5.1. Market Analysis, Insights and Forecast - by Product Type
- 6. North America Nut Fruits Industry Analysis, Insights and Forecast, 2020-2032
- 6.1. Market Analysis, Insights and Forecast - by Product Type
- 6.1.1. Almonds
- 6.1.2. Brazil Nuts
- 6.1.3. Cashews
- 6.1.4. Chestnuts
- 6.1.5. Macadamia Nuts
- 6.1.6. Walnuts
- 6.1.7. Peanuts
- 6.1.8. Pecans
- 6.1.9. Pine Nuts
- 6.1.10. Hazelnuts
- 6.1.11. Hickory Nuts
- 6.1.12. Pistachios
- 6.1.13. Others
- 6.2. Market Analysis, Insights and Forecast - by Category
- 6.2.1. Conventional
- 6.2.2. Organic
- 6.3. Market Analysis, Insights and Forecast - by Coating Type
- 6.3.1. Coated
- 6.3.2. Uncoated
- 6.4. Market Analysis, Insights and Forecast - by Form
- 6.4.1. Whole
- 6.4.2. Diced/Cut
- 6.4.3. Roasted
- 6.4.4. Granular
- 6.5. Market Analysis, Insights and Forecast - by End-User
- 6.5.1. Household/Retail
- 6.5.2. Food Service Sectors
- 6.6. Market Analysis, Insights and Forecast - by Distribution Channel
- 6.6.1. Offline Channel
- 6.6.2. Online Channel
- 6.1. Market Analysis, Insights and Forecast - by Product Type
- 7. Europe Nut Fruits Industry Analysis, Insights and Forecast, 2020-2032
- 7.1. Market Analysis, Insights and Forecast - by Product Type
- 7.1.1. Almonds
- 7.1.2. Brazil Nuts
- 7.1.3. Cashews
- 7.1.4. Chestnuts
- 7.1.5. Macadamia Nuts
- 7.1.6. Walnuts
- 7.1.7. Peanuts
- 7.1.8. Pecans
- 7.1.9. Pine Nuts
- 7.1.10. Hazelnuts
- 7.1.11. Hickory Nuts
- 7.1.12. Pistachios
- 7.1.13. Others
- 7.2. Market Analysis, Insights and Forecast - by Category
- 7.2.1. Conventional
- 7.2.2. Organic
- 7.3. Market Analysis, Insights and Forecast - by Coating Type
- 7.3.1. Coated
- 7.3.2. Uncoated
- 7.4. Market Analysis, Insights and Forecast - by Form
- 7.4.1. Whole
- 7.4.2. Diced/Cut
- 7.4.3. Roasted
- 7.4.4. Granular
- 7.5. Market Analysis, Insights and Forecast - by End-User
- 7.5.1. Household/Retail
- 7.5.2. Food Service Sectors
- 7.6. Market Analysis, Insights and Forecast - by Distribution Channel
- 7.6.1. Offline Channel
- 7.6.2. Online Channel
- 7.1. Market Analysis, Insights and Forecast - by Product Type
- 8. Asia Pacific Nut Fruits Industry Analysis, Insights and Forecast, 2020-2032
- 8.1. Market Analysis, Insights and Forecast - by Product Type
- 8.1.1. Almonds
- 8.1.2. Brazil Nuts
- 8.1.3. Cashews
- 8.1.4. Chestnuts
- 8.1.5. Macadamia Nuts
- 8.1.6. Walnuts
- 8.1.7. Peanuts
- 8.1.8. Pecans
- 8.1.9. Pine Nuts
- 8.1.10. Hazelnuts
- 8.1.11. Hickory Nuts
- 8.1.12. Pistachios
- 8.1.13. Others
- 8.2. Market Analysis, Insights and Forecast - by Category
- 8.2.1. Conventional
- 8.2.2. Organic
- 8.3. Market Analysis, Insights and Forecast - by Coating Type
- 8.3.1. Coated
- 8.3.2. Uncoated
- 8.4. Market Analysis, Insights and Forecast - by Form
- 8.4.1. Whole
- 8.4.2. Diced/Cut
- 8.4.3. Roasted
- 8.4.4. Granular
- 8.5. Market Analysis, Insights and Forecast - by End-User
- 8.5.1. Household/Retail
- 8.5.2. Food Service Sectors
- 8.6. Market Analysis, Insights and Forecast - by Distribution Channel
- 8.6.1. Offline Channel
- 8.6.2. Online Channel
- 8.1. Market Analysis, Insights and Forecast - by Product Type
- 9. South America Nut Fruits Industry Analysis, Insights and Forecast, 2020-2032
- 9.1. Market Analysis, Insights and Forecast - by Product Type
- 9.1.1. Almonds
- 9.1.2. Brazil Nuts
- 9.1.3. Cashews
- 9.1.4. Chestnuts
- 9.1.5. Macadamia Nuts
- 9.1.6. Walnuts
- 9.1.7. Peanuts
- 9.1.8. Pecans
- 9.1.9. Pine Nuts
- 9.1.10. Hazelnuts
- 9.1.11. Hickory Nuts
- 9.1.12. Pistachios
- 9.1.13. Others
- 9.2. Market Analysis, Insights and Forecast - by Category
- 9.2.1. Conventional
- 9.2.2. Organic
- 9.3. Market Analysis, Insights and Forecast - by Coating Type
- 9.3.1. Coated
- 9.3.2. Uncoated
- 9.4. Market Analysis, Insights and Forecast - by Form
- 9.4.1. Whole
- 9.4.2. Diced/Cut
- 9.4.3. Roasted
- 9.4.4. Granular
- 9.5. Market Analysis, Insights and Forecast - by End-User
- 9.5.1. Household/Retail
- 9.5.2. Food Service Sectors
- 9.6. Market Analysis, Insights and Forecast - by Distribution Channel
- 9.6.1. Offline Channel
- 9.6.2. Online Channel
- 9.1. Market Analysis, Insights and Forecast - by Product Type
- 10. Middle East Nut Fruits Industry Analysis, Insights and Forecast, 2020-2032
- 10.1. Market Analysis, Insights and Forecast - by Product Type
- 10.1.1. Almonds
- 10.1.2. Brazil Nuts
- 10.1.3. Cashews
- 10.1.4. Chestnuts
- 10.1.5. Macadamia Nuts
- 10.1.6. Walnuts
- 10.1.7. Peanuts
- 10.1.8. Pecans
- 10.1.9. Pine Nuts
- 10.1.10. Hazelnuts
- 10.1.11. Hickory Nuts
- 10.1.12. Pistachios
- 10.1.13. Others
- 10.2. Market Analysis, Insights and Forecast - by Category
- 10.2.1. Conventional
- 10.2.2. Organic
- 10.3. Market Analysis, Insights and Forecast - by Coating Type
- 10.3.1. Coated
- 10.3.2. Uncoated
- 10.4. Market Analysis, Insights and Forecast - by Form
- 10.4.1. Whole
- 10.4.2. Diced/Cut
- 10.4.3. Roasted
- 10.4.4. Granular
- 10.5. Market Analysis, Insights and Forecast - by End-User
- 10.5.1. Household/Retail
- 10.5.2. Food Service Sectors
- 10.6. Market Analysis, Insights and Forecast - by Distribution Channel
- 10.6.1. Offline Channel
- 10.6.2. Online Channel
- 10.1. Market Analysis, Insights and Forecast - by Product Type
- 11. Saudi Arabia Nut Fruits Industry Analysis, Insights and Forecast, 2020-2032
- 11.1. Market Analysis, Insights and Forecast - by Product Type
- 11.1.1. Almonds
- 11.1.2. Brazil Nuts
- 11.1.3. Cashews
- 11.1.4. Chestnuts
- 11.1.5. Macadamia Nuts
- 11.1.6. Walnuts
- 11.1.7. Peanuts
- 11.1.8. Pecans
- 11.1.9. Pine Nuts
- 11.1.10. Hazelnuts
- 11.1.11. Hickory Nuts
- 11.1.12. Pistachios
- 11.1.13. Others
- 11.2. Market Analysis, Insights and Forecast - by Category
- 11.2.1. Conventional
- 11.2.2. Organic
- 11.3. Market Analysis, Insights and Forecast - by Coating Type
- 11.3.1. Coated
- 11.3.2. Uncoated
- 11.4. Market Analysis, Insights and Forecast - by Form
- 11.4.1. Whole
- 11.4.2. Diced/Cut
- 11.4.3. Roasted
- 11.4.4. Granular
- 11.5. Market Analysis, Insights and Forecast - by End-User
- 11.5.1. Household/Retail
- 11.5.2. Food Service Sectors
- 11.6. Market Analysis, Insights and Forecast - by Distribution Channel
- 11.6.1. Offline Channel
- 11.6.2. Online Channel
- 11.1. Market Analysis, Insights and Forecast - by Product Type
- 12. Competitive Analysis
- 12.1. Global Market Share Analysis 2025
- 12.2. Company Profiles
- 12.2.1 Royal Nut Company
- 12.2.1.1. Overview
- 12.2.1.2. Products
- 12.2.1.3. SWOT Analysis
- 12.2.1.4. Recent Developments
- 12.2.1.5. Financials (Based on Availability)
- 12.2.2 Germack Pistachio Company
- 12.2.2.1. Overview
- 12.2.2.2. Products
- 12.2.2.3. SWOT Analysis
- 12.2.2.4. Recent Developments
- 12.2.2.5. Financials (Based on Availability)
- 12.2.3 HBS Natural Choice
- 12.2.3.1. Overview
- 12.2.3.2. Products
- 12.2.3.3. SWOT Analysis
- 12.2.3.4. Recent Developments
- 12.2.3.5. Financials (Based on Availability)
- 12.2.4 Sun Organic Farms
- 12.2.4.1. Overview
- 12.2.4.2. Products
- 12.2.4.3. SWOT Analysis
- 12.2.4.4. Recent Developments
- 12.2.4.5. Financials (Based on Availability)
- 12.2.5 Olam International Ltd
- 12.2.5.1. Overview
- 12.2.5.2. Products
- 12.2.5.3. SWOT Analysis
- 12.2.5.4. Recent Developments
- 12.2.5.5. Financials (Based on Availability)
- 12.2.6 Blue Diamond Growers
- 12.2.6.1. Overview
- 12.2.6.2. Products
- 12.2.6.3. SWOT Analysis
- 12.2.6.4. Recent Developments
- 12.2.6.5. Financials (Based on Availability)
- 12.2.7 South Valley Farms
- 12.2.7.1. Overview
- 12.2.7.2. Products
- 12.2.7.3. SWOT Analysis
- 12.2.7.4. Recent Developments
- 12.2.7.5. Financials (Based on Availability)
- 12.2.8 Tierra Farms
- 12.2.8.1. Overview
- 12.2.8.2. Products
- 12.2.8.3. SWOT Analysis
- 12.2.8.4. Recent Developments
- 12.2.8.5. Financials (Based on Availability)
- 12.2.9 Borges Agricultural & Industrial Nuts
- 12.2.9.1. Overview
- 12.2.9.2. Products
- 12.2.9.3. SWOT Analysis
- 12.2.9.4. Recent Developments
- 12.2.9.5. Financials (Based on Availability)
- 12.2.10 Ludlow Nut Co Ltd
- 12.2.10.1. Overview
- 12.2.10.2. Products
- 12.2.10.3. SWOT Analysis
- 12.2.10.4. Recent Developments
- 12.2.10.5. Financials (Based on Availability)
- 12.2.1 Royal Nut Company
List of Figures
- Figure 1: Global Nut Fruits Industry Revenue Breakdown (billion, %) by Region 2025 & 2033
- Figure 2: Global Nut Fruits Industry Volume Breakdown (K Tons, %) by Region 2025 & 2033
- Figure 3: North America Nut Fruits Industry Revenue (billion), by Product Type 2025 & 2033
- Figure 4: North America Nut Fruits Industry Volume (K Tons), by Product Type 2025 & 2033
- Figure 5: North America Nut Fruits Industry Revenue Share (%), by Product Type 2025 & 2033
- Figure 6: North America Nut Fruits Industry Volume Share (%), by Product Type 2025 & 2033
- Figure 7: North America Nut Fruits Industry Revenue (billion), by Category 2025 & 2033
- Figure 8: North America Nut Fruits Industry Volume (K Tons), by Category 2025 & 2033
- Figure 9: North America Nut Fruits Industry Revenue Share (%), by Category 2025 & 2033
- Figure 10: North America Nut Fruits Industry Volume Share (%), by Category 2025 & 2033
- Figure 11: North America Nut Fruits Industry Revenue (billion), by Coating Type 2025 & 2033
- Figure 12: North America Nut Fruits Industry Volume (K Tons), by Coating Type 2025 & 2033
- Figure 13: North America Nut Fruits Industry Revenue Share (%), by Coating Type 2025 & 2033
- Figure 14: North America Nut Fruits Industry Volume Share (%), by Coating Type 2025 & 2033
- Figure 15: North America Nut Fruits Industry Revenue (billion), by Form 2025 & 2033
- Figure 16: North America Nut Fruits Industry Volume (K Tons), by Form 2025 & 2033
- Figure 17: North America Nut Fruits Industry Revenue Share (%), by Form 2025 & 2033
- Figure 18: North America Nut Fruits Industry Volume Share (%), by Form 2025 & 2033
- Figure 19: North America Nut Fruits Industry Revenue (billion), by End-User 2025 & 2033
- Figure 20: North America Nut Fruits Industry Volume (K Tons), by End-User 2025 & 2033
- Figure 21: North America Nut Fruits Industry Revenue Share (%), by End-User 2025 & 2033
- Figure 22: North America Nut Fruits Industry Volume Share (%), by End-User 2025 & 2033
- Figure 23: North America Nut Fruits Industry Revenue (billion), by Distribution Channel 2025 & 2033
- Figure 24: North America Nut Fruits Industry Volume (K Tons), by Distribution Channel 2025 & 2033
- Figure 25: North America Nut Fruits Industry Revenue Share (%), by Distribution Channel 2025 & 2033
- Figure 26: North America Nut Fruits Industry Volume Share (%), by Distribution Channel 2025 & 2033
- Figure 27: North America Nut Fruits Industry Revenue (billion), by Country 2025 & 2033
- Figure 28: North America Nut Fruits Industry Volume (K Tons), by Country 2025 & 2033
- Figure 29: North America Nut Fruits Industry Revenue Share (%), by Country 2025 & 2033
- Figure 30: North America Nut Fruits Industry Volume Share (%), by Country 2025 & 2033
- Figure 31: Europe Nut Fruits Industry Revenue (billion), by Product Type 2025 & 2033
- Figure 32: Europe Nut Fruits Industry Volume (K Tons), by Product Type 2025 & 2033
- Figure 33: Europe Nut Fruits Industry Revenue Share (%), by Product Type 2025 & 2033
- Figure 34: Europe Nut Fruits Industry Volume Share (%), by Product Type 2025 & 2033
- Figure 35: Europe Nut Fruits Industry Revenue (billion), by Category 2025 & 2033
- Figure 36: Europe Nut Fruits Industry Volume (K Tons), by Category 2025 & 2033
- Figure 37: Europe Nut Fruits Industry Revenue Share (%), by Category 2025 & 2033
- Figure 38: Europe Nut Fruits Industry Volume Share (%), by Category 2025 & 2033
- Figure 39: Europe Nut Fruits Industry Revenue (billion), by Coating Type 2025 & 2033
- Figure 40: Europe Nut Fruits Industry Volume (K Tons), by Coating Type 2025 & 2033
- Figure 41: Europe Nut Fruits Industry Revenue Share (%), by Coating Type 2025 & 2033
- Figure 42: Europe Nut Fruits Industry Volume Share (%), by Coating Type 2025 & 2033
- Figure 43: Europe Nut Fruits Industry Revenue (billion), by Form 2025 & 2033
- Figure 44: Europe Nut Fruits Industry Volume (K Tons), by Form 2025 & 2033
- Figure 45: Europe Nut Fruits Industry Revenue Share (%), by Form 2025 & 2033
- Figure 46: Europe Nut Fruits Industry Volume Share (%), by Form 2025 & 2033
- Figure 47: Europe Nut Fruits Industry Revenue (billion), by End-User 2025 & 2033
- Figure 48: Europe Nut Fruits Industry Volume (K Tons), by End-User 2025 & 2033
- Figure 49: Europe Nut Fruits Industry Revenue Share (%), by End-User 2025 & 2033
- Figure 50: Europe Nut Fruits Industry Volume Share (%), by End-User 2025 & 2033
- Figure 51: Europe Nut Fruits Industry Revenue (billion), by Distribution Channel 2025 & 2033
- Figure 52: Europe Nut Fruits Industry Volume (K Tons), by Distribution Channel 2025 & 2033
- Figure 53: Europe Nut Fruits Industry Revenue Share (%), by Distribution Channel 2025 & 2033
- Figure 54: Europe Nut Fruits Industry Volume Share (%), by Distribution Channel 2025 & 2033
- Figure 55: Europe Nut Fruits Industry Revenue (billion), by Country 2025 & 2033
- Figure 56: Europe Nut Fruits Industry Volume (K Tons), by Country 2025 & 2033
- Figure 57: Europe Nut Fruits Industry Revenue Share (%), by Country 2025 & 2033
- Figure 58: Europe Nut Fruits Industry Volume Share (%), by Country 2025 & 2033
- Figure 59: Asia Pacific Nut Fruits Industry Revenue (billion), by Product Type 2025 & 2033
- Figure 60: Asia Pacific Nut Fruits Industry Volume (K Tons), by Product Type 2025 & 2033
- Figure 61: Asia Pacific Nut Fruits Industry Revenue Share (%), by Product Type 2025 & 2033
- Figure 62: Asia Pacific Nut Fruits Industry Volume Share (%), by Product Type 2025 & 2033
- Figure 63: Asia Pacific Nut Fruits Industry Revenue (billion), by Category 2025 & 2033
- Figure 64: Asia Pacific Nut Fruits Industry Volume (K Tons), by Category 2025 & 2033
- Figure 65: Asia Pacific Nut Fruits Industry Revenue Share (%), by Category 2025 & 2033
- Figure 66: Asia Pacific Nut Fruits Industry Volume Share (%), by Category 2025 & 2033
- Figure 67: Asia Pacific Nut Fruits Industry Revenue (billion), by Coating Type 2025 & 2033
- Figure 68: Asia Pacific Nut Fruits Industry Volume (K Tons), by Coating Type 2025 & 2033
- Figure 69: Asia Pacific Nut Fruits Industry Revenue Share (%), by Coating Type 2025 & 2033
- Figure 70: Asia Pacific Nut Fruits Industry Volume Share (%), by Coating Type 2025 & 2033
- Figure 71: Asia Pacific Nut Fruits Industry Revenue (billion), by Form 2025 & 2033
- Figure 72: Asia Pacific Nut Fruits Industry Volume (K Tons), by Form 2025 & 2033
- Figure 73: Asia Pacific Nut Fruits Industry Revenue Share (%), by Form 2025 & 2033
- Figure 74: Asia Pacific Nut Fruits Industry Volume Share (%), by Form 2025 & 2033
- Figure 75: Asia Pacific Nut Fruits Industry Revenue (billion), by End-User 2025 & 2033
- Figure 76: Asia Pacific Nut Fruits Industry Volume (K Tons), by End-User 2025 & 2033
- Figure 77: Asia Pacific Nut Fruits Industry Revenue Share (%), by End-User 2025 & 2033
- Figure 78: Asia Pacific Nut Fruits Industry Volume Share (%), by End-User 2025 & 2033
- Figure 79: Asia Pacific Nut Fruits Industry Revenue (billion), by Distribution Channel 2025 & 2033
- Figure 80: Asia Pacific Nut Fruits Industry Volume (K Tons), by Distribution Channel 2025 & 2033
- Figure 81: Asia Pacific Nut Fruits Industry Revenue Share (%), by Distribution Channel 2025 & 2033
- Figure 82: Asia Pacific Nut Fruits Industry Volume Share (%), by Distribution Channel 2025 & 2033
- Figure 83: Asia Pacific Nut Fruits Industry Revenue (billion), by Country 2025 & 2033
- Figure 84: Asia Pacific Nut Fruits Industry Volume (K Tons), by Country 2025 & 2033
- Figure 85: Asia Pacific Nut Fruits Industry Revenue Share (%), by Country 2025 & 2033
- Figure 86: Asia Pacific Nut Fruits Industry Volume Share (%), by Country 2025 & 2033
- Figure 87: South America Nut Fruits Industry Revenue (billion), by Product Type 2025 & 2033
- Figure 88: South America Nut Fruits Industry Volume (K Tons), by Product Type 2025 & 2033
- Figure 89: South America Nut Fruits Industry Revenue Share (%), by Product Type 2025 & 2033
- Figure 90: South America Nut Fruits Industry Volume Share (%), by Product Type 2025 & 2033
- Figure 91: South America Nut Fruits Industry Revenue (billion), by Category 2025 & 2033
- Figure 92: South America Nut Fruits Industry Volume (K Tons), by Category 2025 & 2033
- Figure 93: South America Nut Fruits Industry Revenue Share (%), by Category 2025 & 2033
- Figure 94: South America Nut Fruits Industry Volume Share (%), by Category 2025 & 2033
- Figure 95: South America Nut Fruits Industry Revenue (billion), by Coating Type 2025 & 2033
- Figure 96: South America Nut Fruits Industry Volume (K Tons), by Coating Type 2025 & 2033
- Figure 97: South America Nut Fruits Industry Revenue Share (%), by Coating Type 2025 & 2033
- Figure 98: South America Nut Fruits Industry Volume Share (%), by Coating Type 2025 & 2033
- Figure 99: South America Nut Fruits Industry Revenue (billion), by Form 2025 & 2033
- Figure 100: South America Nut Fruits Industry Volume (K Tons), by Form 2025 & 2033
- Figure 101: South America Nut Fruits Industry Revenue Share (%), by Form 2025 & 2033
- Figure 102: South America Nut Fruits Industry Volume Share (%), by Form 2025 & 2033
- Figure 103: South America Nut Fruits Industry Revenue (billion), by End-User 2025 & 2033
- Figure 104: South America Nut Fruits Industry Volume (K Tons), by End-User 2025 & 2033
- Figure 105: South America Nut Fruits Industry Revenue Share (%), by End-User 2025 & 2033
- Figure 106: South America Nut Fruits Industry Volume Share (%), by End-User 2025 & 2033
- Figure 107: South America Nut Fruits Industry Revenue (billion), by Distribution Channel 2025 & 2033
- Figure 108: South America Nut Fruits Industry Volume (K Tons), by Distribution Channel 2025 & 2033
- Figure 109: South America Nut Fruits Industry Revenue Share (%), by Distribution Channel 2025 & 2033
- Figure 110: South America Nut Fruits Industry Volume Share (%), by Distribution Channel 2025 & 2033
- Figure 111: South America Nut Fruits Industry Revenue (billion), by Country 2025 & 2033
- Figure 112: South America Nut Fruits Industry Volume (K Tons), by Country 2025 & 2033
- Figure 113: South America Nut Fruits Industry Revenue Share (%), by Country 2025 & 2033
- Figure 114: South America Nut Fruits Industry Volume Share (%), by Country 2025 & 2033
- Figure 115: Middle East Nut Fruits Industry Revenue (billion), by Product Type 2025 & 2033
- Figure 116: Middle East Nut Fruits Industry Volume (K Tons), by Product Type 2025 & 2033
- Figure 117: Middle East Nut Fruits Industry Revenue Share (%), by Product Type 2025 & 2033
- Figure 118: Middle East Nut Fruits Industry Volume Share (%), by Product Type 2025 & 2033
- Figure 119: Middle East Nut Fruits Industry Revenue (billion), by Category 2025 & 2033
- Figure 120: Middle East Nut Fruits Industry Volume (K Tons), by Category 2025 & 2033
- Figure 121: Middle East Nut Fruits Industry Revenue Share (%), by Category 2025 & 2033
- Figure 122: Middle East Nut Fruits Industry Volume Share (%), by Category 2025 & 2033
- Figure 123: Middle East Nut Fruits Industry Revenue (billion), by Coating Type 2025 & 2033
- Figure 124: Middle East Nut Fruits Industry Volume (K Tons), by Coating Type 2025 & 2033
- Figure 125: Middle East Nut Fruits Industry Revenue Share (%), by Coating Type 2025 & 2033
- Figure 126: Middle East Nut Fruits Industry Volume Share (%), by Coating Type 2025 & 2033
- Figure 127: Middle East Nut Fruits Industry Revenue (billion), by Form 2025 & 2033
- Figure 128: Middle East Nut Fruits Industry Volume (K Tons), by Form 2025 & 2033
- Figure 129: Middle East Nut Fruits Industry Revenue Share (%), by Form 2025 & 2033
- Figure 130: Middle East Nut Fruits Industry Volume Share (%), by Form 2025 & 2033
- Figure 131: Middle East Nut Fruits Industry Revenue (billion), by End-User 2025 & 2033
- Figure 132: Middle East Nut Fruits Industry Volume (K Tons), by End-User 2025 & 2033
- Figure 133: Middle East Nut Fruits Industry Revenue Share (%), by End-User 2025 & 2033
- Figure 134: Middle East Nut Fruits Industry Volume Share (%), by End-User 2025 & 2033
- Figure 135: Middle East Nut Fruits Industry Revenue (billion), by Distribution Channel 2025 & 2033
- Figure 136: Middle East Nut Fruits Industry Volume (K Tons), by Distribution Channel 2025 & 2033
- Figure 137: Middle East Nut Fruits Industry Revenue Share (%), by Distribution Channel 2025 & 2033
- Figure 138: Middle East Nut Fruits Industry Volume Share (%), by Distribution Channel 2025 & 2033
- Figure 139: Middle East Nut Fruits Industry Revenue (billion), by Country 2025 & 2033
- Figure 140: Middle East Nut Fruits Industry Volume (K Tons), by Country 2025 & 2033
- Figure 141: Middle East Nut Fruits Industry Revenue Share (%), by Country 2025 & 2033
- Figure 142: Middle East Nut Fruits Industry Volume Share (%), by Country 2025 & 2033
- Figure 143: Saudi Arabia Nut Fruits Industry Revenue (billion), by Product Type 2025 & 2033
- Figure 144: Saudi Arabia Nut Fruits Industry Volume (K Tons), by Product Type 2025 & 2033
- Figure 145: Saudi Arabia Nut Fruits Industry Revenue Share (%), by Product Type 2025 & 2033
- Figure 146: Saudi Arabia Nut Fruits Industry Volume Share (%), by Product Type 2025 & 2033
- Figure 147: Saudi Arabia Nut Fruits Industry Revenue (billion), by Category 2025 & 2033
- Figure 148: Saudi Arabia Nut Fruits Industry Volume (K Tons), by Category 2025 & 2033
- Figure 149: Saudi Arabia Nut Fruits Industry Revenue Share (%), by Category 2025 & 2033
- Figure 150: Saudi Arabia Nut Fruits Industry Volume Share (%), by Category 2025 & 2033
- Figure 151: Saudi Arabia Nut Fruits Industry Revenue (billion), by Coating Type 2025 & 2033
- Figure 152: Saudi Arabia Nut Fruits Industry Volume (K Tons), by Coating Type 2025 & 2033
- Figure 153: Saudi Arabia Nut Fruits Industry Revenue Share (%), by Coating Type 2025 & 2033
- Figure 154: Saudi Arabia Nut Fruits Industry Volume Share (%), by Coating Type 2025 & 2033
- Figure 155: Saudi Arabia Nut Fruits Industry Revenue (billion), by Form 2025 & 2033
- Figure 156: Saudi Arabia Nut Fruits Industry Volume (K Tons), by Form 2025 & 2033
- Figure 157: Saudi Arabia Nut Fruits Industry Revenue Share (%), by Form 2025 & 2033
- Figure 158: Saudi Arabia Nut Fruits Industry Volume Share (%), by Form 2025 & 2033
- Figure 159: Saudi Arabia Nut Fruits Industry Revenue (billion), by End-User 2025 & 2033
- Figure 160: Saudi Arabia Nut Fruits Industry Volume (K Tons), by End-User 2025 & 2033
- Figure 161: Saudi Arabia Nut Fruits Industry Revenue Share (%), by End-User 2025 & 2033
- Figure 162: Saudi Arabia Nut Fruits Industry Volume Share (%), by End-User 2025 & 2033
- Figure 163: Saudi Arabia Nut Fruits Industry Revenue (billion), by Distribution Channel 2025 & 2033
- Figure 164: Saudi Arabia Nut Fruits Industry Volume (K Tons), by Distribution Channel 2025 & 2033
- Figure 165: Saudi Arabia Nut Fruits Industry Revenue Share (%), by Distribution Channel 2025 & 2033
- Figure 166: Saudi Arabia Nut Fruits Industry Volume Share (%), by Distribution Channel 2025 & 2033
- Figure 167: Saudi Arabia Nut Fruits Industry Revenue (billion), by Country 2025 & 2033
- Figure 168: Saudi Arabia Nut Fruits Industry Volume (K Tons), by Country 2025 & 2033
- Figure 169: Saudi Arabia Nut Fruits Industry Revenue Share (%), by Country 2025 & 2033
- Figure 170: Saudi Arabia Nut Fruits Industry Volume Share (%), by Country 2025 & 2033
List of Tables
- Table 1: Global Nut Fruits Industry Revenue billion Forecast, by Product Type 2020 & 2033
- Table 2: Global Nut Fruits Industry Volume K Tons Forecast, by Product Type 2020 & 2033
- Table 3: Global Nut Fruits Industry Revenue billion Forecast, by Category 2020 & 2033
- Table 4: Global Nut Fruits Industry Volume K Tons Forecast, by Category 2020 & 2033
- Table 5: Global Nut Fruits Industry Revenue billion Forecast, by Coating Type 2020 & 2033
- Table 6: Global Nut Fruits Industry Volume K Tons Forecast, by Coating Type 2020 & 2033
- Table 7: Global Nut Fruits Industry Revenue billion Forecast, by Form 2020 & 2033
- Table 8: Global Nut Fruits Industry Volume K Tons Forecast, by Form 2020 & 2033
- Table 9: Global Nut Fruits Industry Revenue billion Forecast, by End-User 2020 & 2033
- Table 10: Global Nut Fruits Industry Volume K Tons Forecast, by End-User 2020 & 2033
- Table 11: Global Nut Fruits Industry Revenue billion Forecast, by Distribution Channel 2020 & 2033
- Table 12: Global Nut Fruits Industry Volume K Tons Forecast, by Distribution Channel 2020 & 2033
- Table 13: Global Nut Fruits Industry Revenue billion Forecast, by Region 2020 & 2033
- Table 14: Global Nut Fruits Industry Volume K Tons Forecast, by Region 2020 & 2033
- Table 15: Global Nut Fruits Industry Revenue billion Forecast, by Product Type 2020 & 2033
- Table 16: Global Nut Fruits Industry Volume K Tons Forecast, by Product Type 2020 & 2033
- Table 17: Global Nut Fruits Industry Revenue billion Forecast, by Category 2020 & 2033
- Table 18: Global Nut Fruits Industry Volume K Tons Forecast, by Category 2020 & 2033
- Table 19: Global Nut Fruits Industry Revenue billion Forecast, by Coating Type 2020 & 2033
- Table 20: Global Nut Fruits Industry Volume K Tons Forecast, by Coating Type 2020 & 2033
- Table 21: Global Nut Fruits Industry Revenue billion Forecast, by Form 2020 & 2033
- Table 22: Global Nut Fruits Industry Volume K Tons Forecast, by Form 2020 & 2033
- Table 23: Global Nut Fruits Industry Revenue billion Forecast, by End-User 2020 & 2033
- Table 24: Global Nut Fruits Industry Volume K Tons Forecast, by End-User 2020 & 2033
- Table 25: Global Nut Fruits Industry Revenue billion Forecast, by Distribution Channel 2020 & 2033
- Table 26: Global Nut Fruits Industry Volume K Tons Forecast, by Distribution Channel 2020 & 2033
- Table 27: Global Nut Fruits Industry Revenue billion Forecast, by Country 2020 & 2033
- Table 28: Global Nut Fruits Industry Volume K Tons Forecast, by Country 2020 & 2033
- Table 29: United States Nut Fruits Industry Revenue (billion) Forecast, by Application 2020 & 2033
- Table 30: United States Nut Fruits Industry Volume (K Tons) Forecast, by Application 2020 & 2033
- Table 31: Canada Nut Fruits Industry Revenue (billion) Forecast, by Application 2020 & 2033
- Table 32: Canada Nut Fruits Industry Volume (K Tons) Forecast, by Application 2020 & 2033
- Table 33: Mexico Nut Fruits Industry Revenue (billion) Forecast, by Application 2020 & 2033
- Table 34: Mexico Nut Fruits Industry Volume (K Tons) Forecast, by Application 2020 & 2033
- Table 35: Rest of North America Nut Fruits Industry Revenue (billion) Forecast, by Application 2020 & 2033
- Table 36: Rest of North America Nut Fruits Industry Volume (K Tons) Forecast, by Application 2020 & 2033
- Table 37: Global Nut Fruits Industry Revenue billion Forecast, by Product Type 2020 & 2033
- Table 38: Global Nut Fruits Industry Volume K Tons Forecast, by Product Type 2020 & 2033
- Table 39: Global Nut Fruits Industry Revenue billion Forecast, by Category 2020 & 2033
- Table 40: Global Nut Fruits Industry Volume K Tons Forecast, by Category 2020 & 2033
- Table 41: Global Nut Fruits Industry Revenue billion Forecast, by Coating Type 2020 & 2033
- Table 42: Global Nut Fruits Industry Volume K Tons Forecast, by Coating Type 2020 & 2033
- Table 43: Global Nut Fruits Industry Revenue billion Forecast, by Form 2020 & 2033
- Table 44: Global Nut Fruits Industry Volume K Tons Forecast, by Form 2020 & 2033
- Table 45: Global Nut Fruits Industry Revenue billion Forecast, by End-User 2020 & 2033
- Table 46: Global Nut Fruits Industry Volume K Tons Forecast, by End-User 2020 & 2033
- Table 47: Global Nut Fruits Industry Revenue billion Forecast, by Distribution Channel 2020 & 2033
- Table 48: Global Nut Fruits Industry Volume K Tons Forecast, by Distribution Channel 2020 & 2033
- Table 49: Global Nut Fruits Industry Revenue billion Forecast, by Country 2020 & 2033
- Table 50: Global Nut Fruits Industry Volume K Tons Forecast, by Country 2020 & 2033
- Table 51: United Kingdom Nut Fruits Industry Revenue (billion) Forecast, by Application 2020 & 2033
- Table 52: United Kingdom Nut Fruits Industry Volume (K Tons) Forecast, by Application 2020 & 2033
- Table 53: Germany Nut Fruits Industry Revenue (billion) Forecast, by Application 2020 & 2033
- Table 54: Germany Nut Fruits Industry Volume (K Tons) Forecast, by Application 2020 & 2033
- Table 55: Spain Nut Fruits Industry Revenue (billion) Forecast, by Application 2020 & 2033
- Table 56: Spain Nut Fruits Industry Volume (K Tons) Forecast, by Application 2020 & 2033
- Table 57: France Nut Fruits Industry Revenue (billion) Forecast, by Application 2020 & 2033
- Table 58: France Nut Fruits Industry Volume (K Tons) Forecast, by Application 2020 & 2033
- Table 59: Italy Nut Fruits Industry Revenue (billion) Forecast, by Application 2020 & 2033
- Table 60: Italy Nut Fruits Industry Volume (K Tons) Forecast, by Application 2020 & 2033
- Table 61: Russia Nut Fruits Industry Revenue (billion) Forecast, by Application 2020 & 2033
- Table 62: Russia Nut Fruits Industry Volume (K Tons) Forecast, by Application 2020 & 2033
- Table 63: Rest of Europe Nut Fruits Industry Revenue (billion) Forecast, by Application 2020 & 2033
- Table 64: Rest of Europe Nut Fruits Industry Volume (K Tons) Forecast, by Application 2020 & 2033
- Table 65: Global Nut Fruits Industry Revenue billion Forecast, by Product Type 2020 & 2033
- Table 66: Global Nut Fruits Industry Volume K Tons Forecast, by Product Type 2020 & 2033
- Table 67: Global Nut Fruits Industry Revenue billion Forecast, by Category 2020 & 2033
- Table 68: Global Nut Fruits Industry Volume K Tons Forecast, by Category 2020 & 2033
- Table 69: Global Nut Fruits Industry Revenue billion Forecast, by Coating Type 2020 & 2033
- Table 70: Global Nut Fruits Industry Volume K Tons Forecast, by Coating Type 2020 & 2033
- Table 71: Global Nut Fruits Industry Revenue billion Forecast, by Form 2020 & 2033
- Table 72: Global Nut Fruits Industry Volume K Tons Forecast, by Form 2020 & 2033
- Table 73: Global Nut Fruits Industry Revenue billion Forecast, by End-User 2020 & 2033
- Table 74: Global Nut Fruits Industry Volume K Tons Forecast, by End-User 2020 & 2033
- Table 75: Global Nut Fruits Industry Revenue billion Forecast, by Distribution Channel 2020 & 2033
- Table 76: Global Nut Fruits Industry Volume K Tons Forecast, by Distribution Channel 2020 & 2033
- Table 77: Global Nut Fruits Industry Revenue billion Forecast, by Country 2020 & 2033
- Table 78: Global Nut Fruits Industry Volume K Tons Forecast, by Country 2020 & 2033
- Table 79: China Nut Fruits Industry Revenue (billion) Forecast, by Application 2020 & 2033
- Table 80: China Nut Fruits Industry Volume (K Tons) Forecast, by Application 2020 & 2033
- Table 81: Japan Nut Fruits Industry Revenue (billion) Forecast, by Application 2020 & 2033
- Table 82: Japan Nut Fruits Industry Volume (K Tons) Forecast, by Application 2020 & 2033
- Table 83: India Nut Fruits Industry Revenue (billion) Forecast, by Application 2020 & 2033
- Table 84: India Nut Fruits Industry Volume (K Tons) Forecast, by Application 2020 & 2033
- Table 85: Australia Nut Fruits Industry Revenue (billion) Forecast, by Application 2020 & 2033
- Table 86: Australia Nut Fruits Industry Volume (K Tons) Forecast, by Application 2020 & 2033
- Table 87: Rest of Asia Pacific Nut Fruits Industry Revenue (billion) Forecast, by Application 2020 & 2033
- Table 88: Rest of Asia Pacific Nut Fruits Industry Volume (K Tons) Forecast, by Application 2020 & 2033
- Table 89: Global Nut Fruits Industry Revenue billion Forecast, by Product Type 2020 & 2033
- Table 90: Global Nut Fruits Industry Volume K Tons Forecast, by Product Type 2020 & 2033
- Table 91: Global Nut Fruits Industry Revenue billion Forecast, by Category 2020 & 2033
- Table 92: Global Nut Fruits Industry Volume K Tons Forecast, by Category 2020 & 2033
- Table 93: Global Nut Fruits Industry Revenue billion Forecast, by Coating Type 2020 & 2033
- Table 94: Global Nut Fruits Industry Volume K Tons Forecast, by Coating Type 2020 & 2033
- Table 95: Global Nut Fruits Industry Revenue billion Forecast, by Form 2020 & 2033
- Table 96: Global Nut Fruits Industry Volume K Tons Forecast, by Form 2020 & 2033
- Table 97: Global Nut Fruits Industry Revenue billion Forecast, by End-User 2020 & 2033
- Table 98: Global Nut Fruits Industry Volume K Tons Forecast, by End-User 2020 & 2033
- Table 99: Global Nut Fruits Industry Revenue billion Forecast, by Distribution Channel 2020 & 2033
- Table 100: Global Nut Fruits Industry Volume K Tons Forecast, by Distribution Channel 2020 & 2033
- Table 101: Global Nut Fruits Industry Revenue billion Forecast, by Country 2020 & 2033
- Table 102: Global Nut Fruits Industry Volume K Tons Forecast, by Country 2020 & 2033
- Table 103: Brazil Nut Fruits Industry Revenue (billion) Forecast, by Application 2020 & 2033
- Table 104: Brazil Nut Fruits Industry Volume (K Tons) Forecast, by Application 2020 & 2033
- Table 105: Argentina Nut Fruits Industry Revenue (billion) Forecast, by Application 2020 & 2033
- Table 106: Argentina Nut Fruits Industry Volume (K Tons) Forecast, by Application 2020 & 2033
- Table 107: Rest of South America Nut Fruits Industry Revenue (billion) Forecast, by Application 2020 & 2033
- Table 108: Rest of South America Nut Fruits Industry Volume (K Tons) Forecast, by Application 2020 & 2033
- Table 109: Global Nut Fruits Industry Revenue billion Forecast, by Product Type 2020 & 2033
- Table 110: Global Nut Fruits Industry Volume K Tons Forecast, by Product Type 2020 & 2033
- Table 111: Global Nut Fruits Industry Revenue billion Forecast, by Category 2020 & 2033
- Table 112: Global Nut Fruits Industry Volume K Tons Forecast, by Category 2020 & 2033
- Table 113: Global Nut Fruits Industry Revenue billion Forecast, by Coating Type 2020 & 2033
- Table 114: Global Nut Fruits Industry Volume K Tons Forecast, by Coating Type 2020 & 2033
- Table 115: Global Nut Fruits Industry Revenue billion Forecast, by Form 2020 & 2033
- Table 116: Global Nut Fruits Industry Volume K Tons Forecast, by Form 2020 & 2033
- Table 117: Global Nut Fruits Industry Revenue billion Forecast, by End-User 2020 & 2033
- Table 118: Global Nut Fruits Industry Volume K Tons Forecast, by End-User 2020 & 2033
- Table 119: Global Nut Fruits Industry Revenue billion Forecast, by Distribution Channel 2020 & 2033
- Table 120: Global Nut Fruits Industry Volume K Tons Forecast, by Distribution Channel 2020 & 2033
- Table 121: Global Nut Fruits Industry Revenue billion Forecast, by Country 2020 & 2033
- Table 122: Global Nut Fruits Industry Volume K Tons Forecast, by Country 2020 & 2033
- Table 123: Global Nut Fruits Industry Revenue billion Forecast, by Product Type 2020 & 2033
- Table 124: Global Nut Fruits Industry Volume K Tons Forecast, by Product Type 2020 & 2033
- Table 125: Global Nut Fruits Industry Revenue billion Forecast, by Category 2020 & 2033
- Table 126: Global Nut Fruits Industry Volume K Tons Forecast, by Category 2020 & 2033
- Table 127: Global Nut Fruits Industry Revenue billion Forecast, by Coating Type 2020 & 2033
- Table 128: Global Nut Fruits Industry Volume K Tons Forecast, by Coating Type 2020 & 2033
- Table 129: Global Nut Fruits Industry Revenue billion Forecast, by Form 2020 & 2033
- Table 130: Global Nut Fruits Industry Volume K Tons Forecast, by Form 2020 & 2033
- Table 131: Global Nut Fruits Industry Revenue billion Forecast, by End-User 2020 & 2033
- Table 132: Global Nut Fruits Industry Volume K Tons Forecast, by End-User 2020 & 2033
- Table 133: Global Nut Fruits Industry Revenue billion Forecast, by Distribution Channel 2020 & 2033
- Table 134: Global Nut Fruits Industry Volume K Tons Forecast, by Distribution Channel 2020 & 2033
- Table 135: Global Nut Fruits Industry Revenue billion Forecast, by Country 2020 & 2033
- Table 136: Global Nut Fruits Industry Volume K Tons Forecast, by Country 2020 & 2033
- Table 137: South Africa Nut Fruits Industry Revenue (billion) Forecast, by Application 2020 & 2033
- Table 138: South Africa Nut Fruits Industry Volume (K Tons) Forecast, by Application 2020 & 2033
- Table 139: Rest of Middle East Nut Fruits Industry Revenue (billion) Forecast, by Application 2020 & 2033
- Table 140: Rest of Middle East Nut Fruits Industry Volume (K Tons) Forecast, by Application 2020 & 2033
Frequently Asked Questions
1. What is the projected Compound Annual Growth Rate (CAGR) of the Nut Fruits Industry?
The projected CAGR is approximately 6.24%.
2. Which companies are prominent players in the Nut Fruits Industry?
Key companies in the market include Royal Nut Company, Germack Pistachio Company, HBS Natural Choice, Sun Organic Farms, Olam International Ltd, Blue Diamond Growers, South Valley Farms, Tierra Farms, Borges Agricultural & Industrial Nuts, Ludlow Nut Co Ltd.
3. What are the main segments of the Nut Fruits Industry?
The market segments include Product Type, Category, Coating Type, Form, End-User, Distribution Channel.
4. Can you provide details about the market size?
The market size is estimated to be USD 923.94 billion as of 2022.
5. What are some drivers contributing to market growth?
Increasing consumer awareness about health benefits of nuts and fruits.
6. What are the notable trends driving market growth?
Increasing demand for organic and non-GMO nuts and fruits.
7. Are there any restraints impacting market growth?
Cost of nuts and fruits can be relatively high compared to other snacks.
8. Can you provide examples of recent developments in the market?
N/A
9. What pricing options are available for accessing the report?
Pricing options include single-user, multi-user, and enterprise licenses priced at USD 4750, USD 5250, and USD 8750 respectively.
10. Is the market size provided in terms of value or volume?
The market size is provided in terms of value, measured in billion and volume, measured in K Tons.
11. Are there any specific market keywords associated with the report?
Yes, the market keyword associated with the report is "Nut Fruits Industry," which aids in identifying and referencing the specific market segment covered.
12. How do I determine which pricing option suits my needs best?
The pricing options vary based on user requirements and access needs. Individual users may opt for single-user licenses, while businesses requiring broader access may choose multi-user or enterprise licenses for cost-effective access to the report.
13. Are there any additional resources or data provided in the Nut Fruits Industry report?
While the report offers comprehensive insights, it's advisable to review the specific contents or supplementary materials provided to ascertain if additional resources or data are available.
14. How can I stay updated on further developments or reports in the Nut Fruits Industry?
To stay informed about further developments, trends, and reports in the Nut Fruits Industry, consider subscribing to industry newsletters, following relevant companies and organizations, or regularly checking reputable industry news sources and publications.
Methodology
Step 1 - Identification of Relevant Samples Size from Population Database


Step 2 - Approaches for Defining Global Market Size (Value, Volume* & Price*)

Note*: In applicable scenarios
Step 3 - Data Sources
Primary Research
- Web Analytics
- Survey Reports
- Research Institute
- Latest Research Reports
- Opinion Leaders
Secondary Research
- Annual Reports
- White Paper
- Latest Press Release
- Industry Association
- Paid Database
- Investor Presentations

Step 4 - Data Triangulation
Involves using different sources of information in order to increase the validity of a study
These sources are likely to be stakeholders in a program - participants, other researchers, program staff, other community members, and so on.
Then we put all data in single framework & apply various statistical tools to find out the dynamic on the market.
During the analysis stage, feedback from the stakeholder groups would be compared to determine areas of agreement as well as areas of divergence