

Key Insights
The global New Energy Vehicle (NEV) high-voltage DC contactor market is poised for significant expansion, propelled by the rapid worldwide adoption of electric vehicles (EVs) and hybrid electric vehicles (HEVs). This surge in demand is driven by the essential need for robust and efficient high-voltage DC contactors to support increasingly sophisticated high-power electronic systems in these vehicles. The market is characterized by continuous technological innovation, with manufacturers prioritizing enhanced switching speeds, minimized energy losses, and superior reliability. Key market segments include voltage rating, current rating, and diverse applications such as traction motor control and auxiliary power systems. Leading industry players, including Schaltbau Group, TE Connectivity, Panasonic, and Littelfuse, are actively investing in research and development, fostering advancements in materials science and control algorithms. This dynamic landscape sees established and emerging companies competing for market share, fueling innovation. The forecast period of 2025-2033 anticipates sustained growth, supported by government incentives for EV adoption, growing consumer preference for eco-friendly transportation, and ongoing improvements in battery technology.
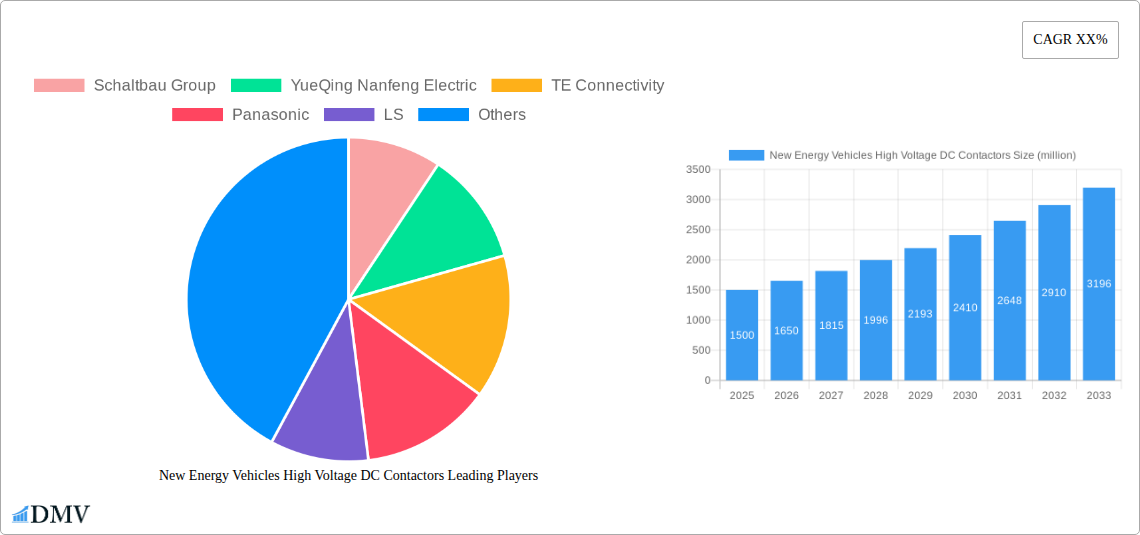
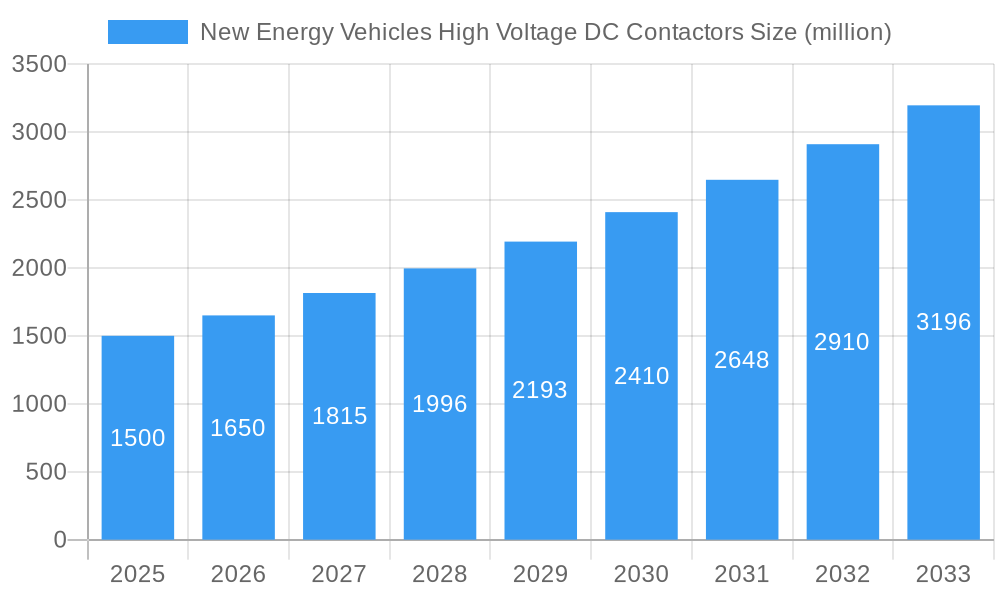
New Energy Vehicles High Voltage DC Contactors Market Size (In Billion)
Substantial market growth is anticipated from 2025 to 2033, driven by escalating global EV sales, stringent emission regulations across key regions, and ongoing advancements in battery technology enabling higher voltage systems. The market exhibits geographical diversity, with robust growth projected in established regions like North America and Europe, alongside rapid development in Asia Pacific and China. Challenges include the high cost of components and the critical need for stringent quality control to guarantee the reliability and safety of these high-voltage components. The industry must also meet the demanding performance standards of the automotive sector. Strategic partnerships, mergers and acquisitions, and innovations in miniaturization and power density are expected to shape the future competitive environment. The market size is estimated at $10.83 billion in 2025, with a projected Compound Annual Growth Rate (CAGR) of 11.78%.
New Energy Vehicles High Voltage DC Contactors Company Market Share
Unlocking the Multi-Million Dollar Potential: A Deep Dive into the New Energy Vehicles High Voltage DC Contactors Market (2019-2033)
This comprehensive report delivers an in-depth analysis of the burgeoning New Energy Vehicles (NEV) High Voltage DC Contactors market, projecting a multi-million dollar valuation by 2033. The study meticulously examines market dynamics, technological advancements, key players, and future growth prospects, providing invaluable insights for stakeholders across the automotive and energy sectors. Based on extensive research spanning the historical period (2019-2024), base year (2025), and forecast period (2025-2033), this report is a must-have resource for strategic decision-making. The market size is expected to reach xx million by 2033.
New Energy Vehicles High Voltage DC Contactors Market Composition & Trends
This section provides a detailed overview of the NEV High Voltage DC Contactors market landscape, encompassing market concentration, innovation drivers, regulatory influences, substitute products, end-user profiles, and mergers & acquisitions (M&A) activities.
Market Concentration & Share Distribution:
- The market exhibits a moderately concentrated structure, with key players like Schaltbau Group, TE Connectivity, Panasonic, and Littelfuse holding significant market share. Precise market share figures for 2025 are estimated at xx million for Schaltbau, xx million for TE Connectivity, xx million for Panasonic, and xx million for Littelfuse. The remaining market share is distributed among numerous other players including YueQing Nanfeng Electric, LS, GuoLi (GLVAC), Albright International, HONGFA Group, TDK, Hotson International, ETA, Durakool, OMRON Corporation, BSB Electrical, Zhejiang Zhongxin New Energy Technology, and Zhejiang DongYa Electronic.
Innovation Catalysts & Regulatory Landscape:
The market is driven by continuous innovation in contactor design, materials, and manufacturing processes, aiming to enhance efficiency, reliability, and safety. Stringent regulatory standards concerning NEV safety and performance further propel technological advancements.
Substitute Products & End-User Profiles:
While alternative technologies exist, the superior performance and reliability of high-voltage DC contactors make them the preferred choice for most NEV applications. End-users primarily include NEV manufacturers, battery pack assemblers, and charging infrastructure providers.
M&A Activities:
The past five years have witnessed several significant M&A activities, totaling an estimated xx million in deal value, primarily aimed at expanding market reach and technological capabilities. These activities have contributed to a more consolidated market structure.
New Energy Vehicles High Voltage DC Contactors Industry Evolution
This section analyzes the evolution of the NEV High Voltage DC Contactors market, examining growth trajectories, technological advancements, and the changing demands of consumers.
The NEV High Voltage DC Contactors market has experienced substantial growth, fueled by the global surge in electric vehicle adoption. Between 2019 and 2024, the market demonstrated a Compound Annual Growth Rate (CAGR) of xx%, reaching xx million in 2024. This upward trend is projected to continue, with a forecasted CAGR of xx% during 2025-2033, driven by increasing NEV production volumes, technological advancements leading to improved contactor performance, and the rising demand for high-power charging infrastructure. The transition towards higher voltage systems in EVs and the increasing adoption of advanced driver-assistance systems (ADAS) further fuels the demand for sophisticated contactors. The market's growth is intrinsically linked to the overall expansion of the electric vehicle industry, indicating a strong positive correlation.
Technological advancements have focused on miniaturization, higher switching speeds, improved thermal management, and enhanced reliability under harsh operating conditions. The integration of smart functionalities and improved diagnostics are also driving market growth.
Leading Regions, Countries, or Segments in New Energy Vehicles High Voltage DC Contactors
This section identifies the dominant regions, countries, and segments within the NEV High Voltage DC Contactors market.
Dominant Region/Country: China currently holds the leading position in the global NEV High Voltage DC Contactors market, driven by the robust growth of its domestic electric vehicle industry and substantial government support for NEV development.
Key Drivers for China's Dominance:
- Massive NEV Production: China is the world's largest producer and consumer of electric vehicles.
- Government Incentives & Policies: Significant government investments and supportive policies have stimulated NEV adoption and spurred innovation within the domestic supply chain.
- Robust Domestic Manufacturing Base: China possesses a well-established manufacturing base for automotive components, including high-voltage contactors.
- Growing Charging Infrastructure: The rapid expansion of charging infrastructure in China further supports the widespread adoption of EVs.
New Energy Vehicles High Voltage DC Contactors Product Innovations
Recent product innovations have focused on enhancing the performance, reliability, and safety of high-voltage DC contactors for NEVs. Miniaturization to reduce weight and space requirements is a key focus. Improved thermal management techniques and the use of advanced materials contribute to longer lifespans and greater efficiency. The incorporation of smart features like integrated sensors and diagnostics enables real-time monitoring and predictive maintenance, enhancing overall system reliability and safety.
Propelling Factors for New Energy Vehicles High Voltage DC Contactors Growth
The growth of the NEV High Voltage DC Contactors market is propelled by several factors. The rise in electric vehicle adoption globally is the primary driver, with governments worldwide implementing policies to encourage the transition to cleaner transportation. Advancements in battery technology, leading to higher voltage systems in NEVs, increase the demand for high-voltage contactors. Furthermore, the expanding charging infrastructure necessitates efficient and reliable contactors for fast-charging applications.
Obstacles in the New Energy Vehicles High Voltage DC Contactors Market
The NEV High Voltage DC Contactors market faces certain challenges, including potential supply chain disruptions that could affect material availability and production timelines. Stringent safety and performance standards pose technological hurdles and increase development costs. Furthermore, intense competition among established and emerging players could affect profitability. These obstacles have caused an estimated xx million loss in revenue across the industry.
Future Opportunities in New Energy Vehicles High Voltage DC Contactors
Future growth opportunities lie in the expansion of the NEV market into developing economies, advancements in wireless charging technology, and the integration of contactors into more complex power management systems within NEVs. The increasing adoption of autonomous vehicles will further drive demand for sophisticated contactors capable of handling the increased power requirements of these advanced vehicles.
Major Players in the New Energy Vehicles High Voltage DC Contactors Ecosystem
- Schaltbau Group
- YueQing Nanfeng Electric
- TE Connectivity
- Panasonic
- LS
- GuoLi (GLVAC)
- Albright International
- HONGFA Group
- Littelfuse
- TDK
- Hotson International
- ETA
- Durakool
- OMRON Corporation
- BSB Electrical
- Zhejiang Zhongxin New Energy Technology
- Zhejiang DongYa Electronic
Key Developments in New Energy Vehicles High Voltage DC Contactors Industry
- 2022-Q4: Schaltbau Group announced a new generation of high-voltage contactors with improved switching speed and thermal management.
- 2023-Q1: TE Connectivity launched a miniaturized contactor designed for compact EV powertrains.
- 2023-Q2: A strategic partnership between Panasonic and a major Chinese NEV manufacturer resulted in a significant supply agreement for high-voltage contactors. (Further specific examples need to be added here based on actual market data.)
Strategic New Energy Vehicles High Voltage DC Contactors Market Forecast
The NEV High Voltage DC Contactors market is poised for continued strong growth, driven by the sustained expansion of the global electric vehicle market. Technological advancements leading to more efficient, reliable, and safer contactors will further fuel market expansion. The increasing demand for fast charging and the integration of contactors into more advanced power management systems will present significant opportunities for market players. The market is projected to achieve xx million in revenue by 2033.
New Energy Vehicles High Voltage DC Contactors Segmentation
-
1. Application
- 1.1. Electric Vehicle (EV)
- 1.2. Hybrid Electric Vehicle (HEV)
-
2. Types
- 2.1. Contact Voltage Up to 450 V
- 2.2. Contact Voltage Up to 750 V
- 2.3. Contact Voltage Up to 1000 V
- 2.4. Other
New Energy Vehicles High Voltage DC Contactors Segmentation By Geography
-
1. North America
- 1.1. United States
- 1.2. Canada
- 1.3. Mexico
-
2. South America
- 2.1. Brazil
- 2.2. Argentina
- 2.3. Rest of South America
-
3. Europe
- 3.1. United Kingdom
- 3.2. Germany
- 3.3. France
- 3.4. Italy
- 3.5. Spain
- 3.6. Russia
- 3.7. Benelux
- 3.8. Nordics
- 3.9. Rest of Europe
-
4. Middle East & Africa
- 4.1. Turkey
- 4.2. Israel
- 4.3. GCC
- 4.4. North Africa
- 4.5. South Africa
- 4.6. Rest of Middle East & Africa
-
5. Asia Pacific
- 5.1. China
- 5.2. India
- 5.3. Japan
- 5.4. South Korea
- 5.5. ASEAN
- 5.6. Oceania
- 5.7. Rest of Asia Pacific
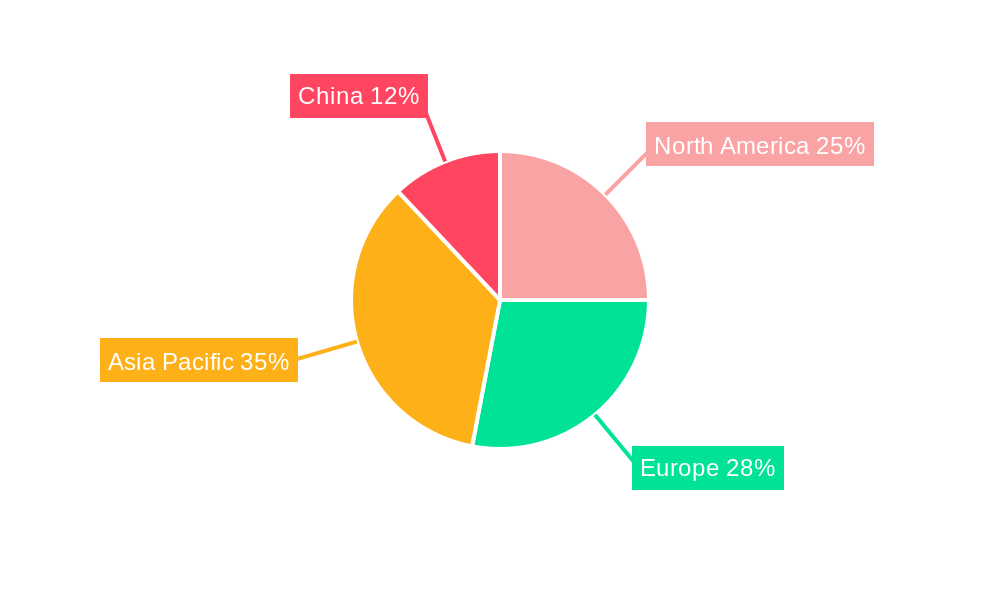
New Energy Vehicles High Voltage DC Contactors Regional Market Share
Geographic Coverage of New Energy Vehicles High Voltage DC Contactors
New Energy Vehicles High Voltage DC Contactors REPORT HIGHLIGHTS
| Aspects | Details |
|---|---|
| Study Period | 2020-2034 |
| Base Year | 2025 |
| Estimated Year | 2026 |
| Forecast Period | 2026-2034 |
| Historical Period | 2020-2025 |
| Growth Rate | CAGR of 11.78% from 2020-2034 |
| Segmentation |
|
Table of Contents
- 1. Introduction
- 1.1. Research Scope
- 1.2. Market Segmentation
- 1.3. Research Methodology
- 1.4. Definitions and Assumptions
- 2. Executive Summary
- 2.1. Introduction
- 3. Market Dynamics
- 3.1. Introduction
- 3.2. Market Drivers
- 3.3. Market Restrains
- 3.4. Market Trends
- 4. Market Factor Analysis
- 4.1. Porters Five Forces
- 4.2. Supply/Value Chain
- 4.3. PESTEL analysis
- 4.4. Market Entropy
- 4.5. Patent/Trademark Analysis
- 5. Global New Energy Vehicles High Voltage DC Contactors Analysis, Insights and Forecast, 2020-2032
- 5.1. Market Analysis, Insights and Forecast - by Application
- 5.1.1. Electric Vehicle (EV)
- 5.1.2. Hybrid Electric Vehicle (HEV)
- 5.2. Market Analysis, Insights and Forecast - by Types
- 5.2.1. Contact Voltage Up to 450 V
- 5.2.2. Contact Voltage Up to 750 V
- 5.2.3. Contact Voltage Up to 1000 V
- 5.2.4. Other
- 5.3. Market Analysis, Insights and Forecast - by Region
- 5.3.1. North America
- 5.3.2. South America
- 5.3.3. Europe
- 5.3.4. Middle East & Africa
- 5.3.5. Asia Pacific
- 5.1. Market Analysis, Insights and Forecast - by Application
- 6. North America New Energy Vehicles High Voltage DC Contactors Analysis, Insights and Forecast, 2020-2032
- 6.1. Market Analysis, Insights and Forecast - by Application
- 6.1.1. Electric Vehicle (EV)
- 6.1.2. Hybrid Electric Vehicle (HEV)
- 6.2. Market Analysis, Insights and Forecast - by Types
- 6.2.1. Contact Voltage Up to 450 V
- 6.2.2. Contact Voltage Up to 750 V
- 6.2.3. Contact Voltage Up to 1000 V
- 6.2.4. Other
- 6.1. Market Analysis, Insights and Forecast - by Application
- 7. South America New Energy Vehicles High Voltage DC Contactors Analysis, Insights and Forecast, 2020-2032
- 7.1. Market Analysis, Insights and Forecast - by Application
- 7.1.1. Electric Vehicle (EV)
- 7.1.2. Hybrid Electric Vehicle (HEV)
- 7.2. Market Analysis, Insights and Forecast - by Types
- 7.2.1. Contact Voltage Up to 450 V
- 7.2.2. Contact Voltage Up to 750 V
- 7.2.3. Contact Voltage Up to 1000 V
- 7.2.4. Other
- 7.1. Market Analysis, Insights and Forecast - by Application
- 8. Europe New Energy Vehicles High Voltage DC Contactors Analysis, Insights and Forecast, 2020-2032
- 8.1. Market Analysis, Insights and Forecast - by Application
- 8.1.1. Electric Vehicle (EV)
- 8.1.2. Hybrid Electric Vehicle (HEV)
- 8.2. Market Analysis, Insights and Forecast - by Types
- 8.2.1. Contact Voltage Up to 450 V
- 8.2.2. Contact Voltage Up to 750 V
- 8.2.3. Contact Voltage Up to 1000 V
- 8.2.4. Other
- 8.1. Market Analysis, Insights and Forecast - by Application
- 9. Middle East & Africa New Energy Vehicles High Voltage DC Contactors Analysis, Insights and Forecast, 2020-2032
- 9.1. Market Analysis, Insights and Forecast - by Application
- 9.1.1. Electric Vehicle (EV)
- 9.1.2. Hybrid Electric Vehicle (HEV)
- 9.2. Market Analysis, Insights and Forecast - by Types
- 9.2.1. Contact Voltage Up to 450 V
- 9.2.2. Contact Voltage Up to 750 V
- 9.2.3. Contact Voltage Up to 1000 V
- 9.2.4. Other
- 9.1. Market Analysis, Insights and Forecast - by Application
- 10. Asia Pacific New Energy Vehicles High Voltage DC Contactors Analysis, Insights and Forecast, 2020-2032
- 10.1. Market Analysis, Insights and Forecast - by Application
- 10.1.1. Electric Vehicle (EV)
- 10.1.2. Hybrid Electric Vehicle (HEV)
- 10.2. Market Analysis, Insights and Forecast - by Types
- 10.2.1. Contact Voltage Up to 450 V
- 10.2.2. Contact Voltage Up to 750 V
- 10.2.3. Contact Voltage Up to 1000 V
- 10.2.4. Other
- 10.1. Market Analysis, Insights and Forecast - by Application
- 11. Competitive Analysis
- 11.1. Global Market Share Analysis 2025
- 11.2. Company Profiles
- 11.2.1 Schaltbau Group
- 11.2.1.1. Overview
- 11.2.1.2. Products
- 11.2.1.3. SWOT Analysis
- 11.2.1.4. Recent Developments
- 11.2.1.5. Financials (Based on Availability)
- 11.2.2 YueQing Nanfeng Electric
- 11.2.2.1. Overview
- 11.2.2.2. Products
- 11.2.2.3. SWOT Analysis
- 11.2.2.4. Recent Developments
- 11.2.2.5. Financials (Based on Availability)
- 11.2.3 TE Connectivity
- 11.2.3.1. Overview
- 11.2.3.2. Products
- 11.2.3.3. SWOT Analysis
- 11.2.3.4. Recent Developments
- 11.2.3.5. Financials (Based on Availability)
- 11.2.4 Panasonic
- 11.2.4.1. Overview
- 11.2.4.2. Products
- 11.2.4.3. SWOT Analysis
- 11.2.4.4. Recent Developments
- 11.2.4.5. Financials (Based on Availability)
- 11.2.5 LS
- 11.2.5.1. Overview
- 11.2.5.2. Products
- 11.2.5.3. SWOT Analysis
- 11.2.5.4. Recent Developments
- 11.2.5.5. Financials (Based on Availability)
- 11.2.6 GuoLi (GLVAC)
- 11.2.6.1. Overview
- 11.2.6.2. Products
- 11.2.6.3. SWOT Analysis
- 11.2.6.4. Recent Developments
- 11.2.6.5. Financials (Based on Availability)
- 11.2.7 Albright International
- 11.2.7.1. Overview
- 11.2.7.2. Products
- 11.2.7.3. SWOT Analysis
- 11.2.7.4. Recent Developments
- 11.2.7.5. Financials (Based on Availability)
- 11.2.8 HONGFA Group
- 11.2.8.1. Overview
- 11.2.8.2. Products
- 11.2.8.3. SWOT Analysis
- 11.2.8.4. Recent Developments
- 11.2.8.5. Financials (Based on Availability)
- 11.2.9 Littelfuse
- 11.2.9.1. Overview
- 11.2.9.2. Products
- 11.2.9.3. SWOT Analysis
- 11.2.9.4. Recent Developments
- 11.2.9.5. Financials (Based on Availability)
- 11.2.10 TDK
- 11.2.10.1. Overview
- 11.2.10.2. Products
- 11.2.10.3. SWOT Analysis
- 11.2.10.4. Recent Developments
- 11.2.10.5. Financials (Based on Availability)
- 11.2.11 Hotson International
- 11.2.11.1. Overview
- 11.2.11.2. Products
- 11.2.11.3. SWOT Analysis
- 11.2.11.4. Recent Developments
- 11.2.11.5. Financials (Based on Availability)
- 11.2.12 ETA
- 11.2.12.1. Overview
- 11.2.12.2. Products
- 11.2.12.3. SWOT Analysis
- 11.2.12.4. Recent Developments
- 11.2.12.5. Financials (Based on Availability)
- 11.2.13 Durakool
- 11.2.13.1. Overview
- 11.2.13.2. Products
- 11.2.13.3. SWOT Analysis
- 11.2.13.4. Recent Developments
- 11.2.13.5. Financials (Based on Availability)
- 11.2.14 OMRON Corporation
- 11.2.14.1. Overview
- 11.2.14.2. Products
- 11.2.14.3. SWOT Analysis
- 11.2.14.4. Recent Developments
- 11.2.14.5. Financials (Based on Availability)
- 11.2.15 BSB Electrical
- 11.2.15.1. Overview
- 11.2.15.2. Products
- 11.2.15.3. SWOT Analysis
- 11.2.15.4. Recent Developments
- 11.2.15.5. Financials (Based on Availability)
- 11.2.16 Zhejiang Zhongxin New Energy Technology
- 11.2.16.1. Overview
- 11.2.16.2. Products
- 11.2.16.3. SWOT Analysis
- 11.2.16.4. Recent Developments
- 11.2.16.5. Financials (Based on Availability)
- 11.2.17 Zhejiang DongYa Electronic
- 11.2.17.1. Overview
- 11.2.17.2. Products
- 11.2.17.3. SWOT Analysis
- 11.2.17.4. Recent Developments
- 11.2.17.5. Financials (Based on Availability)
- 11.2.1 Schaltbau Group
List of Figures
- Figure 1: Global New Energy Vehicles High Voltage DC Contactors Revenue Breakdown (billion, %) by Region 2025 & 2033
- Figure 2: Global New Energy Vehicles High Voltage DC Contactors Volume Breakdown (K, %) by Region 2025 & 2033
- Figure 3: North America New Energy Vehicles High Voltage DC Contactors Revenue (billion), by Application 2025 & 2033
- Figure 4: North America New Energy Vehicles High Voltage DC Contactors Volume (K), by Application 2025 & 2033
- Figure 5: North America New Energy Vehicles High Voltage DC Contactors Revenue Share (%), by Application 2025 & 2033
- Figure 6: North America New Energy Vehicles High Voltage DC Contactors Volume Share (%), by Application 2025 & 2033
- Figure 7: North America New Energy Vehicles High Voltage DC Contactors Revenue (billion), by Types 2025 & 2033
- Figure 8: North America New Energy Vehicles High Voltage DC Contactors Volume (K), by Types 2025 & 2033
- Figure 9: North America New Energy Vehicles High Voltage DC Contactors Revenue Share (%), by Types 2025 & 2033
- Figure 10: North America New Energy Vehicles High Voltage DC Contactors Volume Share (%), by Types 2025 & 2033
- Figure 11: North America New Energy Vehicles High Voltage DC Contactors Revenue (billion), by Country 2025 & 2033
- Figure 12: North America New Energy Vehicles High Voltage DC Contactors Volume (K), by Country 2025 & 2033
- Figure 13: North America New Energy Vehicles High Voltage DC Contactors Revenue Share (%), by Country 2025 & 2033
- Figure 14: North America New Energy Vehicles High Voltage DC Contactors Volume Share (%), by Country 2025 & 2033
- Figure 15: South America New Energy Vehicles High Voltage DC Contactors Revenue (billion), by Application 2025 & 2033
- Figure 16: South America New Energy Vehicles High Voltage DC Contactors Volume (K), by Application 2025 & 2033
- Figure 17: South America New Energy Vehicles High Voltage DC Contactors Revenue Share (%), by Application 2025 & 2033
- Figure 18: South America New Energy Vehicles High Voltage DC Contactors Volume Share (%), by Application 2025 & 2033
- Figure 19: South America New Energy Vehicles High Voltage DC Contactors Revenue (billion), by Types 2025 & 2033
- Figure 20: South America New Energy Vehicles High Voltage DC Contactors Volume (K), by Types 2025 & 2033
- Figure 21: South America New Energy Vehicles High Voltage DC Contactors Revenue Share (%), by Types 2025 & 2033
- Figure 22: South America New Energy Vehicles High Voltage DC Contactors Volume Share (%), by Types 2025 & 2033
- Figure 23: South America New Energy Vehicles High Voltage DC Contactors Revenue (billion), by Country 2025 & 2033
- Figure 24: South America New Energy Vehicles High Voltage DC Contactors Volume (K), by Country 2025 & 2033
- Figure 25: South America New Energy Vehicles High Voltage DC Contactors Revenue Share (%), by Country 2025 & 2033
- Figure 26: South America New Energy Vehicles High Voltage DC Contactors Volume Share (%), by Country 2025 & 2033
- Figure 27: Europe New Energy Vehicles High Voltage DC Contactors Revenue (billion), by Application 2025 & 2033
- Figure 28: Europe New Energy Vehicles High Voltage DC Contactors Volume (K), by Application 2025 & 2033
- Figure 29: Europe New Energy Vehicles High Voltage DC Contactors Revenue Share (%), by Application 2025 & 2033
- Figure 30: Europe New Energy Vehicles High Voltage DC Contactors Volume Share (%), by Application 2025 & 2033
- Figure 31: Europe New Energy Vehicles High Voltage DC Contactors Revenue (billion), by Types 2025 & 2033
- Figure 32: Europe New Energy Vehicles High Voltage DC Contactors Volume (K), by Types 2025 & 2033
- Figure 33: Europe New Energy Vehicles High Voltage DC Contactors Revenue Share (%), by Types 2025 & 2033
- Figure 34: Europe New Energy Vehicles High Voltage DC Contactors Volume Share (%), by Types 2025 & 2033
- Figure 35: Europe New Energy Vehicles High Voltage DC Contactors Revenue (billion), by Country 2025 & 2033
- Figure 36: Europe New Energy Vehicles High Voltage DC Contactors Volume (K), by Country 2025 & 2033
- Figure 37: Europe New Energy Vehicles High Voltage DC Contactors Revenue Share (%), by Country 2025 & 2033
- Figure 38: Europe New Energy Vehicles High Voltage DC Contactors Volume Share (%), by Country 2025 & 2033
- Figure 39: Middle East & Africa New Energy Vehicles High Voltage DC Contactors Revenue (billion), by Application 2025 & 2033
- Figure 40: Middle East & Africa New Energy Vehicles High Voltage DC Contactors Volume (K), by Application 2025 & 2033
- Figure 41: Middle East & Africa New Energy Vehicles High Voltage DC Contactors Revenue Share (%), by Application 2025 & 2033
- Figure 42: Middle East & Africa New Energy Vehicles High Voltage DC Contactors Volume Share (%), by Application 2025 & 2033
- Figure 43: Middle East & Africa New Energy Vehicles High Voltage DC Contactors Revenue (billion), by Types 2025 & 2033
- Figure 44: Middle East & Africa New Energy Vehicles High Voltage DC Contactors Volume (K), by Types 2025 & 2033
- Figure 45: Middle East & Africa New Energy Vehicles High Voltage DC Contactors Revenue Share (%), by Types 2025 & 2033
- Figure 46: Middle East & Africa New Energy Vehicles High Voltage DC Contactors Volume Share (%), by Types 2025 & 2033
- Figure 47: Middle East & Africa New Energy Vehicles High Voltage DC Contactors Revenue (billion), by Country 2025 & 2033
- Figure 48: Middle East & Africa New Energy Vehicles High Voltage DC Contactors Volume (K), by Country 2025 & 2033
- Figure 49: Middle East & Africa New Energy Vehicles High Voltage DC Contactors Revenue Share (%), by Country 2025 & 2033
- Figure 50: Middle East & Africa New Energy Vehicles High Voltage DC Contactors Volume Share (%), by Country 2025 & 2033
- Figure 51: Asia Pacific New Energy Vehicles High Voltage DC Contactors Revenue (billion), by Application 2025 & 2033
- Figure 52: Asia Pacific New Energy Vehicles High Voltage DC Contactors Volume (K), by Application 2025 & 2033
- Figure 53: Asia Pacific New Energy Vehicles High Voltage DC Contactors Revenue Share (%), by Application 2025 & 2033
- Figure 54: Asia Pacific New Energy Vehicles High Voltage DC Contactors Volume Share (%), by Application 2025 & 2033
- Figure 55: Asia Pacific New Energy Vehicles High Voltage DC Contactors Revenue (billion), by Types 2025 & 2033
- Figure 56: Asia Pacific New Energy Vehicles High Voltage DC Contactors Volume (K), by Types 2025 & 2033
- Figure 57: Asia Pacific New Energy Vehicles High Voltage DC Contactors Revenue Share (%), by Types 2025 & 2033
- Figure 58: Asia Pacific New Energy Vehicles High Voltage DC Contactors Volume Share (%), by Types 2025 & 2033
- Figure 59: Asia Pacific New Energy Vehicles High Voltage DC Contactors Revenue (billion), by Country 2025 & 2033
- Figure 60: Asia Pacific New Energy Vehicles High Voltage DC Contactors Volume (K), by Country 2025 & 2033
- Figure 61: Asia Pacific New Energy Vehicles High Voltage DC Contactors Revenue Share (%), by Country 2025 & 2033
- Figure 62: Asia Pacific New Energy Vehicles High Voltage DC Contactors Volume Share (%), by Country 2025 & 2033
List of Tables
- Table 1: Global New Energy Vehicles High Voltage DC Contactors Revenue billion Forecast, by Application 2020 & 2033
- Table 2: Global New Energy Vehicles High Voltage DC Contactors Volume K Forecast, by Application 2020 & 2033
- Table 3: Global New Energy Vehicles High Voltage DC Contactors Revenue billion Forecast, by Types 2020 & 2033
- Table 4: Global New Energy Vehicles High Voltage DC Contactors Volume K Forecast, by Types 2020 & 2033
- Table 5: Global New Energy Vehicles High Voltage DC Contactors Revenue billion Forecast, by Region 2020 & 2033
- Table 6: Global New Energy Vehicles High Voltage DC Contactors Volume K Forecast, by Region 2020 & 2033
- Table 7: Global New Energy Vehicles High Voltage DC Contactors Revenue billion Forecast, by Application 2020 & 2033
- Table 8: Global New Energy Vehicles High Voltage DC Contactors Volume K Forecast, by Application 2020 & 2033
- Table 9: Global New Energy Vehicles High Voltage DC Contactors Revenue billion Forecast, by Types 2020 & 2033
- Table 10: Global New Energy Vehicles High Voltage DC Contactors Volume K Forecast, by Types 2020 & 2033
- Table 11: Global New Energy Vehicles High Voltage DC Contactors Revenue billion Forecast, by Country 2020 & 2033
- Table 12: Global New Energy Vehicles High Voltage DC Contactors Volume K Forecast, by Country 2020 & 2033
- Table 13: United States New Energy Vehicles High Voltage DC Contactors Revenue (billion) Forecast, by Application 2020 & 2033
- Table 14: United States New Energy Vehicles High Voltage DC Contactors Volume (K) Forecast, by Application 2020 & 2033
- Table 15: Canada New Energy Vehicles High Voltage DC Contactors Revenue (billion) Forecast, by Application 2020 & 2033
- Table 16: Canada New Energy Vehicles High Voltage DC Contactors Volume (K) Forecast, by Application 2020 & 2033
- Table 17: Mexico New Energy Vehicles High Voltage DC Contactors Revenue (billion) Forecast, by Application 2020 & 2033
- Table 18: Mexico New Energy Vehicles High Voltage DC Contactors Volume (K) Forecast, by Application 2020 & 2033
- Table 19: Global New Energy Vehicles High Voltage DC Contactors Revenue billion Forecast, by Application 2020 & 2033
- Table 20: Global New Energy Vehicles High Voltage DC Contactors Volume K Forecast, by Application 2020 & 2033
- Table 21: Global New Energy Vehicles High Voltage DC Contactors Revenue billion Forecast, by Types 2020 & 2033
- Table 22: Global New Energy Vehicles High Voltage DC Contactors Volume K Forecast, by Types 2020 & 2033
- Table 23: Global New Energy Vehicles High Voltage DC Contactors Revenue billion Forecast, by Country 2020 & 2033
- Table 24: Global New Energy Vehicles High Voltage DC Contactors Volume K Forecast, by Country 2020 & 2033
- Table 25: Brazil New Energy Vehicles High Voltage DC Contactors Revenue (billion) Forecast, by Application 2020 & 2033
- Table 26: Brazil New Energy Vehicles High Voltage DC Contactors Volume (K) Forecast, by Application 2020 & 2033
- Table 27: Argentina New Energy Vehicles High Voltage DC Contactors Revenue (billion) Forecast, by Application 2020 & 2033
- Table 28: Argentina New Energy Vehicles High Voltage DC Contactors Volume (K) Forecast, by Application 2020 & 2033
- Table 29: Rest of South America New Energy Vehicles High Voltage DC Contactors Revenue (billion) Forecast, by Application 2020 & 2033
- Table 30: Rest of South America New Energy Vehicles High Voltage DC Contactors Volume (K) Forecast, by Application 2020 & 2033
- Table 31: Global New Energy Vehicles High Voltage DC Contactors Revenue billion Forecast, by Application 2020 & 2033
- Table 32: Global New Energy Vehicles High Voltage DC Contactors Volume K Forecast, by Application 2020 & 2033
- Table 33: Global New Energy Vehicles High Voltage DC Contactors Revenue billion Forecast, by Types 2020 & 2033
- Table 34: Global New Energy Vehicles High Voltage DC Contactors Volume K Forecast, by Types 2020 & 2033
- Table 35: Global New Energy Vehicles High Voltage DC Contactors Revenue billion Forecast, by Country 2020 & 2033
- Table 36: Global New Energy Vehicles High Voltage DC Contactors Volume K Forecast, by Country 2020 & 2033
- Table 37: United Kingdom New Energy Vehicles High Voltage DC Contactors Revenue (billion) Forecast, by Application 2020 & 2033
- Table 38: United Kingdom New Energy Vehicles High Voltage DC Contactors Volume (K) Forecast, by Application 2020 & 2033
- Table 39: Germany New Energy Vehicles High Voltage DC Contactors Revenue (billion) Forecast, by Application 2020 & 2033
- Table 40: Germany New Energy Vehicles High Voltage DC Contactors Volume (K) Forecast, by Application 2020 & 2033
- Table 41: France New Energy Vehicles High Voltage DC Contactors Revenue (billion) Forecast, by Application 2020 & 2033
- Table 42: France New Energy Vehicles High Voltage DC Contactors Volume (K) Forecast, by Application 2020 & 2033
- Table 43: Italy New Energy Vehicles High Voltage DC Contactors Revenue (billion) Forecast, by Application 2020 & 2033
- Table 44: Italy New Energy Vehicles High Voltage DC Contactors Volume (K) Forecast, by Application 2020 & 2033
- Table 45: Spain New Energy Vehicles High Voltage DC Contactors Revenue (billion) Forecast, by Application 2020 & 2033
- Table 46: Spain New Energy Vehicles High Voltage DC Contactors Volume (K) Forecast, by Application 2020 & 2033
- Table 47: Russia New Energy Vehicles High Voltage DC Contactors Revenue (billion) Forecast, by Application 2020 & 2033
- Table 48: Russia New Energy Vehicles High Voltage DC Contactors Volume (K) Forecast, by Application 2020 & 2033
- Table 49: Benelux New Energy Vehicles High Voltage DC Contactors Revenue (billion) Forecast, by Application 2020 & 2033
- Table 50: Benelux New Energy Vehicles High Voltage DC Contactors Volume (K) Forecast, by Application 2020 & 2033
- Table 51: Nordics New Energy Vehicles High Voltage DC Contactors Revenue (billion) Forecast, by Application 2020 & 2033
- Table 52: Nordics New Energy Vehicles High Voltage DC Contactors Volume (K) Forecast, by Application 2020 & 2033
- Table 53: Rest of Europe New Energy Vehicles High Voltage DC Contactors Revenue (billion) Forecast, by Application 2020 & 2033
- Table 54: Rest of Europe New Energy Vehicles High Voltage DC Contactors Volume (K) Forecast, by Application 2020 & 2033
- Table 55: Global New Energy Vehicles High Voltage DC Contactors Revenue billion Forecast, by Application 2020 & 2033
- Table 56: Global New Energy Vehicles High Voltage DC Contactors Volume K Forecast, by Application 2020 & 2033
- Table 57: Global New Energy Vehicles High Voltage DC Contactors Revenue billion Forecast, by Types 2020 & 2033
- Table 58: Global New Energy Vehicles High Voltage DC Contactors Volume K Forecast, by Types 2020 & 2033
- Table 59: Global New Energy Vehicles High Voltage DC Contactors Revenue billion Forecast, by Country 2020 & 2033
- Table 60: Global New Energy Vehicles High Voltage DC Contactors Volume K Forecast, by Country 2020 & 2033
- Table 61: Turkey New Energy Vehicles High Voltage DC Contactors Revenue (billion) Forecast, by Application 2020 & 2033
- Table 62: Turkey New Energy Vehicles High Voltage DC Contactors Volume (K) Forecast, by Application 2020 & 2033
- Table 63: Israel New Energy Vehicles High Voltage DC Contactors Revenue (billion) Forecast, by Application 2020 & 2033
- Table 64: Israel New Energy Vehicles High Voltage DC Contactors Volume (K) Forecast, by Application 2020 & 2033
- Table 65: GCC New Energy Vehicles High Voltage DC Contactors Revenue (billion) Forecast, by Application 2020 & 2033
- Table 66: GCC New Energy Vehicles High Voltage DC Contactors Volume (K) Forecast, by Application 2020 & 2033
- Table 67: North Africa New Energy Vehicles High Voltage DC Contactors Revenue (billion) Forecast, by Application 2020 & 2033
- Table 68: North Africa New Energy Vehicles High Voltage DC Contactors Volume (K) Forecast, by Application 2020 & 2033
- Table 69: South Africa New Energy Vehicles High Voltage DC Contactors Revenue (billion) Forecast, by Application 2020 & 2033
- Table 70: South Africa New Energy Vehicles High Voltage DC Contactors Volume (K) Forecast, by Application 2020 & 2033
- Table 71: Rest of Middle East & Africa New Energy Vehicles High Voltage DC Contactors Revenue (billion) Forecast, by Application 2020 & 2033
- Table 72: Rest of Middle East & Africa New Energy Vehicles High Voltage DC Contactors Volume (K) Forecast, by Application 2020 & 2033
- Table 73: Global New Energy Vehicles High Voltage DC Contactors Revenue billion Forecast, by Application 2020 & 2033
- Table 74: Global New Energy Vehicles High Voltage DC Contactors Volume K Forecast, by Application 2020 & 2033
- Table 75: Global New Energy Vehicles High Voltage DC Contactors Revenue billion Forecast, by Types 2020 & 2033
- Table 76: Global New Energy Vehicles High Voltage DC Contactors Volume K Forecast, by Types 2020 & 2033
- Table 77: Global New Energy Vehicles High Voltage DC Contactors Revenue billion Forecast, by Country 2020 & 2033
- Table 78: Global New Energy Vehicles High Voltage DC Contactors Volume K Forecast, by Country 2020 & 2033
- Table 79: China New Energy Vehicles High Voltage DC Contactors Revenue (billion) Forecast, by Application 2020 & 2033
- Table 80: China New Energy Vehicles High Voltage DC Contactors Volume (K) Forecast, by Application 2020 & 2033
- Table 81: India New Energy Vehicles High Voltage DC Contactors Revenue (billion) Forecast, by Application 2020 & 2033
- Table 82: India New Energy Vehicles High Voltage DC Contactors Volume (K) Forecast, by Application 2020 & 2033
- Table 83: Japan New Energy Vehicles High Voltage DC Contactors Revenue (billion) Forecast, by Application 2020 & 2033
- Table 84: Japan New Energy Vehicles High Voltage DC Contactors Volume (K) Forecast, by Application 2020 & 2033
- Table 85: South Korea New Energy Vehicles High Voltage DC Contactors Revenue (billion) Forecast, by Application 2020 & 2033
- Table 86: South Korea New Energy Vehicles High Voltage DC Contactors Volume (K) Forecast, by Application 2020 & 2033
- Table 87: ASEAN New Energy Vehicles High Voltage DC Contactors Revenue (billion) Forecast, by Application 2020 & 2033
- Table 88: ASEAN New Energy Vehicles High Voltage DC Contactors Volume (K) Forecast, by Application 2020 & 2033
- Table 89: Oceania New Energy Vehicles High Voltage DC Contactors Revenue (billion) Forecast, by Application 2020 & 2033
- Table 90: Oceania New Energy Vehicles High Voltage DC Contactors Volume (K) Forecast, by Application 2020 & 2033
- Table 91: Rest of Asia Pacific New Energy Vehicles High Voltage DC Contactors Revenue (billion) Forecast, by Application 2020 & 2033
- Table 92: Rest of Asia Pacific New Energy Vehicles High Voltage DC Contactors Volume (K) Forecast, by Application 2020 & 2033
Frequently Asked Questions
1. What is the projected Compound Annual Growth Rate (CAGR) of the New Energy Vehicles High Voltage DC Contactors?
The projected CAGR is approximately 11.78%.
2. Which companies are prominent players in the New Energy Vehicles High Voltage DC Contactors?
Key companies in the market include Schaltbau Group, YueQing Nanfeng Electric, TE Connectivity, Panasonic, LS, GuoLi (GLVAC), Albright International, HONGFA Group, Littelfuse, TDK, Hotson International, ETA, Durakool, OMRON Corporation, BSB Electrical, Zhejiang Zhongxin New Energy Technology, Zhejiang DongYa Electronic.
3. What are the main segments of the New Energy Vehicles High Voltage DC Contactors?
The market segments include Application, Types.
4. Can you provide details about the market size?
The market size is estimated to be USD 10.83 billion as of 2022.
5. What are some drivers contributing to market growth?
N/A
6. What are the notable trends driving market growth?
N/A
7. Are there any restraints impacting market growth?
N/A
8. Can you provide examples of recent developments in the market?
N/A
9. What pricing options are available for accessing the report?
Pricing options include single-user, multi-user, and enterprise licenses priced at USD 4350.00, USD 6525.00, and USD 8700.00 respectively.
10. Is the market size provided in terms of value or volume?
The market size is provided in terms of value, measured in billion and volume, measured in K.
11. Are there any specific market keywords associated with the report?
Yes, the market keyword associated with the report is "New Energy Vehicles High Voltage DC Contactors," which aids in identifying and referencing the specific market segment covered.
12. How do I determine which pricing option suits my needs best?
The pricing options vary based on user requirements and access needs. Individual users may opt for single-user licenses, while businesses requiring broader access may choose multi-user or enterprise licenses for cost-effective access to the report.
13. Are there any additional resources or data provided in the New Energy Vehicles High Voltage DC Contactors report?
While the report offers comprehensive insights, it's advisable to review the specific contents or supplementary materials provided to ascertain if additional resources or data are available.
14. How can I stay updated on further developments or reports in the New Energy Vehicles High Voltage DC Contactors?
To stay informed about further developments, trends, and reports in the New Energy Vehicles High Voltage DC Contactors, consider subscribing to industry newsletters, following relevant companies and organizations, or regularly checking reputable industry news sources and publications.
Methodology
Step 1 - Identification of Relevant Samples Size from Population Database


Step 2 - Approaches for Defining Global Market Size (Value, Volume* & Price*)

Note*: In applicable scenarios
Step 3 - Data Sources
Primary Research
- Web Analytics
- Survey Reports
- Research Institute
- Latest Research Reports
- Opinion Leaders
Secondary Research
- Annual Reports
- White Paper
- Latest Press Release
- Industry Association
- Paid Database
- Investor Presentations

Step 4 - Data Triangulation
Involves using different sources of information in order to increase the validity of a study
These sources are likely to be stakeholders in a program - participants, other researchers, program staff, other community members, and so on.
Then we put all data in single framework & apply various statistical tools to find out the dynamic on the market.
During the analysis stage, feedback from the stakeholder groups would be compared to determine areas of agreement as well as areas of divergence