

Key Insights
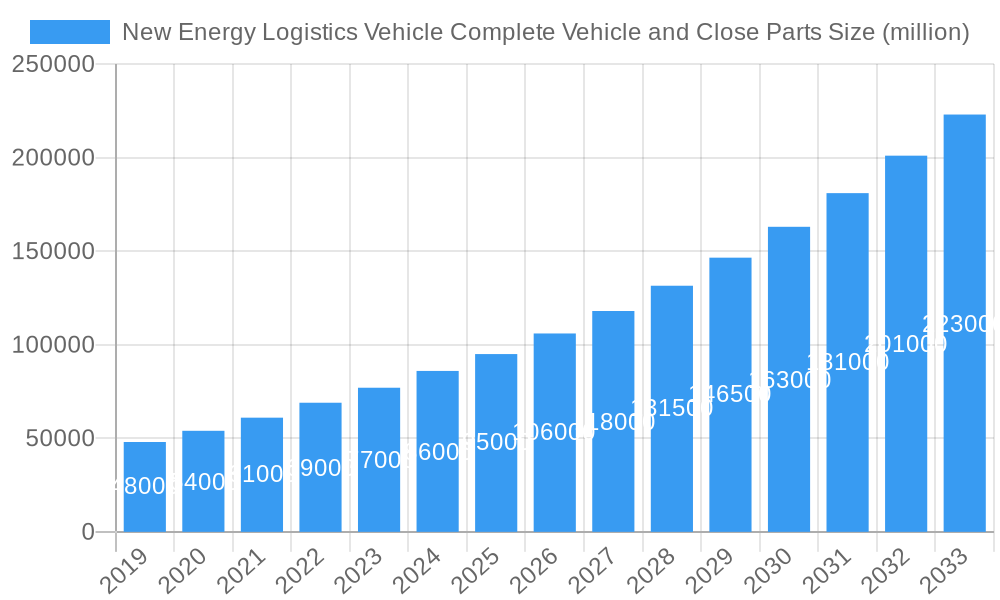
The global New Energy Logistics Vehicle market is set for substantial growth, projected to reach $71,975 million by 2025, with a CAGR of 8.5% through 2033. This expansion is driven by rising e-commerce, stricter environmental mandates, and government incentives for electric logistics. Growing demand for sustainable last-mile delivery and advancements in battery technology are key growth factors. China is expected to lead, with the Asia Pacific region as a major growth hub due to industrialization and logistics development.
New Energy Logistics Vehicle Complete Vehicle and Close Parts Market Size (In Billion)
The market is segmented by application, with Industry Logistics leading, followed by Social Logistics, as businesses focus on sustainability and cost reduction. Trucks will dominate vehicle types, crucial for freight transport, while Light Buses and Mini Vans will grow for urban and last-mile deliveries. Leading companies are investing in R&D for advanced electric logistics vehicles. While initial costs and charging infrastructure remain challenges, innovation and policy support are driving sustained market expansion.
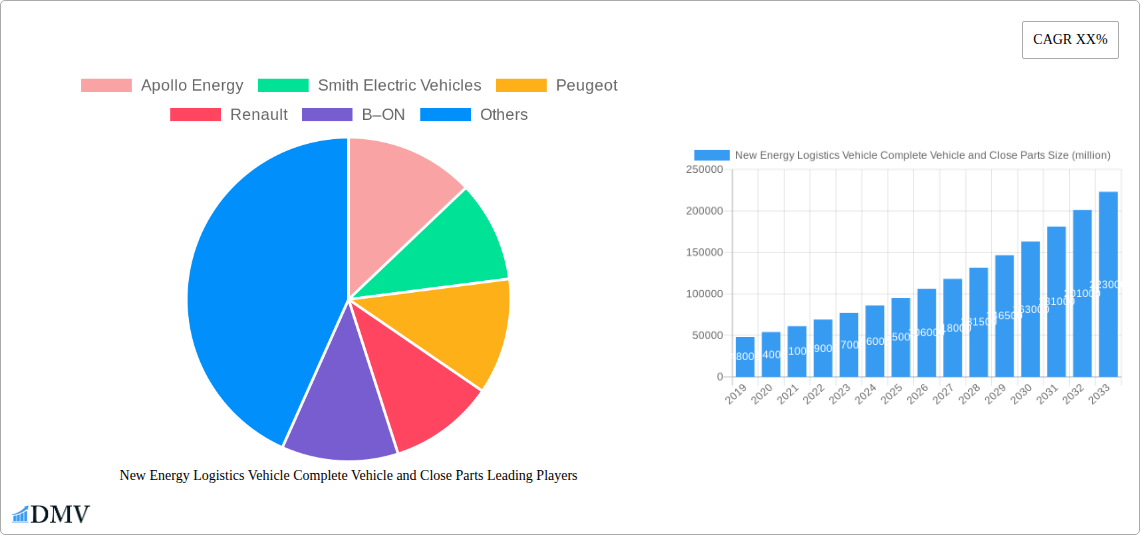
New Energy Logistics Vehicle Complete Vehicle and Close Parts Company Market Share
New Energy Logistics Vehicle Complete Vehicle and Close Parts Market Composition & Trends
The New Energy Logistics Vehicle (NELV) Complete Vehicle and Close Parts market is experiencing a dynamic shift, driven by increasing environmental consciousness and evolving regulatory landscapes. Market concentration is gradually decentralizing as new players emerge, challenging established automotive giants. Innovation catalysts are primarily focused on battery technology, charging infrastructure, and vehicle efficiency, with ongoing research and development (R&D) investments from key stakeholders. Regulatory landscapes globally are becoming more stringent regarding emissions, propelling the adoption of NELVs. Substitute products, primarily traditional internal combustion engine (ICE) logistics vehicles, are facing declining market share due to their environmental impact and higher operational costs.
End-user profiles are diverse, encompassing:
- Social Logistics: E-commerce delivery services, last-mile delivery providers.
- Industry Logistics: Manufacturing, warehousing, and distribution operations.
- Enterprise Logistics: Businesses requiring fleet replacements or expansions.
Mergers & Acquisitions (M&A) activities are on the rise, signaling consolidation and strategic partnerships within the ecosystem. For instance, recent M&A deal values are estimated to range from a few million to several hundred million dollars, as companies seek to gain market share and access new technologies. This trend indicates a maturing market where strategic integration is crucial for sustained growth. The market share distribution is projected to witness significant shifts, with electric trucks and light buses commanding a larger portion of the market by the forecast period.
New Energy Logistics Vehicle Complete Vehicle and Close Parts Industry Evolution
The New Energy Logistics Vehicle (NELV) Complete Vehicle and Close Parts industry is undergoing a profound transformation, characterized by robust market growth trajectories, rapid technological advancements, and significantly shifting consumer and business demands. From the historical period of 2019–2024, the industry has witnessed an exponential rise in interest and adoption, driven by a confluence of factors including governmental mandates, corporate sustainability goals, and the inherent operational cost savings offered by electric propulsion. The base year of 2025 serves as a pivotal point, with initial market penetration estimated at approximately 15% of the total commercial vehicle market, a figure expected to grow substantially.
Technological advancements have been a cornerstone of this evolution. Breakthroughs in battery energy density have led to extended range capabilities, addressing the "range anxiety" that previously hindered adoption. Charging infrastructure is rapidly expanding, with public and private investments creating a more supportive ecosystem for NELVs. The development of fast-charging solutions has further enhanced the practicality of electric trucks and vans for commercial operations. Furthermore, advancements in vehicle lightweighting, aerodynamic design, and intelligent powertrain management are contributing to improved energy efficiency and reduced operational expenses.
Shifting consumer and business demands are playing a crucial role. Businesses are increasingly recognizing the total cost of ownership (TCO) benefits of NELVs, including lower fuel and maintenance costs, as well as potential tax incentives and rebates. The growing emphasis on Corporate Social Responsibility (CSR) and Environmental, Social, and Governance (ESG) frameworks is compelling companies to transition their fleets to more sustainable options. E-commerce growth, a significant driver for social logistics, necessitates efficient and environmentally friendly last-mile delivery solutions, directly fueling demand for NELVs. The forecast period (2025–2033) anticipates a compound annual growth rate (CAGR) of approximately 20% for the NELV market. Adoption metrics are projected to reach over 50% of new commercial vehicle sales by 2033, indicating a strong and sustained growth trajectory.
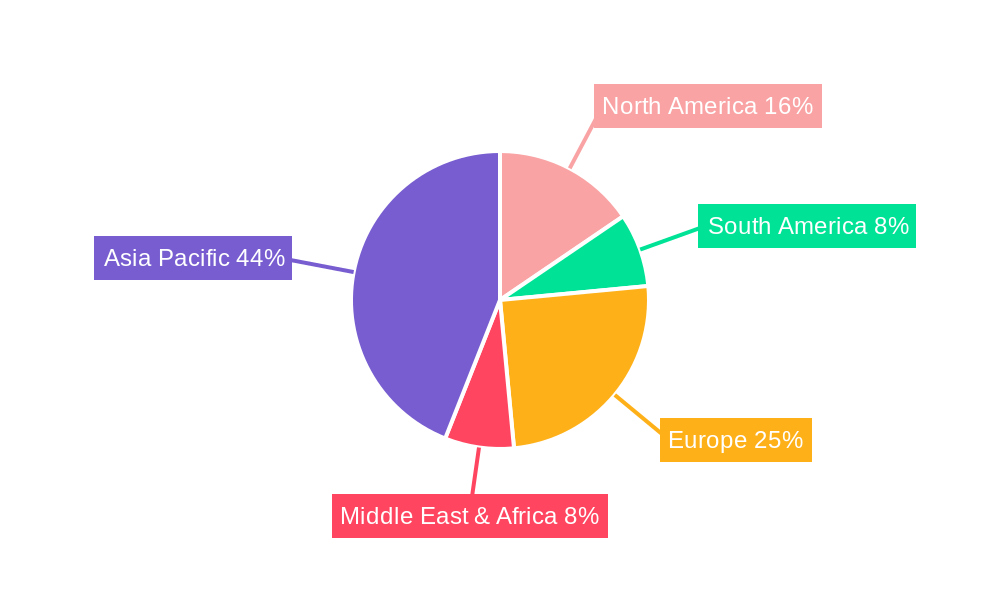
Leading Regions, Countries, or Segments in New Energy Logistics Vehicle Complete Vehicle and Close Parts
The New Energy Logistics Vehicle (NELV) Complete Vehicle and Close Parts market is currently dominated by Asia-Pacific, with China standing as the undisputed leader, driven by aggressive government support, a massive manufacturing base, and burgeoning domestic demand. This region's dominance is multifaceted, encompassing all segments and types of NELVs.
Dominance Factors in Asia-Pacific (China):
- Unwavering Government Support: China's proactive policies, including substantial subsidies, tax exemptions, and stringent emission standards for traditional vehicles, have created an exceptionally favorable environment for NELV adoption. These policies have spurred significant investment in R&D and manufacturing.
- Extensive Charging Infrastructure Development: China has made massive investments in building a nationwide charging network, significantly mitigating range anxiety and making NELVs a practical choice for logistics operations.
- Robust Manufacturing Ecosystem: The presence of major Chinese automotive manufacturers like Dongfeng Motor Corporation, SAIC-GM-Wuling Automobile, and Chery Automobile, alongside a sophisticated supply chain for batteries and components, provides a competitive edge.
- Surging E-commerce and Urban Logistics Demand: The immense scale of China's e-commerce sector generates continuous demand for efficient and sustainable last-mile delivery solutions, directly fueling the need for NELVs in Social Logistics.
Segment Dominance:
- Application: Social Logistics is currently the leading application segment within Asia-Pacific, driven by the massive growth of online retail and the increasing need for eco-friendly urban deliveries. Industry Logistics and Enterprise Logistics are also showing strong growth as businesses transition their fleets.
- Types: The Truck segment, particularly medium and heavy-duty trucks for inter-city logistics, is a significant contributor. However, the Mini Van segment is experiencing rapid expansion for urban last-mile deliveries due to its agility and lower operational costs. Light Buses are also gaining traction for passenger and specialized logistics needs.
Beyond China, North America and Europe are emerging as significant growth regions. In North America, the United States is leading the charge, influenced by corporate sustainability initiatives and improving battery technology. Europe benefits from supportive policies and a strong emphasis on environmental regulations, with countries like Germany and France showing high adoption rates.
The market share of Trucks in the NELV segment is projected to remain substantial throughout the forecast period, accounting for over 40% of the total market value. This is attributed to the increasing demand for electric heavy-duty trucks to decarbonize long-haul freight. The Mini Van segment is expected to witness the highest CAGR, driven by the expansion of last-mile delivery services and the increasing adoption of electric vans by logistics companies.
The combination of regulatory tailwinds, technological advancements in battery and powertrain systems, and the growing economic imperative to reduce operational costs makes Asia-Pacific, particularly China, the current and projected future leader in the New Energy Logistics Vehicle Complete Vehicle and Close Parts market.
New Energy Logistics Vehicle Complete Vehicle and Close Parts Product Innovations
Product innovations in the New Energy Logistics Vehicle (NELV) Complete Vehicle and Close Parts market are rapidly transforming the industry. Manufacturers are focusing on enhanced battery technology, offering higher energy density and faster charging capabilities to extend range and reduce downtime. Key advancements include solid-state battery research and development, promising greater safety and efficiency. We are also witnessing innovations in lightweight materials for vehicle construction, improving overall energy efficiency and payload capacity. Modular battery designs are emerging, allowing for easier maintenance and upgrades. Furthermore, intelligent fleet management systems, integrating real-time data analytics and route optimization, are enhancing operational efficiency and reducing costs for end-users. The development of autonomous driving capabilities within NELVs is also a significant innovation trend, particularly for long-haul trucking and warehouse operations.
Propelling Factors for New Energy Logistics Vehicle Complete Vehicle and Close Parts Growth
Several key factors are propelling the growth of the New Energy Logistics Vehicle (NELV) Complete Vehicle and Close Parts market.
- Technological Advancements: Significant improvements in battery technology, including increased energy density and faster charging times, are making NELVs more practical and competitive. Advancements in electric powertrains and regenerative braking systems further enhance efficiency.
- Governmental Policies and Incentives: Favorable regulations, subsidies, tax credits, and emission standards in many countries are directly encouraging the adoption of NELVs and discouraging traditional ICE vehicles.
- Growing Environmental Consciousness and ESG Commitments: Businesses are increasingly prioritizing sustainability and reducing their carbon footprint, making NELVs a crucial component of their corporate social responsibility strategies.
- Lower Total Cost of Ownership (TCO): Despite higher upfront costs, NELVs offer significant savings in fuel and maintenance over their lifecycle, making them economically attractive for logistics operations.
Obstacles in the New Energy Logistics Vehicle Complete Vehicle and Close Parts Market
Despite its promising growth, the New Energy Logistics Vehicle (NELV) Complete Vehicle and Close Parts market faces several obstacles.
- High Upfront Cost: The initial purchase price of NELVs remains a significant barrier for many small and medium-sized enterprises (SMEs).
- Inadequate Charging Infrastructure: While improving, the availability and accessibility of reliable charging infrastructure, especially in remote areas or for heavy-duty trucks, can still limit widespread adoption.
- Limited Model Availability and Payload Capacity: For certain specialized logistics needs, the range of available NELV models and their payload capacities may not yet meet all requirements.
- Battery Replacement Costs and Lifespan Concerns: The long-term cost and lifespan of batteries, along with potential replacement expenses, remain a concern for some operators.
- Supply Chain Volatility: Disruptions in the supply chain for critical components like semiconductors and battery materials can impact production and pricing.
Future Opportunities in New Energy Logistics Vehicle Complete Vehicle and Close Parts
Emerging opportunities in the New Energy Logistics Vehicle (NELV) Complete Vehicle and Close Parts market are abundant and poised for significant growth. The expansion of e-commerce and the increasing demand for efficient last-mile delivery solutions present a vast market for electric vans and mini-vans. The development of hydrogen fuel cell logistics vehicles offers an alternative for long-haul applications, addressing range and refueling time concerns. Furthermore, the integration of advanced telematics and AI-powered fleet management solutions creates opportunities for optimized operations and predictive maintenance. Growing investments in battery recycling and second-life applications for used batteries also present a sustainable and economically viable avenue for future growth.
Major Players in the New Energy Logistics Vehicle Complete Vehicle and Close Parts Ecosystem
Apollo Energy Smith Electric Vehicles Peugeot Renault B–ON Alke Altigreen Etrio Volvo Dongfeng Motor Corporation Chongqing Ruichi Automobile Brilliance Shineray Chongqing AUTOMOBILE Shaanxi Tongjia Automobile Chery Automobile SAIC-GM-Wuling Automobile Geely Sichuan Commercial Vehicle Shanghai Shenlong Bus Guangdong Winnerway Holdings Corporation Chongqing Changan Automobile Shandong KAMA Automobile Jiangling Motors Beiqi Foton Motor SAIC Motor Corporation Zhengzhou Yutong FAW Jiefang Qingling Motors Nanjing Golden Dragon Bus Anhui Jianghuai Automobile
Key Developments in New Energy Logistics Vehicle Complete Vehicle and Close Parts Industry
- 2023 Q4: Introduction of new long-range electric truck models by Volvo, significantly increasing payload and range capabilities for heavy-duty logistics.
- 2024 Q1: SAIC Motor Corporation announces significant investment in battery technology research and development, focusing on faster charging and improved battery longevity.
- 2024 Q2: Dongfeng Motor Corporation launches a new series of electric mini-vans specifically designed for urban last-mile delivery, featuring enhanced maneuverability and lower operational costs.
- 2024 Q3: Smith Electric Vehicles partners with a major logistics provider to deploy a fleet of electric delivery vans, showcasing real-world operational efficiency and cost savings.
- 2024 Q4: Regulatory bodies in several European countries announce stricter emission standards, further incentivizing the adoption of New Energy Logistics Vehicles.
- 2025 Q1 (Projected): Anticipated release of solid-state battery prototypes by key component manufacturers, promising a breakthrough in safety and energy density for NELVs.
Strategic New Energy Logistics Vehicle Complete Vehicle and Close Parts Market Forecast
The New Energy Logistics Vehicle (NELV) Complete Vehicle and Close Parts market is poised for substantial growth, driven by a compelling combination of technological innovation and supportive regulatory frameworks. Future opportunities lie in the expanding urban logistics sector, the development of alternative fuel sources like hydrogen, and the integration of advanced digital solutions for fleet management. As battery technology matures and charging infrastructure proliferates, the economic viability of NELVs will continue to improve, making them the preferred choice for an increasing number of businesses seeking to optimize operational costs and meet sustainability targets. The forecast indicates a strong upward trajectory, with NELVs becoming an indispensable part of the global logistics ecosystem.
New Energy Logistics Vehicle Complete Vehicle and Close Parts Segmentation
-
1. Application
- 1.1. Social Logistics
- 1.2. Industry Logistics
- 1.3. Enterprise Logistics
- 1.4. Others
-
2. Types
- 2.1. Truck
- 2.2. Light Bus
- 2.3. Mini Van
- 2.4. Others
New Energy Logistics Vehicle Complete Vehicle and Close Parts Segmentation By Geography
-
1. North America
- 1.1. United States
- 1.2. Canada
- 1.3. Mexico
-
2. South America
- 2.1. Brazil
- 2.2. Argentina
- 2.3. Rest of South America
-
3. Europe
- 3.1. United Kingdom
- 3.2. Germany
- 3.3. France
- 3.4. Italy
- 3.5. Spain
- 3.6. Russia
- 3.7. Benelux
- 3.8. Nordics
- 3.9. Rest of Europe
-
4. Middle East & Africa
- 4.1. Turkey
- 4.2. Israel
- 4.3. GCC
- 4.4. North Africa
- 4.5. South Africa
- 4.6. Rest of Middle East & Africa
-
5. Asia Pacific
- 5.1. China
- 5.2. India
- 5.3. Japan
- 5.4. South Korea
- 5.5. ASEAN
- 5.6. Oceania
- 5.7. Rest of Asia Pacific
New Energy Logistics Vehicle Complete Vehicle and Close Parts Regional Market Share
Geographic Coverage of New Energy Logistics Vehicle Complete Vehicle and Close Parts
New Energy Logistics Vehicle Complete Vehicle and Close Parts REPORT HIGHLIGHTS
| Aspects | Details |
|---|---|
| Study Period | 2020-2034 |
| Base Year | 2025 |
| Estimated Year | 2026 |
| Forecast Period | 2026-2034 |
| Historical Period | 2020-2025 |
| Growth Rate | CAGR of 8.5% from 2020-2034 |
| Segmentation |
|
Table of Contents
- 1. Introduction
- 1.1. Research Scope
- 1.2. Market Segmentation
- 1.3. Research Methodology
- 1.4. Definitions and Assumptions
- 2. Executive Summary
- 2.1. Introduction
- 3. Market Dynamics
- 3.1. Introduction
- 3.2. Market Drivers
- 3.3. Market Restrains
- 3.4. Market Trends
- 4. Market Factor Analysis
- 4.1. Porters Five Forces
- 4.2. Supply/Value Chain
- 4.3. PESTEL analysis
- 4.4. Market Entropy
- 4.5. Patent/Trademark Analysis
- 5. Global New Energy Logistics Vehicle Complete Vehicle and Close Parts Analysis, Insights and Forecast, 2020-2032
- 5.1. Market Analysis, Insights and Forecast - by Application
- 5.1.1. Social Logistics
- 5.1.2. Industry Logistics
- 5.1.3. Enterprise Logistics
- 5.1.4. Others
- 5.2. Market Analysis, Insights and Forecast - by Types
- 5.2.1. Truck
- 5.2.2. Light Bus
- 5.2.3. Mini Van
- 5.2.4. Others
- 5.3. Market Analysis, Insights and Forecast - by Region
- 5.3.1. North America
- 5.3.2. South America
- 5.3.3. Europe
- 5.3.4. Middle East & Africa
- 5.3.5. Asia Pacific
- 5.1. Market Analysis, Insights and Forecast - by Application
- 6. North America New Energy Logistics Vehicle Complete Vehicle and Close Parts Analysis, Insights and Forecast, 2020-2032
- 6.1. Market Analysis, Insights and Forecast - by Application
- 6.1.1. Social Logistics
- 6.1.2. Industry Logistics
- 6.1.3. Enterprise Logistics
- 6.1.4. Others
- 6.2. Market Analysis, Insights and Forecast - by Types
- 6.2.1. Truck
- 6.2.2. Light Bus
- 6.2.3. Mini Van
- 6.2.4. Others
- 6.1. Market Analysis, Insights and Forecast - by Application
- 7. South America New Energy Logistics Vehicle Complete Vehicle and Close Parts Analysis, Insights and Forecast, 2020-2032
- 7.1. Market Analysis, Insights and Forecast - by Application
- 7.1.1. Social Logistics
- 7.1.2. Industry Logistics
- 7.1.3. Enterprise Logistics
- 7.1.4. Others
- 7.2. Market Analysis, Insights and Forecast - by Types
- 7.2.1. Truck
- 7.2.2. Light Bus
- 7.2.3. Mini Van
- 7.2.4. Others
- 7.1. Market Analysis, Insights and Forecast - by Application
- 8. Europe New Energy Logistics Vehicle Complete Vehicle and Close Parts Analysis, Insights and Forecast, 2020-2032
- 8.1. Market Analysis, Insights and Forecast - by Application
- 8.1.1. Social Logistics
- 8.1.2. Industry Logistics
- 8.1.3. Enterprise Logistics
- 8.1.4. Others
- 8.2. Market Analysis, Insights and Forecast - by Types
- 8.2.1. Truck
- 8.2.2. Light Bus
- 8.2.3. Mini Van
- 8.2.4. Others
- 8.1. Market Analysis, Insights and Forecast - by Application
- 9. Middle East & Africa New Energy Logistics Vehicle Complete Vehicle and Close Parts Analysis, Insights and Forecast, 2020-2032
- 9.1. Market Analysis, Insights and Forecast - by Application
- 9.1.1. Social Logistics
- 9.1.2. Industry Logistics
- 9.1.3. Enterprise Logistics
- 9.1.4. Others
- 9.2. Market Analysis, Insights and Forecast - by Types
- 9.2.1. Truck
- 9.2.2. Light Bus
- 9.2.3. Mini Van
- 9.2.4. Others
- 9.1. Market Analysis, Insights and Forecast - by Application
- 10. Asia Pacific New Energy Logistics Vehicle Complete Vehicle and Close Parts Analysis, Insights and Forecast, 2020-2032
- 10.1. Market Analysis, Insights and Forecast - by Application
- 10.1.1. Social Logistics
- 10.1.2. Industry Logistics
- 10.1.3. Enterprise Logistics
- 10.1.4. Others
- 10.2. Market Analysis, Insights and Forecast - by Types
- 10.2.1. Truck
- 10.2.2. Light Bus
- 10.2.3. Mini Van
- 10.2.4. Others
- 10.1. Market Analysis, Insights and Forecast - by Application
- 11. Competitive Analysis
- 11.1. Global Market Share Analysis 2025
- 11.2. Company Profiles
- 11.2.1 Apollo Energy
- 11.2.1.1. Overview
- 11.2.1.2. Products
- 11.2.1.3. SWOT Analysis
- 11.2.1.4. Recent Developments
- 11.2.1.5. Financials (Based on Availability)
- 11.2.2 Smith Electric Vehicles
- 11.2.2.1. Overview
- 11.2.2.2. Products
- 11.2.2.3. SWOT Analysis
- 11.2.2.4. Recent Developments
- 11.2.2.5. Financials (Based on Availability)
- 11.2.3 Peugeot
- 11.2.3.1. Overview
- 11.2.3.2. Products
- 11.2.3.3. SWOT Analysis
- 11.2.3.4. Recent Developments
- 11.2.3.5. Financials (Based on Availability)
- 11.2.4 Renault
- 11.2.4.1. Overview
- 11.2.4.2. Products
- 11.2.4.3. SWOT Analysis
- 11.2.4.4. Recent Developments
- 11.2.4.5. Financials (Based on Availability)
- 11.2.5 B–ON
- 11.2.5.1. Overview
- 11.2.5.2. Products
- 11.2.5.3. SWOT Analysis
- 11.2.5.4. Recent Developments
- 11.2.5.5. Financials (Based on Availability)
- 11.2.6 Alke
- 11.2.6.1. Overview
- 11.2.6.2. Products
- 11.2.6.3. SWOT Analysis
- 11.2.6.4. Recent Developments
- 11.2.6.5. Financials (Based on Availability)
- 11.2.7 Altigreen
- 11.2.7.1. Overview
- 11.2.7.2. Products
- 11.2.7.3. SWOT Analysis
- 11.2.7.4. Recent Developments
- 11.2.7.5. Financials (Based on Availability)
- 11.2.8 Etrio
- 11.2.8.1. Overview
- 11.2.8.2. Products
- 11.2.8.3. SWOT Analysis
- 11.2.8.4. Recent Developments
- 11.2.8.5. Financials (Based on Availability)
- 11.2.9 Volvo
- 11.2.9.1. Overview
- 11.2.9.2. Products
- 11.2.9.3. SWOT Analysis
- 11.2.9.4. Recent Developments
- 11.2.9.5. Financials (Based on Availability)
- 11.2.10 Dongfeng Motor Corporation
- 11.2.10.1. Overview
- 11.2.10.2. Products
- 11.2.10.3. SWOT Analysis
- 11.2.10.4. Recent Developments
- 11.2.10.5. Financials (Based on Availability)
- 11.2.11 Chongqing Ruichi Automobile
- 11.2.11.1. Overview
- 11.2.11.2. Products
- 11.2.11.3. SWOT Analysis
- 11.2.11.4. Recent Developments
- 11.2.11.5. Financials (Based on Availability)
- 11.2.12 Brilliance Shineray Chongqing AUTOMOBILE
- 11.2.12.1. Overview
- 11.2.12.2. Products
- 11.2.12.3. SWOT Analysis
- 11.2.12.4. Recent Developments
- 11.2.12.5. Financials (Based on Availability)
- 11.2.13 Shaanxi Tongjia Automobile
- 11.2.13.1. Overview
- 11.2.13.2. Products
- 11.2.13.3. SWOT Analysis
- 11.2.13.4. Recent Developments
- 11.2.13.5. Financials (Based on Availability)
- 11.2.14 Chery Automobile
- 11.2.14.1. Overview
- 11.2.14.2. Products
- 11.2.14.3. SWOT Analysis
- 11.2.14.4. Recent Developments
- 11.2.14.5. Financials (Based on Availability)
- 11.2.15 SAIC-GM-Wuling Automobile
- 11.2.15.1. Overview
- 11.2.15.2. Products
- 11.2.15.3. SWOT Analysis
- 11.2.15.4. Recent Developments
- 11.2.15.5. Financials (Based on Availability)
- 11.2.16 Geely Sichuan Commercial Vehicle
- 11.2.16.1. Overview
- 11.2.16.2. Products
- 11.2.16.3. SWOT Analysis
- 11.2.16.4. Recent Developments
- 11.2.16.5. Financials (Based on Availability)
- 11.2.17 Shanghai Shenlong Bus
- 11.2.17.1. Overview
- 11.2.17.2. Products
- 11.2.17.3. SWOT Analysis
- 11.2.17.4. Recent Developments
- 11.2.17.5. Financials (Based on Availability)
- 11.2.18 Guangdong Winnerway Holdings Corporation
- 11.2.18.1. Overview
- 11.2.18.2. Products
- 11.2.18.3. SWOT Analysis
- 11.2.18.4. Recent Developments
- 11.2.18.5. Financials (Based on Availability)
- 11.2.19 Chongqing Changan Automobile
- 11.2.19.1. Overview
- 11.2.19.2. Products
- 11.2.19.3. SWOT Analysis
- 11.2.19.4. Recent Developments
- 11.2.19.5. Financials (Based on Availability)
- 11.2.20 Shandong KAMA Automobile
- 11.2.20.1. Overview
- 11.2.20.2. Products
- 11.2.20.3. SWOT Analysis
- 11.2.20.4. Recent Developments
- 11.2.20.5. Financials (Based on Availability)
- 11.2.21 Jiangling Motors
- 11.2.21.1. Overview
- 11.2.21.2. Products
- 11.2.21.3. SWOT Analysis
- 11.2.21.4. Recent Developments
- 11.2.21.5. Financials (Based on Availability)
- 11.2.22 Beiqi Foton Motor
- 11.2.22.1. Overview
- 11.2.22.2. Products
- 11.2.22.3. SWOT Analysis
- 11.2.22.4. Recent Developments
- 11.2.22.5. Financials (Based on Availability)
- 11.2.23 SAIC Motor Corporation
- 11.2.23.1. Overview
- 11.2.23.2. Products
- 11.2.23.3. SWOT Analysis
- 11.2.23.4. Recent Developments
- 11.2.23.5. Financials (Based on Availability)
- 11.2.24 Zhengzhou Yutong
- 11.2.24.1. Overview
- 11.2.24.2. Products
- 11.2.24.3. SWOT Analysis
- 11.2.24.4. Recent Developments
- 11.2.24.5. Financials (Based on Availability)
- 11.2.25 FAW Jiefang
- 11.2.25.1. Overview
- 11.2.25.2. Products
- 11.2.25.3. SWOT Analysis
- 11.2.25.4. Recent Developments
- 11.2.25.5. Financials (Based on Availability)
- 11.2.26 Qingling Motors
- 11.2.26.1. Overview
- 11.2.26.2. Products
- 11.2.26.3. SWOT Analysis
- 11.2.26.4. Recent Developments
- 11.2.26.5. Financials (Based on Availability)
- 11.2.27 Nanjing Golden Dragon Bus
- 11.2.27.1. Overview
- 11.2.27.2. Products
- 11.2.27.3. SWOT Analysis
- 11.2.27.4. Recent Developments
- 11.2.27.5. Financials (Based on Availability)
- 11.2.28 Anhui Jianghuai Automobile
- 11.2.28.1. Overview
- 11.2.28.2. Products
- 11.2.28.3. SWOT Analysis
- 11.2.28.4. Recent Developments
- 11.2.28.5. Financials (Based on Availability)
- 11.2.1 Apollo Energy
List of Figures
- Figure 1: Global New Energy Logistics Vehicle Complete Vehicle and Close Parts Revenue Breakdown (million, %) by Region 2025 & 2033
- Figure 2: North America New Energy Logistics Vehicle Complete Vehicle and Close Parts Revenue (million), by Application 2025 & 2033
- Figure 3: North America New Energy Logistics Vehicle Complete Vehicle and Close Parts Revenue Share (%), by Application 2025 & 2033
- Figure 4: North America New Energy Logistics Vehicle Complete Vehicle and Close Parts Revenue (million), by Types 2025 & 2033
- Figure 5: North America New Energy Logistics Vehicle Complete Vehicle and Close Parts Revenue Share (%), by Types 2025 & 2033
- Figure 6: North America New Energy Logistics Vehicle Complete Vehicle and Close Parts Revenue (million), by Country 2025 & 2033
- Figure 7: North America New Energy Logistics Vehicle Complete Vehicle and Close Parts Revenue Share (%), by Country 2025 & 2033
- Figure 8: South America New Energy Logistics Vehicle Complete Vehicle and Close Parts Revenue (million), by Application 2025 & 2033
- Figure 9: South America New Energy Logistics Vehicle Complete Vehicle and Close Parts Revenue Share (%), by Application 2025 & 2033
- Figure 10: South America New Energy Logistics Vehicle Complete Vehicle and Close Parts Revenue (million), by Types 2025 & 2033
- Figure 11: South America New Energy Logistics Vehicle Complete Vehicle and Close Parts Revenue Share (%), by Types 2025 & 2033
- Figure 12: South America New Energy Logistics Vehicle Complete Vehicle and Close Parts Revenue (million), by Country 2025 & 2033
- Figure 13: South America New Energy Logistics Vehicle Complete Vehicle and Close Parts Revenue Share (%), by Country 2025 & 2033
- Figure 14: Europe New Energy Logistics Vehicle Complete Vehicle and Close Parts Revenue (million), by Application 2025 & 2033
- Figure 15: Europe New Energy Logistics Vehicle Complete Vehicle and Close Parts Revenue Share (%), by Application 2025 & 2033
- Figure 16: Europe New Energy Logistics Vehicle Complete Vehicle and Close Parts Revenue (million), by Types 2025 & 2033
- Figure 17: Europe New Energy Logistics Vehicle Complete Vehicle and Close Parts Revenue Share (%), by Types 2025 & 2033
- Figure 18: Europe New Energy Logistics Vehicle Complete Vehicle and Close Parts Revenue (million), by Country 2025 & 2033
- Figure 19: Europe New Energy Logistics Vehicle Complete Vehicle and Close Parts Revenue Share (%), by Country 2025 & 2033
- Figure 20: Middle East & Africa New Energy Logistics Vehicle Complete Vehicle and Close Parts Revenue (million), by Application 2025 & 2033
- Figure 21: Middle East & Africa New Energy Logistics Vehicle Complete Vehicle and Close Parts Revenue Share (%), by Application 2025 & 2033
- Figure 22: Middle East & Africa New Energy Logistics Vehicle Complete Vehicle and Close Parts Revenue (million), by Types 2025 & 2033
- Figure 23: Middle East & Africa New Energy Logistics Vehicle Complete Vehicle and Close Parts Revenue Share (%), by Types 2025 & 2033
- Figure 24: Middle East & Africa New Energy Logistics Vehicle Complete Vehicle and Close Parts Revenue (million), by Country 2025 & 2033
- Figure 25: Middle East & Africa New Energy Logistics Vehicle Complete Vehicle and Close Parts Revenue Share (%), by Country 2025 & 2033
- Figure 26: Asia Pacific New Energy Logistics Vehicle Complete Vehicle and Close Parts Revenue (million), by Application 2025 & 2033
- Figure 27: Asia Pacific New Energy Logistics Vehicle Complete Vehicle and Close Parts Revenue Share (%), by Application 2025 & 2033
- Figure 28: Asia Pacific New Energy Logistics Vehicle Complete Vehicle and Close Parts Revenue (million), by Types 2025 & 2033
- Figure 29: Asia Pacific New Energy Logistics Vehicle Complete Vehicle and Close Parts Revenue Share (%), by Types 2025 & 2033
- Figure 30: Asia Pacific New Energy Logistics Vehicle Complete Vehicle and Close Parts Revenue (million), by Country 2025 & 2033
- Figure 31: Asia Pacific New Energy Logistics Vehicle Complete Vehicle and Close Parts Revenue Share (%), by Country 2025 & 2033
List of Tables
- Table 1: Global New Energy Logistics Vehicle Complete Vehicle and Close Parts Revenue million Forecast, by Application 2020 & 2033
- Table 2: Global New Energy Logistics Vehicle Complete Vehicle and Close Parts Revenue million Forecast, by Types 2020 & 2033
- Table 3: Global New Energy Logistics Vehicle Complete Vehicle and Close Parts Revenue million Forecast, by Region 2020 & 2033
- Table 4: Global New Energy Logistics Vehicle Complete Vehicle and Close Parts Revenue million Forecast, by Application 2020 & 2033
- Table 5: Global New Energy Logistics Vehicle Complete Vehicle and Close Parts Revenue million Forecast, by Types 2020 & 2033
- Table 6: Global New Energy Logistics Vehicle Complete Vehicle and Close Parts Revenue million Forecast, by Country 2020 & 2033
- Table 7: United States New Energy Logistics Vehicle Complete Vehicle and Close Parts Revenue (million) Forecast, by Application 2020 & 2033
- Table 8: Canada New Energy Logistics Vehicle Complete Vehicle and Close Parts Revenue (million) Forecast, by Application 2020 & 2033
- Table 9: Mexico New Energy Logistics Vehicle Complete Vehicle and Close Parts Revenue (million) Forecast, by Application 2020 & 2033
- Table 10: Global New Energy Logistics Vehicle Complete Vehicle and Close Parts Revenue million Forecast, by Application 2020 & 2033
- Table 11: Global New Energy Logistics Vehicle Complete Vehicle and Close Parts Revenue million Forecast, by Types 2020 & 2033
- Table 12: Global New Energy Logistics Vehicle Complete Vehicle and Close Parts Revenue million Forecast, by Country 2020 & 2033
- Table 13: Brazil New Energy Logistics Vehicle Complete Vehicle and Close Parts Revenue (million) Forecast, by Application 2020 & 2033
- Table 14: Argentina New Energy Logistics Vehicle Complete Vehicle and Close Parts Revenue (million) Forecast, by Application 2020 & 2033
- Table 15: Rest of South America New Energy Logistics Vehicle Complete Vehicle and Close Parts Revenue (million) Forecast, by Application 2020 & 2033
- Table 16: Global New Energy Logistics Vehicle Complete Vehicle and Close Parts Revenue million Forecast, by Application 2020 & 2033
- Table 17: Global New Energy Logistics Vehicle Complete Vehicle and Close Parts Revenue million Forecast, by Types 2020 & 2033
- Table 18: Global New Energy Logistics Vehicle Complete Vehicle and Close Parts Revenue million Forecast, by Country 2020 & 2033
- Table 19: United Kingdom New Energy Logistics Vehicle Complete Vehicle and Close Parts Revenue (million) Forecast, by Application 2020 & 2033
- Table 20: Germany New Energy Logistics Vehicle Complete Vehicle and Close Parts Revenue (million) Forecast, by Application 2020 & 2033
- Table 21: France New Energy Logistics Vehicle Complete Vehicle and Close Parts Revenue (million) Forecast, by Application 2020 & 2033
- Table 22: Italy New Energy Logistics Vehicle Complete Vehicle and Close Parts Revenue (million) Forecast, by Application 2020 & 2033
- Table 23: Spain New Energy Logistics Vehicle Complete Vehicle and Close Parts Revenue (million) Forecast, by Application 2020 & 2033
- Table 24: Russia New Energy Logistics Vehicle Complete Vehicle and Close Parts Revenue (million) Forecast, by Application 2020 & 2033
- Table 25: Benelux New Energy Logistics Vehicle Complete Vehicle and Close Parts Revenue (million) Forecast, by Application 2020 & 2033
- Table 26: Nordics New Energy Logistics Vehicle Complete Vehicle and Close Parts Revenue (million) Forecast, by Application 2020 & 2033
- Table 27: Rest of Europe New Energy Logistics Vehicle Complete Vehicle and Close Parts Revenue (million) Forecast, by Application 2020 & 2033
- Table 28: Global New Energy Logistics Vehicle Complete Vehicle and Close Parts Revenue million Forecast, by Application 2020 & 2033
- Table 29: Global New Energy Logistics Vehicle Complete Vehicle and Close Parts Revenue million Forecast, by Types 2020 & 2033
- Table 30: Global New Energy Logistics Vehicle Complete Vehicle and Close Parts Revenue million Forecast, by Country 2020 & 2033
- Table 31: Turkey New Energy Logistics Vehicle Complete Vehicle and Close Parts Revenue (million) Forecast, by Application 2020 & 2033
- Table 32: Israel New Energy Logistics Vehicle Complete Vehicle and Close Parts Revenue (million) Forecast, by Application 2020 & 2033
- Table 33: GCC New Energy Logistics Vehicle Complete Vehicle and Close Parts Revenue (million) Forecast, by Application 2020 & 2033
- Table 34: North Africa New Energy Logistics Vehicle Complete Vehicle and Close Parts Revenue (million) Forecast, by Application 2020 & 2033
- Table 35: South Africa New Energy Logistics Vehicle Complete Vehicle and Close Parts Revenue (million) Forecast, by Application 2020 & 2033
- Table 36: Rest of Middle East & Africa New Energy Logistics Vehicle Complete Vehicle and Close Parts Revenue (million) Forecast, by Application 2020 & 2033
- Table 37: Global New Energy Logistics Vehicle Complete Vehicle and Close Parts Revenue million Forecast, by Application 2020 & 2033
- Table 38: Global New Energy Logistics Vehicle Complete Vehicle and Close Parts Revenue million Forecast, by Types 2020 & 2033
- Table 39: Global New Energy Logistics Vehicle Complete Vehicle and Close Parts Revenue million Forecast, by Country 2020 & 2033
- Table 40: China New Energy Logistics Vehicle Complete Vehicle and Close Parts Revenue (million) Forecast, by Application 2020 & 2033
- Table 41: India New Energy Logistics Vehicle Complete Vehicle and Close Parts Revenue (million) Forecast, by Application 2020 & 2033
- Table 42: Japan New Energy Logistics Vehicle Complete Vehicle and Close Parts Revenue (million) Forecast, by Application 2020 & 2033
- Table 43: South Korea New Energy Logistics Vehicle Complete Vehicle and Close Parts Revenue (million) Forecast, by Application 2020 & 2033
- Table 44: ASEAN New Energy Logistics Vehicle Complete Vehicle and Close Parts Revenue (million) Forecast, by Application 2020 & 2033
- Table 45: Oceania New Energy Logistics Vehicle Complete Vehicle and Close Parts Revenue (million) Forecast, by Application 2020 & 2033
- Table 46: Rest of Asia Pacific New Energy Logistics Vehicle Complete Vehicle and Close Parts Revenue (million) Forecast, by Application 2020 & 2033
Frequently Asked Questions
1. What is the projected Compound Annual Growth Rate (CAGR) of the New Energy Logistics Vehicle Complete Vehicle and Close Parts?
The projected CAGR is approximately 8.5%.
2. Which companies are prominent players in the New Energy Logistics Vehicle Complete Vehicle and Close Parts?
Key companies in the market include Apollo Energy, Smith Electric Vehicles, Peugeot, Renault, B–ON, Alke, Altigreen, Etrio, Volvo, Dongfeng Motor Corporation, Chongqing Ruichi Automobile, Brilliance Shineray Chongqing AUTOMOBILE, Shaanxi Tongjia Automobile, Chery Automobile, SAIC-GM-Wuling Automobile, Geely Sichuan Commercial Vehicle, Shanghai Shenlong Bus, Guangdong Winnerway Holdings Corporation, Chongqing Changan Automobile, Shandong KAMA Automobile, Jiangling Motors, Beiqi Foton Motor, SAIC Motor Corporation, Zhengzhou Yutong, FAW Jiefang, Qingling Motors, Nanjing Golden Dragon Bus, Anhui Jianghuai Automobile.
3. What are the main segments of the New Energy Logistics Vehicle Complete Vehicle and Close Parts?
The market segments include Application, Types.
4. Can you provide details about the market size?
The market size is estimated to be USD 71975 million as of 2022.
5. What are some drivers contributing to market growth?
N/A
6. What are the notable trends driving market growth?
N/A
7. Are there any restraints impacting market growth?
N/A
8. Can you provide examples of recent developments in the market?
N/A
9. What pricing options are available for accessing the report?
Pricing options include single-user, multi-user, and enterprise licenses priced at USD 4900.00, USD 7350.00, and USD 9800.00 respectively.
10. Is the market size provided in terms of value or volume?
The market size is provided in terms of value, measured in million.
11. Are there any specific market keywords associated with the report?
Yes, the market keyword associated with the report is "New Energy Logistics Vehicle Complete Vehicle and Close Parts," which aids in identifying and referencing the specific market segment covered.
12. How do I determine which pricing option suits my needs best?
The pricing options vary based on user requirements and access needs. Individual users may opt for single-user licenses, while businesses requiring broader access may choose multi-user or enterprise licenses for cost-effective access to the report.
13. Are there any additional resources or data provided in the New Energy Logistics Vehicle Complete Vehicle and Close Parts report?
While the report offers comprehensive insights, it's advisable to review the specific contents or supplementary materials provided to ascertain if additional resources or data are available.
14. How can I stay updated on further developments or reports in the New Energy Logistics Vehicle Complete Vehicle and Close Parts?
To stay informed about further developments, trends, and reports in the New Energy Logistics Vehicle Complete Vehicle and Close Parts, consider subscribing to industry newsletters, following relevant companies and organizations, or regularly checking reputable industry news sources and publications.
Methodology
Step 1 - Identification of Relevant Samples Size from Population Database


Step 2 - Approaches for Defining Global Market Size (Value, Volume* & Price*)

Note*: In applicable scenarios
Step 3 - Data Sources
Primary Research
- Web Analytics
- Survey Reports
- Research Institute
- Latest Research Reports
- Opinion Leaders
Secondary Research
- Annual Reports
- White Paper
- Latest Press Release
- Industry Association
- Paid Database
- Investor Presentations

Step 4 - Data Triangulation
Involves using different sources of information in order to increase the validity of a study
These sources are likely to be stakeholders in a program - participants, other researchers, program staff, other community members, and so on.
Then we put all data in single framework & apply various statistical tools to find out the dynamic on the market.
During the analysis stage, feedback from the stakeholder groups would be compared to determine areas of agreement as well as areas of divergence