

Key Insights
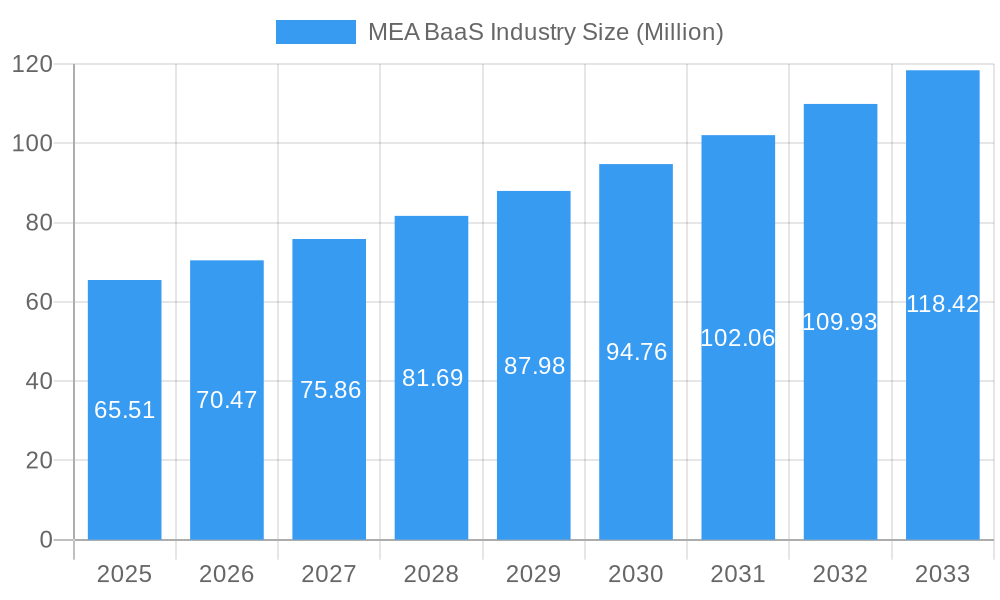
The Middle East and Africa (MEA) Banking-as-a-Service (BaaS) market exhibits robust growth potential, projected to reach $65.51 million in 2025, expanding at a Compound Annual Growth Rate (CAGR) of 7.40% from 2025 to 2033. This surge is driven by several factors. Firstly, the increasing adoption of digital financial services across the region, particularly among the burgeoning young population and underserved communities, fuels demand for flexible and scalable banking solutions. Secondly, the rise of fintech companies and their need for efficient and compliant banking infrastructure is a major catalyst. Thirdly, regulatory support and initiatives aimed at fostering innovation within the financial sector are creating a fertile ground for BaaS providers to thrive. The increasing mobile penetration and the rising adoption of digital payment systems further amplify this growth trajectory. Challenges include navigating varied regulatory landscapes across different MEA countries and ensuring robust cybersecurity measures to protect sensitive financial data.
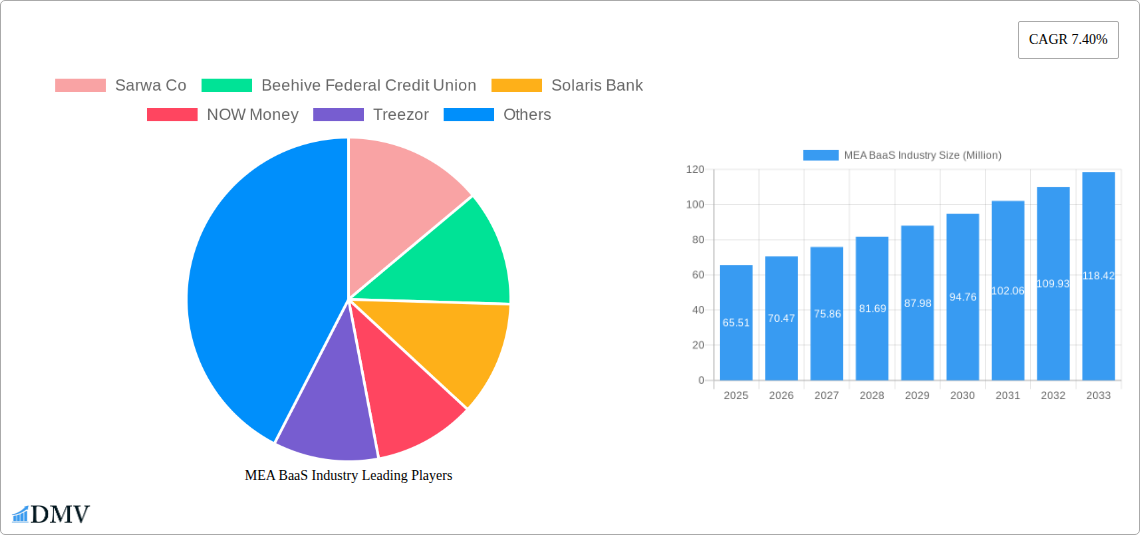
MEA BaaS Industry Market Size (In Million)
The MEA BaaS market is segmented by various factors including service type (payment processing, account management, lending), target customer (individuals, businesses, fintechs), and deployment model (cloud, on-premise). Key players like Sarwa Co, Beehive Federal Credit Union, Solaris Bank, NOW Money, Treezor, Telr, Mamo Pay, Felix, Jingle Pay, and Al Baraka Bank are actively shaping the competitive landscape, each leveraging its strengths to capture market share. Future growth will hinge on the ability of these companies to innovate with personalized offerings, enhance security protocols, and expand their reach into underserved markets within the MEA region. Strategic partnerships between traditional banks and fintechs are also likely to play a crucial role in driving market expansion. The forecast period, 2025-2033, is expected to witness significant consolidation and innovation, with the emergence of new business models and technological advancements within the MEA BaaS ecosystem.
MEA BaaS Industry Company Market Share
MEA BaaS Industry Market Report: 2019-2033
This comprehensive report provides an in-depth analysis of the Middle East and Africa (MEA) Banking-as-a-Service (BaaS) industry, offering invaluable insights for stakeholders seeking to navigate this rapidly evolving landscape. With a study period spanning 2019-2033, a base year of 2025, and an estimated year of 2025, this report forecasts market trends until 2033, leveraging data from the historical period (2019-2024). The MEA BaaS market is projected to reach xx Million by 2033, showcasing substantial growth potential.
MEA BaaS Industry Market Composition & Trends
This section analyzes the MEA BaaS market's competitive landscape, identifying key trends influencing its growth. We delve into market concentration, highlighting the market share distribution among major players. We examine innovation drivers, regulatory frameworks, substitute products, and end-user profiles, providing a 360-degree view of the market dynamics. Furthermore, we explore M&A activities, detailing significant deals and their impact on market consolidation. The total value of M&A deals in the MEA BaaS sector during the historical period reached approximately xx Million.
- Market Concentration: The MEA BaaS market exhibits a [Describe Concentration: e.g., moderately concentrated, fragmented] structure. Top 5 players hold approximately xx% of the market share.
- Innovation Catalysts: Open APIs, cloud computing, and fintech advancements are driving innovation.
- Regulatory Landscape: Varying regulatory frameworks across MEA countries influence market entry and operations.
- Substitute Products: Traditional banking services remain a key substitute, though BaaS offers enhanced flexibility.
- End-User Profiles: The primary end-users include fintech startups, traditional banks, and large enterprises.
- M&A Activities: The total value of M&A deals in the MEA BaaS sector during the historical period reached approximately xx Million.
MEA BaaS Industry Industry Evolution
This section traces the evolution of the MEA BaaS market, examining its growth trajectory, technological advancements, and shifting consumer demands. We present data points such as compound annual growth rates (CAGR) and adoption metrics. The MEA BaaS market experienced a CAGR of xx% during 2019-2024. Factors such as increasing digital adoption, regulatory support, and the rise of embedded finance are driving this growth. We also analyze the impact of technological advancements, such as AI and machine learning, on the industry. The increasing demand for personalized financial services and seamless customer experiences also plays a critical role. Furthermore, we explore the evolution of business models and the emergence of new market players.
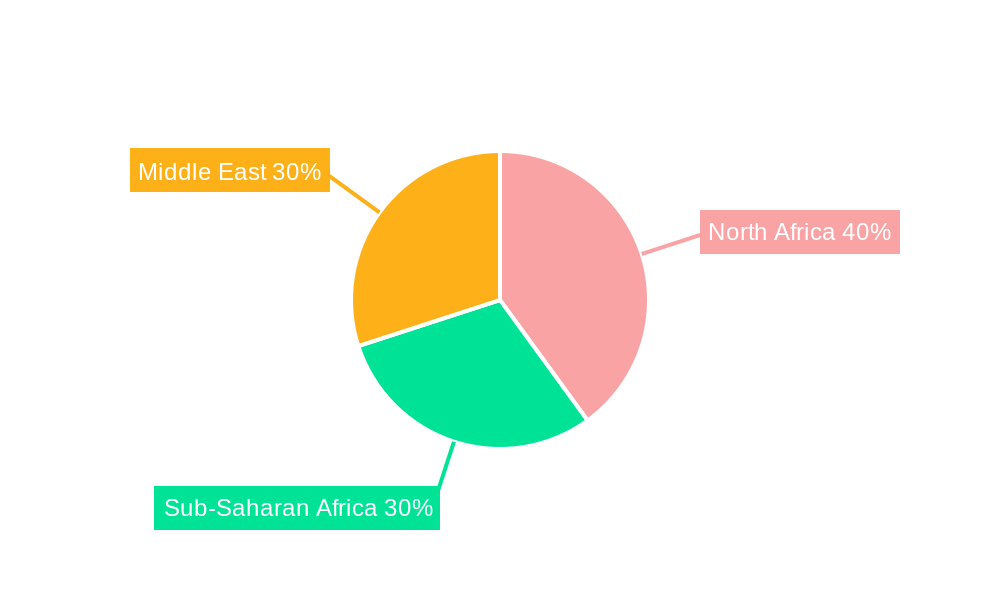
Leading Regions, Countries, or Segments in MEA BaaS Industry
This section identifies the dominant regions, countries, or segments within the MEA BaaS market. We analyze the factors driving their leadership, such as investment trends, regulatory support, and market maturity.
- UAE: The UAE is the leading market, driven by strong government support for digital transformation and a vibrant fintech ecosystem. Significant investments in digital infrastructure and supportive regulatory policies are key factors.
- Saudi Arabia: Saudi Arabia shows substantial potential, fueled by Vision 2030 initiatives promoting financial inclusion and digitalization. The growing adoption of mobile payments and online banking contributes to this growth.
- Key Segments: Embedded finance within e-commerce and the growth of SME-focused BaaS solutions are significant segments experiencing rapid expansion.
The detailed analysis explores the specific factors contributing to the dominance of these regions and segments.
MEA BaaS Industry Product Innovations
The MEA BaaS industry witnesses continuous product innovation, with new applications and enhanced features designed to improve efficiency, security, and user experience. Key developments include advanced APIs enabling seamless integration with various platforms, personalized financial products leveraging AI, and enhanced security features based on blockchain technology. These innovations are driven by the need to meet evolving customer demands and enhance competitive advantage.
Propelling Factors for MEA BaaS Industry Growth
Several factors propel the growth of the MEA BaaS market. These include the increasing adoption of digital technologies, supportive government policies promoting financial inclusion, and the rising demand for personalized financial services. The growing number of fintech startups and the increasing partnerships between traditional banks and fintech companies further contribute to this growth. The expanding reach of mobile penetration and internet access within the region further enhances the growth potential.
Obstacles in the MEA BaaS Industry Market
Despite the significant growth potential, the MEA BaaS market faces challenges. Regulatory uncertainties across different countries can create complexities for market entrants. Concerns related to data security and privacy necessitate robust cybersecurity measures. Competition from established players and the need to build trust and adoption among consumers also pose challenges. These factors impact market expansion and need careful consideration.
Future Opportunities in MEA BaaS Industry
The future of the MEA BaaS industry is promising, with several emerging opportunities. The expansion of BaaS solutions to underserved populations, the integration of innovative technologies like blockchain and AI, and the growth of embedded finance within various industries offer lucrative prospects. The development of new payment solutions catering to specific regional needs and the rise of open banking initiatives further present significant potential for market expansion.
Major Players in the MEA BaaS Industry Ecosystem
- Sarwa Co
- Beehive Federal Credit Union
- Solaris Bank
- NOW Money
- Treezor
- Telr
- Mamo Pay
- Felix
- Jingle Pay
- Al Baraka Bank (List Not Exhaustive)
Key Developments in MEA BaaS Industry Industry
- March 2022: Aazzur partnered with Treezor, a European BaaS firm, to expand its client base and BaaS offerings in the MEA region. This collaboration integrates Treezor's payment infrastructure with Aazzur's front-end solutions.
- September 2022: Wio Bank launched its "platform bank" in the UAE, offering apps, embedded finance, and BaaS services, aligning with the UAE's digital economy strategy.
Strategic MEA BaaS Industry Market Forecast
The MEA BaaS market is poised for significant growth driven by increasing digital adoption, supportive government initiatives, and the rise of embedded finance. The continued innovation in products and services, alongside strategic partnerships and mergers & acquisitions, will shape the market landscape. The expansion into new segments and geographies offers substantial potential for future expansion. This positive outlook positions the MEA BaaS market for continued substantial growth and development throughout the forecast period.
MEA BaaS Industry Segmentation
-
1. Type
- 1.1. API-based BaaS
- 1.2. Cloud based baaS
-
2. Service Type
- 2.1. Payment Process Services
- 2.2. Digital Banking Services
- 2.3. KYC Services
- 2.4. Customer Support Services
- 2.5. Others
-
3. Enterprises Size
- 3.1. Large Enterprises
- 3.2. Small & Medium Enterprises
MEA BaaS Industry Segmentation By Geography
-
1. North America
- 1.1. United States
- 1.2. Canada
- 1.3. Mexico
-
2. South America
- 2.1. Brazil
- 2.2. Argentina
- 2.3. Rest of South America
-
3. Europe
- 3.1. United Kingdom
- 3.2. Germany
- 3.3. France
- 3.4. Italy
- 3.5. Spain
- 3.6. Russia
- 3.7. Benelux
- 3.8. Nordics
- 3.9. Rest of Europe
-
4. Middle East & Africa
- 4.1. Turkey
- 4.2. Israel
- 4.3. GCC
- 4.4. North Africa
- 4.5. South Africa
- 4.6. Rest of Middle East & Africa
-
5. Asia Pacific
- 5.1. China
- 5.2. India
- 5.3. Japan
- 5.4. South Korea
- 5.5. ASEAN
- 5.6. Oceania
- 5.7. Rest of Asia Pacific
MEA BaaS Industry Regional Market Share
Geographic Coverage of MEA BaaS Industry
MEA BaaS Industry REPORT HIGHLIGHTS
| Aspects | Details |
|---|---|
| Study Period | 2020-2034 |
| Base Year | 2025 |
| Estimated Year | 2026 |
| Forecast Period | 2026-2034 |
| Historical Period | 2020-2025 |
| Growth Rate | CAGR of 7.40% from 2020-2034 |
| Segmentation |
|
Table of Contents
- 1. Introduction
- 1.1. Research Scope
- 1.2. Market Segmentation
- 1.3. Research Objective
- 1.4. Definitions and Assumptions
- 2. Executive Summary
- 2.1. Market Snapshot
- 3. Market Dynamics
- 3.1. Market Drivers
- 3.2. Market Restrains
- 3.3. Market Trends
- 3.4. Market Opportunities
- 4. Market Factor Analysis
- 4.1. Porters Five Forces
- 4.1.1. Bargaining Power of Suppliers
- 4.1.2. Bargaining Power of Buyers
- 4.1.3. Threat of New Entrants
- 4.1.4. Threat of Substitutes
- 4.1.5. Competitive Rivalry
- 4.2. PESTEL analysis
- 4.3. BCG Analysis
- 4.3.1. Stars (High Growth, High Market Share)
- 4.3.2. Cash Cows (Low Growth, High Market Share)
- 4.3.3. Question Mark (High Growth, Low Market Share)
- 4.3.4. Dogs (Low Growth, Low Market Share)
- 4.4. Ansoff Matrix Analysis
- 4.5. Supply Chain Analysis
- 4.6. Regulatory Landscape
- 4.7. Current Market Potential and Opportunity Assessment (TAM–SAM–SOM Framework)
- 4.8. DMV Analyst Note
- 4.1. Porters Five Forces
- 5. Market Analysis, Insights and Forecast 2021-2033
- 5.1. Market Analysis, Insights and Forecast - by Type
- 5.1.1. API-based BaaS
- 5.1.2. Cloud based baaS
- 5.2. Market Analysis, Insights and Forecast - by Service Type
- 5.2.1. Payment Process Services
- 5.2.2. Digital Banking Services
- 5.2.3. KYC Services
- 5.2.4. Customer Support Services
- 5.2.5. Others
- 5.3. Market Analysis, Insights and Forecast - by Enterprises Size
- 5.3.1. Large Enterprises
- 5.3.2. Small & Medium Enterprises
- 5.4. Market Analysis, Insights and Forecast - by Region
- 5.4.1. North America
- 5.4.2. South America
- 5.4.3. Europe
- 5.4.4. Middle East & Africa
- 5.4.5. Asia Pacific
- 5.1. Market Analysis, Insights and Forecast - by Type
- 6. Global MEA BaaS Industry Analysis, Insights and Forecast, 2021-2033
- 6.1. Market Analysis, Insights and Forecast - by Type
- 6.1.1. API-based BaaS
- 6.1.2. Cloud based baaS
- 6.2. Market Analysis, Insights and Forecast - by Service Type
- 6.2.1. Payment Process Services
- 6.2.2. Digital Banking Services
- 6.2.3. KYC Services
- 6.2.4. Customer Support Services
- 6.2.5. Others
- 6.3. Market Analysis, Insights and Forecast - by Enterprises Size
- 6.3.1. Large Enterprises
- 6.3.2. Small & Medium Enterprises
- 6.1. Market Analysis, Insights and Forecast - by Type
- 7. North America MEA BaaS Industry Analysis, Insights and Forecast, 2020-2032
- 7.1. Market Analysis, Insights and Forecast - by Type
- 7.1.1. API-based BaaS
- 7.1.2. Cloud based baaS
- 7.2. Market Analysis, Insights and Forecast - by Service Type
- 7.2.1. Payment Process Services
- 7.2.2. Digital Banking Services
- 7.2.3. KYC Services
- 7.2.4. Customer Support Services
- 7.2.5. Others
- 7.3. Market Analysis, Insights and Forecast - by Enterprises Size
- 7.3.1. Large Enterprises
- 7.3.2. Small & Medium Enterprises
- 7.1. Market Analysis, Insights and Forecast - by Type
- 8. South America MEA BaaS Industry Analysis, Insights and Forecast, 2020-2032
- 8.1. Market Analysis, Insights and Forecast - by Type
- 8.1.1. API-based BaaS
- 8.1.2. Cloud based baaS
- 8.2. Market Analysis, Insights and Forecast - by Service Type
- 8.2.1. Payment Process Services
- 8.2.2. Digital Banking Services
- 8.2.3. KYC Services
- 8.2.4. Customer Support Services
- 8.2.5. Others
- 8.3. Market Analysis, Insights and Forecast - by Enterprises Size
- 8.3.1. Large Enterprises
- 8.3.2. Small & Medium Enterprises
- 8.1. Market Analysis, Insights and Forecast - by Type
- 9. Europe MEA BaaS Industry Analysis, Insights and Forecast, 2020-2032
- 9.1. Market Analysis, Insights and Forecast - by Type
- 9.1.1. API-based BaaS
- 9.1.2. Cloud based baaS
- 9.2. Market Analysis, Insights and Forecast - by Service Type
- 9.2.1. Payment Process Services
- 9.2.2. Digital Banking Services
- 9.2.3. KYC Services
- 9.2.4. Customer Support Services
- 9.2.5. Others
- 9.3. Market Analysis, Insights and Forecast - by Enterprises Size
- 9.3.1. Large Enterprises
- 9.3.2. Small & Medium Enterprises
- 9.1. Market Analysis, Insights and Forecast - by Type
- 10. Middle East & Africa MEA BaaS Industry Analysis, Insights and Forecast, 2020-2032
- 10.1. Market Analysis, Insights and Forecast - by Type
- 10.1.1. API-based BaaS
- 10.1.2. Cloud based baaS
- 10.2. Market Analysis, Insights and Forecast - by Service Type
- 10.2.1. Payment Process Services
- 10.2.2. Digital Banking Services
- 10.2.3. KYC Services
- 10.2.4. Customer Support Services
- 10.2.5. Others
- 10.3. Market Analysis, Insights and Forecast - by Enterprises Size
- 10.3.1. Large Enterprises
- 10.3.2. Small & Medium Enterprises
- 10.1. Market Analysis, Insights and Forecast - by Type
- 11. Asia Pacific MEA BaaS Industry Analysis, Insights and Forecast, 2020-2032
- 11.1. Market Analysis, Insights and Forecast - by Type
- 11.1.1. API-based BaaS
- 11.1.2. Cloud based baaS
- 11.2. Market Analysis, Insights and Forecast - by Service Type
- 11.2.1. Payment Process Services
- 11.2.2. Digital Banking Services
- 11.2.3. KYC Services
- 11.2.4. Customer Support Services
- 11.2.5. Others
- 11.3. Market Analysis, Insights and Forecast - by Enterprises Size
- 11.3.1. Large Enterprises
- 11.3.2. Small & Medium Enterprises
- 11.1. Market Analysis, Insights and Forecast - by Type
- 12. Competitive Analysis
- 12.1. Company Profiles
- 12.1.1 Sarwa Co
- 12.1.1.1. Company Overview
- 12.1.1.2. Products
- 12.1.1.3. Company Financials
- 12.1.1.4. SWOT Analysis
- 12.1.2 Beehive Federal Credit Union
- 12.1.2.1. Company Overview
- 12.1.2.2. Products
- 12.1.2.3. Company Financials
- 12.1.2.4. SWOT Analysis
- 12.1.3 Solaris Bank
- 12.1.3.1. Company Overview
- 12.1.3.2. Products
- 12.1.3.3. Company Financials
- 12.1.3.4. SWOT Analysis
- 12.1.4 NOW Money
- 12.1.4.1. Company Overview
- 12.1.4.2. Products
- 12.1.4.3. Company Financials
- 12.1.4.4. SWOT Analysis
- 12.1.5 Treezor
- 12.1.5.1. Company Overview
- 12.1.5.2. Products
- 12.1.5.3. Company Financials
- 12.1.5.4. SWOT Analysis
- 12.1.6 Telr
- 12.1.6.1. Company Overview
- 12.1.6.2. Products
- 12.1.6.3. Company Financials
- 12.1.6.4. SWOT Analysis
- 12.1.7 Mamo Pay
- 12.1.7.1. Company Overview
- 12.1.7.2. Products
- 12.1.7.3. Company Financials
- 12.1.7.4. SWOT Analysis
- 12.1.8 Felix
- 12.1.8.1. Company Overview
- 12.1.8.2. Products
- 12.1.8.3. Company Financials
- 12.1.8.4. SWOT Analysis
- 12.1.9 Jingle Pay
- 12.1.9.1. Company Overview
- 12.1.9.2. Products
- 12.1.9.3. Company Financials
- 12.1.9.4. SWOT Analysis
- 12.1.10 Al Baraka Bank**List Not Exhaustive
- 12.1.10.1. Company Overview
- 12.1.10.2. Products
- 12.1.10.3. Company Financials
- 12.1.10.4. SWOT Analysis
- 12.1.1 Sarwa Co
- 12.2. Market Entropy
- 12.2.1 Company's Key Areas Served
- 12.2.2 Recent Developments
- 12.3. Company Market Share Analysis 2025
- 12.3.1 Top 5 Companies Market Share Analysis
- 12.3.2 Top 3 Companies Market Share Analysis
- 12.4. List of Potential Customers
- 13. Research Methodology
List of Figures
- Figure 1: Global MEA BaaS Industry Revenue Breakdown (Million, %) by Region 2025 & 2033
- Figure 2: Global MEA BaaS Industry Volume Breakdown (Billion, %) by Region 2025 & 2033
- Figure 3: North America MEA BaaS Industry Revenue (Million), by Type 2025 & 2033
- Figure 4: North America MEA BaaS Industry Volume (Billion), by Type 2025 & 2033
- Figure 5: North America MEA BaaS Industry Revenue Share (%), by Type 2025 & 2033
- Figure 6: North America MEA BaaS Industry Volume Share (%), by Type 2025 & 2033
- Figure 7: North America MEA BaaS Industry Revenue (Million), by Service Type 2025 & 2033
- Figure 8: North America MEA BaaS Industry Volume (Billion), by Service Type 2025 & 2033
- Figure 9: North America MEA BaaS Industry Revenue Share (%), by Service Type 2025 & 2033
- Figure 10: North America MEA BaaS Industry Volume Share (%), by Service Type 2025 & 2033
- Figure 11: North America MEA BaaS Industry Revenue (Million), by Enterprises Size 2025 & 2033
- Figure 12: North America MEA BaaS Industry Volume (Billion), by Enterprises Size 2025 & 2033
- Figure 13: North America MEA BaaS Industry Revenue Share (%), by Enterprises Size 2025 & 2033
- Figure 14: North America MEA BaaS Industry Volume Share (%), by Enterprises Size 2025 & 2033
- Figure 15: North America MEA BaaS Industry Revenue (Million), by Country 2025 & 2033
- Figure 16: North America MEA BaaS Industry Volume (Billion), by Country 2025 & 2033
- Figure 17: North America MEA BaaS Industry Revenue Share (%), by Country 2025 & 2033
- Figure 18: North America MEA BaaS Industry Volume Share (%), by Country 2025 & 2033
- Figure 19: South America MEA BaaS Industry Revenue (Million), by Type 2025 & 2033
- Figure 20: South America MEA BaaS Industry Volume (Billion), by Type 2025 & 2033
- Figure 21: South America MEA BaaS Industry Revenue Share (%), by Type 2025 & 2033
- Figure 22: South America MEA BaaS Industry Volume Share (%), by Type 2025 & 2033
- Figure 23: South America MEA BaaS Industry Revenue (Million), by Service Type 2025 & 2033
- Figure 24: South America MEA BaaS Industry Volume (Billion), by Service Type 2025 & 2033
- Figure 25: South America MEA BaaS Industry Revenue Share (%), by Service Type 2025 & 2033
- Figure 26: South America MEA BaaS Industry Volume Share (%), by Service Type 2025 & 2033
- Figure 27: South America MEA BaaS Industry Revenue (Million), by Enterprises Size 2025 & 2033
- Figure 28: South America MEA BaaS Industry Volume (Billion), by Enterprises Size 2025 & 2033
- Figure 29: South America MEA BaaS Industry Revenue Share (%), by Enterprises Size 2025 & 2033
- Figure 30: South America MEA BaaS Industry Volume Share (%), by Enterprises Size 2025 & 2033
- Figure 31: South America MEA BaaS Industry Revenue (Million), by Country 2025 & 2033
- Figure 32: South America MEA BaaS Industry Volume (Billion), by Country 2025 & 2033
- Figure 33: South America MEA BaaS Industry Revenue Share (%), by Country 2025 & 2033
- Figure 34: South America MEA BaaS Industry Volume Share (%), by Country 2025 & 2033
- Figure 35: Europe MEA BaaS Industry Revenue (Million), by Type 2025 & 2033
- Figure 36: Europe MEA BaaS Industry Volume (Billion), by Type 2025 & 2033
- Figure 37: Europe MEA BaaS Industry Revenue Share (%), by Type 2025 & 2033
- Figure 38: Europe MEA BaaS Industry Volume Share (%), by Type 2025 & 2033
- Figure 39: Europe MEA BaaS Industry Revenue (Million), by Service Type 2025 & 2033
- Figure 40: Europe MEA BaaS Industry Volume (Billion), by Service Type 2025 & 2033
- Figure 41: Europe MEA BaaS Industry Revenue Share (%), by Service Type 2025 & 2033
- Figure 42: Europe MEA BaaS Industry Volume Share (%), by Service Type 2025 & 2033
- Figure 43: Europe MEA BaaS Industry Revenue (Million), by Enterprises Size 2025 & 2033
- Figure 44: Europe MEA BaaS Industry Volume (Billion), by Enterprises Size 2025 & 2033
- Figure 45: Europe MEA BaaS Industry Revenue Share (%), by Enterprises Size 2025 & 2033
- Figure 46: Europe MEA BaaS Industry Volume Share (%), by Enterprises Size 2025 & 2033
- Figure 47: Europe MEA BaaS Industry Revenue (Million), by Country 2025 & 2033
- Figure 48: Europe MEA BaaS Industry Volume (Billion), by Country 2025 & 2033
- Figure 49: Europe MEA BaaS Industry Revenue Share (%), by Country 2025 & 2033
- Figure 50: Europe MEA BaaS Industry Volume Share (%), by Country 2025 & 2033
- Figure 51: Middle East & Africa MEA BaaS Industry Revenue (Million), by Type 2025 & 2033
- Figure 52: Middle East & Africa MEA BaaS Industry Volume (Billion), by Type 2025 & 2033
- Figure 53: Middle East & Africa MEA BaaS Industry Revenue Share (%), by Type 2025 & 2033
- Figure 54: Middle East & Africa MEA BaaS Industry Volume Share (%), by Type 2025 & 2033
- Figure 55: Middle East & Africa MEA BaaS Industry Revenue (Million), by Service Type 2025 & 2033
- Figure 56: Middle East & Africa MEA BaaS Industry Volume (Billion), by Service Type 2025 & 2033
- Figure 57: Middle East & Africa MEA BaaS Industry Revenue Share (%), by Service Type 2025 & 2033
- Figure 58: Middle East & Africa MEA BaaS Industry Volume Share (%), by Service Type 2025 & 2033
- Figure 59: Middle East & Africa MEA BaaS Industry Revenue (Million), by Enterprises Size 2025 & 2033
- Figure 60: Middle East & Africa MEA BaaS Industry Volume (Billion), by Enterprises Size 2025 & 2033
- Figure 61: Middle East & Africa MEA BaaS Industry Revenue Share (%), by Enterprises Size 2025 & 2033
- Figure 62: Middle East & Africa MEA BaaS Industry Volume Share (%), by Enterprises Size 2025 & 2033
- Figure 63: Middle East & Africa MEA BaaS Industry Revenue (Million), by Country 2025 & 2033
- Figure 64: Middle East & Africa MEA BaaS Industry Volume (Billion), by Country 2025 & 2033
- Figure 65: Middle East & Africa MEA BaaS Industry Revenue Share (%), by Country 2025 & 2033
- Figure 66: Middle East & Africa MEA BaaS Industry Volume Share (%), by Country 2025 & 2033
- Figure 67: Asia Pacific MEA BaaS Industry Revenue (Million), by Type 2025 & 2033
- Figure 68: Asia Pacific MEA BaaS Industry Volume (Billion), by Type 2025 & 2033
- Figure 69: Asia Pacific MEA BaaS Industry Revenue Share (%), by Type 2025 & 2033
- Figure 70: Asia Pacific MEA BaaS Industry Volume Share (%), by Type 2025 & 2033
- Figure 71: Asia Pacific MEA BaaS Industry Revenue (Million), by Service Type 2025 & 2033
- Figure 72: Asia Pacific MEA BaaS Industry Volume (Billion), by Service Type 2025 & 2033
- Figure 73: Asia Pacific MEA BaaS Industry Revenue Share (%), by Service Type 2025 & 2033
- Figure 74: Asia Pacific MEA BaaS Industry Volume Share (%), by Service Type 2025 & 2033
- Figure 75: Asia Pacific MEA BaaS Industry Revenue (Million), by Enterprises Size 2025 & 2033
- Figure 76: Asia Pacific MEA BaaS Industry Volume (Billion), by Enterprises Size 2025 & 2033
- Figure 77: Asia Pacific MEA BaaS Industry Revenue Share (%), by Enterprises Size 2025 & 2033
- Figure 78: Asia Pacific MEA BaaS Industry Volume Share (%), by Enterprises Size 2025 & 2033
- Figure 79: Asia Pacific MEA BaaS Industry Revenue (Million), by Country 2025 & 2033
- Figure 80: Asia Pacific MEA BaaS Industry Volume (Billion), by Country 2025 & 2033
- Figure 81: Asia Pacific MEA BaaS Industry Revenue Share (%), by Country 2025 & 2033
- Figure 82: Asia Pacific MEA BaaS Industry Volume Share (%), by Country 2025 & 2033
List of Tables
- Table 1: Global MEA BaaS Industry Revenue Million Forecast, by Type 2020 & 2033
- Table 2: Global MEA BaaS Industry Volume Billion Forecast, by Type 2020 & 2033
- Table 3: Global MEA BaaS Industry Revenue Million Forecast, by Service Type 2020 & 2033
- Table 4: Global MEA BaaS Industry Volume Billion Forecast, by Service Type 2020 & 2033
- Table 5: Global MEA BaaS Industry Revenue Million Forecast, by Enterprises Size 2020 & 2033
- Table 6: Global MEA BaaS Industry Volume Billion Forecast, by Enterprises Size 2020 & 2033
- Table 7: Global MEA BaaS Industry Revenue Million Forecast, by Region 2020 & 2033
- Table 8: Global MEA BaaS Industry Volume Billion Forecast, by Region 2020 & 2033
- Table 9: Global MEA BaaS Industry Revenue Million Forecast, by Type 2020 & 2033
- Table 10: Global MEA BaaS Industry Volume Billion Forecast, by Type 2020 & 2033
- Table 11: Global MEA BaaS Industry Revenue Million Forecast, by Service Type 2020 & 2033
- Table 12: Global MEA BaaS Industry Volume Billion Forecast, by Service Type 2020 & 2033
- Table 13: Global MEA BaaS Industry Revenue Million Forecast, by Enterprises Size 2020 & 2033
- Table 14: Global MEA BaaS Industry Volume Billion Forecast, by Enterprises Size 2020 & 2033
- Table 15: Global MEA BaaS Industry Revenue Million Forecast, by Country 2020 & 2033
- Table 16: Global MEA BaaS Industry Volume Billion Forecast, by Country 2020 & 2033
- Table 17: United States MEA BaaS Industry Revenue (Million) Forecast, by Application 2020 & 2033
- Table 18: United States MEA BaaS Industry Volume (Billion) Forecast, by Application 2020 & 2033
- Table 19: Canada MEA BaaS Industry Revenue (Million) Forecast, by Application 2020 & 2033
- Table 20: Canada MEA BaaS Industry Volume (Billion) Forecast, by Application 2020 & 2033
- Table 21: Mexico MEA BaaS Industry Revenue (Million) Forecast, by Application 2020 & 2033
- Table 22: Mexico MEA BaaS Industry Volume (Billion) Forecast, by Application 2020 & 2033
- Table 23: Global MEA BaaS Industry Revenue Million Forecast, by Type 2020 & 2033
- Table 24: Global MEA BaaS Industry Volume Billion Forecast, by Type 2020 & 2033
- Table 25: Global MEA BaaS Industry Revenue Million Forecast, by Service Type 2020 & 2033
- Table 26: Global MEA BaaS Industry Volume Billion Forecast, by Service Type 2020 & 2033
- Table 27: Global MEA BaaS Industry Revenue Million Forecast, by Enterprises Size 2020 & 2033
- Table 28: Global MEA BaaS Industry Volume Billion Forecast, by Enterprises Size 2020 & 2033
- Table 29: Global MEA BaaS Industry Revenue Million Forecast, by Country 2020 & 2033
- Table 30: Global MEA BaaS Industry Volume Billion Forecast, by Country 2020 & 2033
- Table 31: Brazil MEA BaaS Industry Revenue (Million) Forecast, by Application 2020 & 2033
- Table 32: Brazil MEA BaaS Industry Volume (Billion) Forecast, by Application 2020 & 2033
- Table 33: Argentina MEA BaaS Industry Revenue (Million) Forecast, by Application 2020 & 2033
- Table 34: Argentina MEA BaaS Industry Volume (Billion) Forecast, by Application 2020 & 2033
- Table 35: Rest of South America MEA BaaS Industry Revenue (Million) Forecast, by Application 2020 & 2033
- Table 36: Rest of South America MEA BaaS Industry Volume (Billion) Forecast, by Application 2020 & 2033
- Table 37: Global MEA BaaS Industry Revenue Million Forecast, by Type 2020 & 2033
- Table 38: Global MEA BaaS Industry Volume Billion Forecast, by Type 2020 & 2033
- Table 39: Global MEA BaaS Industry Revenue Million Forecast, by Service Type 2020 & 2033
- Table 40: Global MEA BaaS Industry Volume Billion Forecast, by Service Type 2020 & 2033
- Table 41: Global MEA BaaS Industry Revenue Million Forecast, by Enterprises Size 2020 & 2033
- Table 42: Global MEA BaaS Industry Volume Billion Forecast, by Enterprises Size 2020 & 2033
- Table 43: Global MEA BaaS Industry Revenue Million Forecast, by Country 2020 & 2033
- Table 44: Global MEA BaaS Industry Volume Billion Forecast, by Country 2020 & 2033
- Table 45: United Kingdom MEA BaaS Industry Revenue (Million) Forecast, by Application 2020 & 2033
- Table 46: United Kingdom MEA BaaS Industry Volume (Billion) Forecast, by Application 2020 & 2033
- Table 47: Germany MEA BaaS Industry Revenue (Million) Forecast, by Application 2020 & 2033
- Table 48: Germany MEA BaaS Industry Volume (Billion) Forecast, by Application 2020 & 2033
- Table 49: France MEA BaaS Industry Revenue (Million) Forecast, by Application 2020 & 2033
- Table 50: France MEA BaaS Industry Volume (Billion) Forecast, by Application 2020 & 2033
- Table 51: Italy MEA BaaS Industry Revenue (Million) Forecast, by Application 2020 & 2033
- Table 52: Italy MEA BaaS Industry Volume (Billion) Forecast, by Application 2020 & 2033
- Table 53: Spain MEA BaaS Industry Revenue (Million) Forecast, by Application 2020 & 2033
- Table 54: Spain MEA BaaS Industry Volume (Billion) Forecast, by Application 2020 & 2033
- Table 55: Russia MEA BaaS Industry Revenue (Million) Forecast, by Application 2020 & 2033
- Table 56: Russia MEA BaaS Industry Volume (Billion) Forecast, by Application 2020 & 2033
- Table 57: Benelux MEA BaaS Industry Revenue (Million) Forecast, by Application 2020 & 2033
- Table 58: Benelux MEA BaaS Industry Volume (Billion) Forecast, by Application 2020 & 2033
- Table 59: Nordics MEA BaaS Industry Revenue (Million) Forecast, by Application 2020 & 2033
- Table 60: Nordics MEA BaaS Industry Volume (Billion) Forecast, by Application 2020 & 2033
- Table 61: Rest of Europe MEA BaaS Industry Revenue (Million) Forecast, by Application 2020 & 2033
- Table 62: Rest of Europe MEA BaaS Industry Volume (Billion) Forecast, by Application 2020 & 2033
- Table 63: Global MEA BaaS Industry Revenue Million Forecast, by Type 2020 & 2033
- Table 64: Global MEA BaaS Industry Volume Billion Forecast, by Type 2020 & 2033
- Table 65: Global MEA BaaS Industry Revenue Million Forecast, by Service Type 2020 & 2033
- Table 66: Global MEA BaaS Industry Volume Billion Forecast, by Service Type 2020 & 2033
- Table 67: Global MEA BaaS Industry Revenue Million Forecast, by Enterprises Size 2020 & 2033
- Table 68: Global MEA BaaS Industry Volume Billion Forecast, by Enterprises Size 2020 & 2033
- Table 69: Global MEA BaaS Industry Revenue Million Forecast, by Country 2020 & 2033
- Table 70: Global MEA BaaS Industry Volume Billion Forecast, by Country 2020 & 2033
- Table 71: Turkey MEA BaaS Industry Revenue (Million) Forecast, by Application 2020 & 2033
- Table 72: Turkey MEA BaaS Industry Volume (Billion) Forecast, by Application 2020 & 2033
- Table 73: Israel MEA BaaS Industry Revenue (Million) Forecast, by Application 2020 & 2033
- Table 74: Israel MEA BaaS Industry Volume (Billion) Forecast, by Application 2020 & 2033
- Table 75: GCC MEA BaaS Industry Revenue (Million) Forecast, by Application 2020 & 2033
- Table 76: GCC MEA BaaS Industry Volume (Billion) Forecast, by Application 2020 & 2033
- Table 77: North Africa MEA BaaS Industry Revenue (Million) Forecast, by Application 2020 & 2033
- Table 78: North Africa MEA BaaS Industry Volume (Billion) Forecast, by Application 2020 & 2033
- Table 79: South Africa MEA BaaS Industry Revenue (Million) Forecast, by Application 2020 & 2033
- Table 80: South Africa MEA BaaS Industry Volume (Billion) Forecast, by Application 2020 & 2033
- Table 81: Rest of Middle East & Africa MEA BaaS Industry Revenue (Million) Forecast, by Application 2020 & 2033
- Table 82: Rest of Middle East & Africa MEA BaaS Industry Volume (Billion) Forecast, by Application 2020 & 2033
- Table 83: Global MEA BaaS Industry Revenue Million Forecast, by Type 2020 & 2033
- Table 84: Global MEA BaaS Industry Volume Billion Forecast, by Type 2020 & 2033
- Table 85: Global MEA BaaS Industry Revenue Million Forecast, by Service Type 2020 & 2033
- Table 86: Global MEA BaaS Industry Volume Billion Forecast, by Service Type 2020 & 2033
- Table 87: Global MEA BaaS Industry Revenue Million Forecast, by Enterprises Size 2020 & 2033
- Table 88: Global MEA BaaS Industry Volume Billion Forecast, by Enterprises Size 2020 & 2033
- Table 89: Global MEA BaaS Industry Revenue Million Forecast, by Country 2020 & 2033
- Table 90: Global MEA BaaS Industry Volume Billion Forecast, by Country 2020 & 2033
- Table 91: China MEA BaaS Industry Revenue (Million) Forecast, by Application 2020 & 2033
- Table 92: China MEA BaaS Industry Volume (Billion) Forecast, by Application 2020 & 2033
- Table 93: India MEA BaaS Industry Revenue (Million) Forecast, by Application 2020 & 2033
- Table 94: India MEA BaaS Industry Volume (Billion) Forecast, by Application 2020 & 2033
- Table 95: Japan MEA BaaS Industry Revenue (Million) Forecast, by Application 2020 & 2033
- Table 96: Japan MEA BaaS Industry Volume (Billion) Forecast, by Application 2020 & 2033
- Table 97: South Korea MEA BaaS Industry Revenue (Million) Forecast, by Application 2020 & 2033
- Table 98: South Korea MEA BaaS Industry Volume (Billion) Forecast, by Application 2020 & 2033
- Table 99: ASEAN MEA BaaS Industry Revenue (Million) Forecast, by Application 2020 & 2033
- Table 100: ASEAN MEA BaaS Industry Volume (Billion) Forecast, by Application 2020 & 2033
- Table 101: Oceania MEA BaaS Industry Revenue (Million) Forecast, by Application 2020 & 2033
- Table 102: Oceania MEA BaaS Industry Volume (Billion) Forecast, by Application 2020 & 2033
- Table 103: Rest of Asia Pacific MEA BaaS Industry Revenue (Million) Forecast, by Application 2020 & 2033
- Table 104: Rest of Asia Pacific MEA BaaS Industry Volume (Billion) Forecast, by Application 2020 & 2033
Frequently Asked Questions
1. What is the projected Compound Annual Growth Rate (CAGR) of the MEA BaaS Industry?
The projected CAGR is approximately 7.40%.
2. Which companies are prominent players in the MEA BaaS Industry?
Key companies in the market include Sarwa Co, Beehive Federal Credit Union, Solaris Bank, NOW Money, Treezor, Telr, Mamo Pay, Felix, Jingle Pay, Al Baraka Bank**List Not Exhaustive.
3. What are the main segments of the MEA BaaS Industry?
The market segments include Type, Service Type, Enterprises Size.
4. Can you provide details about the market size?
The market size is estimated to be USD 65.51 Million as of 2022.
5. What are some drivers contributing to market growth?
Rise in Digital Banking the Region; Rise in Volume of Financial Transaction in the Region.
6. What are the notable trends driving market growth?
Rising Volume of Transaction in the Region.
7. Are there any restraints impacting market growth?
Rise in Digital Banking the Region; Rise in Volume of Financial Transaction in the Region.
8. Can you provide examples of recent developments in the market?
In March 2022. Aazzur partnered with Treezor which exists as a European firm in Banking-as-a-Service (BaaS). The partnership will increase Aazzur's client base and develop its BaaS offering in the region by supplying its payment infrastructure for account and card management, while Aazur will provide front-end layers, integration, and value-added products for front-end and wealth services.
9. What pricing options are available for accessing the report?
Pricing options include single-user, multi-user, and enterprise licenses priced at USD 3800, USD 4500, and USD 5800 respectively.
10. Is the market size provided in terms of value or volume?
The market size is provided in terms of value, measured in Million and volume, measured in Billion.
11. Are there any specific market keywords associated with the report?
Yes, the market keyword associated with the report is "MEA BaaS Industry," which aids in identifying and referencing the specific market segment covered.
12. How do I determine which pricing option suits my needs best?
The pricing options vary based on user requirements and access needs. Individual users may opt for single-user licenses, while businesses requiring broader access may choose multi-user or enterprise licenses for cost-effective access to the report.
13. Are there any additional resources or data provided in the MEA BaaS Industry report?
While the report offers comprehensive insights, it's advisable to review the specific contents or supplementary materials provided to ascertain if additional resources or data are available.
14. How can I stay updated on further developments or reports in the MEA BaaS Industry?
To stay informed about further developments, trends, and reports in the MEA BaaS Industry, consider subscribing to industry newsletters, following relevant companies and organizations, or regularly checking reputable industry news sources and publications.
Methodology
Step 1 - Identification of Relevant Samples Size from Population Database


Step 2 - Approaches for Defining Global Market Size (Value, Volume* & Price*)

Note*: In applicable scenarios
Step 3 - Data Sources
Primary Research
- Web Analytics
- Survey Reports
- Research Institute
- Latest Research Reports
- Opinion Leaders
Secondary Research
- Annual Reports
- White Paper
- Latest Press Release
- Industry Association
- Paid Database
- Investor Presentations

Step 4 - Data Triangulation
Involves using different sources of information in order to increase the validity of a study
These sources are likely to be stakeholders in a program - participants, other researchers, program staff, other community members, and so on.
Then we put all data in single framework & apply various statistical tools to find out the dynamic on the market.
During the analysis stage, feedback from the stakeholder groups would be compared to determine areas of agreement as well as areas of divergence