

Key Insights
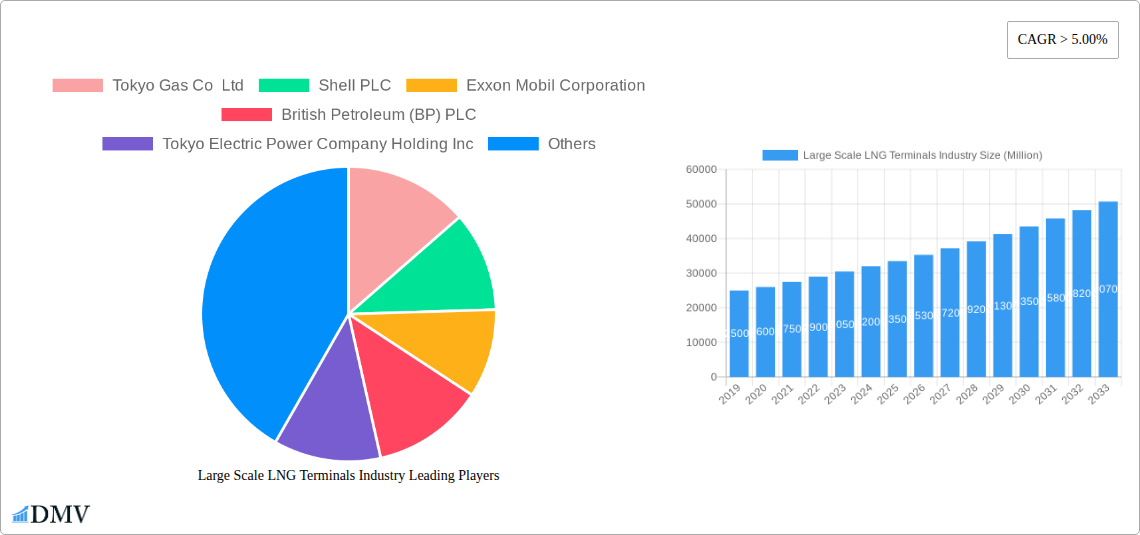
The global Large Scale LNG Terminals market is poised for significant expansion, projected to reach a substantial market size with a Compound Annual Growth Rate (CAGR) exceeding 5.00%. This robust growth is primarily fueled by the escalating global demand for cleaner energy sources, coupled with the strategic expansion of LNG infrastructure to meet diverse energy needs. The increasing adoption of Liquefied Natural Gas (LNG) as a transitional fuel, offering a more environmentally friendly alternative to coal and oil, is a key driver. Furthermore, advancements in liquefaction and regasification technologies are enhancing operational efficiency and reducing costs, making LNG a more attractive option for both developed and developing economies. The geographical distribution of LNG terminals, encompassing both onshore and offshore facilities, highlights the industry's adaptability to various environmental and logistical considerations. Major players like Shell PLC, Exxon Mobil Corporation, and TotalEnergies SE are heavily investing in developing and expanding their LNG terminal networks, indicating strong confidence in the market's future trajectory. This expansion is crucial for enhancing energy security and diversifying supply chains across the globe.
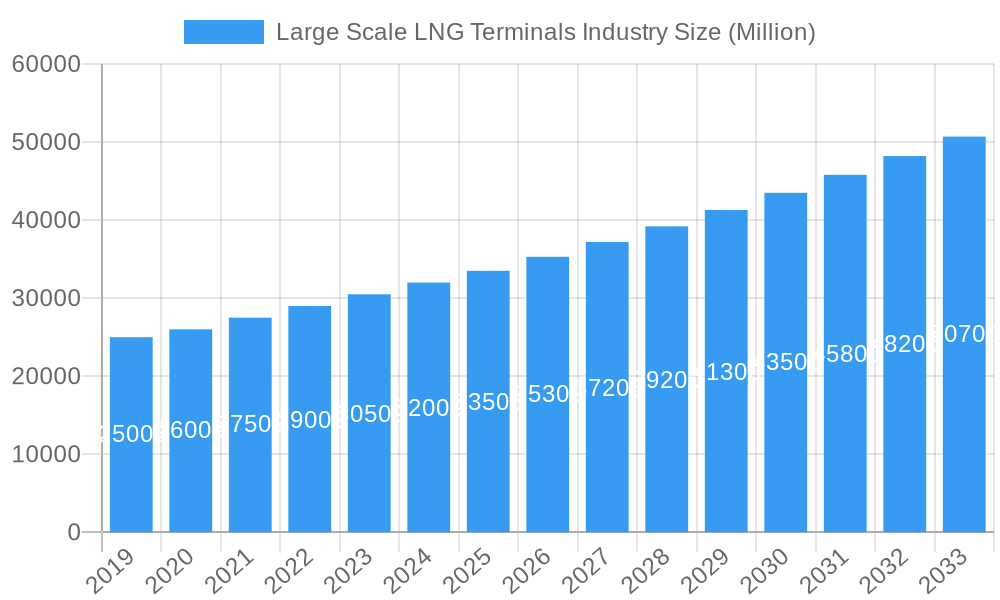
Large Scale LNG Terminals Industry Market Size (In Billion)
The market is characterized by a dynamic interplay of growth drivers and challenges. While the demand for LNG as a cleaner fuel and the ongoing development of liquefaction and regasification technologies propel growth, certain factors could present headwinds. Geopolitical shifts influencing global energy trade routes and the fluctuating prices of natural gas can impact investment decisions and terminal utilization rates. Additionally, the substantial capital expenditure required for constructing and maintaining large-scale LNG terminals, alongside evolving environmental regulations concerning greenhouse gas emissions, necessitate careful strategic planning and technological innovation. The regional distribution of this market shows significant activity across North America, Asia Pacific, and Europe, driven by distinct energy policies and consumption patterns. For instance, the Asia Pacific region, with its rapidly growing economies and increasing energy needs, is a pivotal market. The study period from 2019 to 2033, with 2025 as the base year, provides a comprehensive outlook on the market's evolution, emphasizing the significant opportunities and strategic imperatives for stakeholders in the large-scale LNG terminals industry.
Large Scale LNG Terminals Industry Company Market Share
Unlocking Global Energy: Comprehensive Large Scale LNG Terminals Industry Market Report (2019–2033)
Dive deep into the dynamic Large Scale LNG Terminals Industry with our in-depth market analysis, covering the pivotal study period of 2019–2033. This comprehensive report, with a base year of 2025 and an estimated year also of 2025, provides unparalleled insights into the Liquefaction and Regasification segments, including crucial Onshore and Offshore deployment locations. Discover critical market trends, growth drivers, emerging opportunities, and the competitive landscape shaped by industry titans like Tokyo Gas Co Ltd, Shell PLC, Exxon Mobil Corporation, British Petroleum (BP) PLC, Tokyo Electric Power Company Holding Inc, Cheniere Energy Inc, China National Offshore Oil Corporation (CNOOC), Chevron Corporation, Petronet LNG Ltd, and TotalEnergies SE. With millions of dollars in investment and global energy security at stake, this report is essential for stakeholders seeking to navigate and capitalize on the evolving LNG infrastructure market.
Large Scale LNG Terminals Industry Market Composition & Trends
The global Large Scale LNG Terminals Industry is characterized by a moderate market concentration, with a few key players dominating both liquefaction and regasification capacities. Innovation catalysts are primarily driven by the increasing demand for cleaner energy sources and the urgent need for energy diversification, particularly in Europe and Asia. Regulatory landscapes are evolving rapidly, with governments implementing supportive policies and incentives to accelerate LNG terminal development. The substitute products landscape is limited, with pipeline natural gas remaining the primary competitor, though LNG offers superior flexibility and accessibility for regions lacking pipeline infrastructure. End-user profiles are diverse, encompassing national energy companies, utility providers, industrial consumers, and even smaller island nations seeking reliable energy imports. Mergers and acquisitions (M&A) activities are expected to increase as companies seek to expand their global footprint and secure strategic assets. For instance, recent M&A deals have seen companies acquiring stakes in existing terminals or investing in new greenfield projects to bolster their LNG supply chains, with deal values in the billions of dollars. Understanding these intricate market dynamics is crucial for strategic planning and investment decisions.
Large Scale LNG Terminals Industry Industry Evolution
The Large Scale LNG Terminals Industry has witnessed remarkable evolution over the historical period of 2019–2024, driven by a confluence of geopolitical shifts, technological advancements, and a growing global appetite for natural gas as a transitional fuel. The market growth trajectory has been predominantly upward, fueled by increasing energy demand in emerging economies and the strategic imperative for energy security among developed nations. Technological advancements have played a pivotal role, with innovations in floating liquefaction and regasification units (FLNG and FSRUs) offering greater flexibility and faster deployment compared to traditional land-based terminals. This has opened up new opportunities for offshore gas fields and provided solutions for regions with limited land availability. Furthermore, advancements in material science and engineering have led to more efficient and cost-effective terminal designs, reducing construction timelines and operational expenditures. Shifting consumer demands, influenced by environmental concerns and the push for decarbonization, have also shaped the industry. While natural gas is not a zero-emission fuel, its lower carbon intensity compared to coal and oil makes it a vital component of the energy transition, driving investment in LNG infrastructure. The adoption of LNG as a fuel for shipping and heavy-duty transport is also contributing to this demand, creating a more diversified and robust market. The market has seen an average annual growth rate of approximately 5% over the historical period, with significant investments in new terminal capacities and upgrades to existing infrastructure. The adoption of FLNG and FSRU technologies has grown by an estimated 15% annually as their economic viability and operational advantages become increasingly apparent.
Leading Regions, Countries, or Segments in Large Scale LNG Terminals Industry
The dominance within the Large Scale LNG Terminals Industry is currently shifting, with Asia-Pacific, particularly China and Southeast Asia, leading the charge in new terminal development and capacity expansion. This region’s insatiable energy demand, coupled with government initiatives to diversify away from coal, has positioned it as a critical hub for LNG imports and infrastructure investment.
- Location of Deployment: Onshore terminals continue to represent the majority of global LNG import and export capacity due to established infrastructure and larger-scale operations. However, offshore deployments, primarily FSRUs, are experiencing rapid growth, especially in regions with limited land availability or for rapid deployment solutions. Countries like Germany and South Korea have seen significant investments in offshore terminals to bolster energy security.
- Operation: Regasification terminals are currently more prevalent globally as they facilitate the import of LNG. However, the growth in liquefaction capacity, particularly in gas-producing regions like North America and the Middle East, is substantial and critical for unlocking new supply sources.
- Key Drivers for Dominance:
- Investment Trends: Asia-Pacific countries are channeling billions of dollars into building new LNG import terminals and expanding existing ones. This includes massive projects by state-owned enterprises and private sector collaborations.
- Regulatory Support: Governments in key consuming nations are actively supporting LNG terminal development through streamlined permitting processes, tax incentives, and long-term off-take agreements. This has been particularly evident in Europe’s recent efforts to secure energy independence.
- Energy Security Concerns: Geopolitical events have amplified the focus on energy security, prompting nations to secure diverse and reliable energy sources. LNG, with its global supply chain and flexibility, has become a cornerstone of these strategies.
- Economic Viability: The increasing cost-competitiveness of LNG, driven by production advancements and transportation efficiencies, makes it an attractive fuel option for both power generation and industrial use.
The strategic importance of these regions and segments lies in their ability to facilitate the global flow of LNG, impacting energy prices, supply stability, and the pace of the energy transition worldwide.
Large Scale LNG Terminals Industry Product Innovations
Product innovations in the Large Scale LNG Terminals Industry are primarily focused on enhancing efficiency, safety, and environmental performance. Significant advancements have been made in the design and operational capabilities of Floating Storage and Regasification Units (FSRUs) and Floating Liquefaction Units (FLNGs), offering modularity and faster deployment times compared to land-based facilities. These innovations allow for quicker access to remote gas reserves and provide flexible import/export solutions. Furthermore, improvements in cryogenic containment systems, materials science for pipelines and storage tanks, and advanced automation and digital control systems are enhancing operational reliability and reducing maintenance costs. The development of small-scale and mid-scale LNG infrastructure is also gaining traction, catering to niche markets and emerging economies. These innovations are crucial for optimizing the entire LNG value chain, from production to end-use, and ensuring the long-term sustainability of the industry.
Propelling Factors for Large Scale LNG Terminals Industry Growth
The Large Scale LNG Terminals Industry is propelled by several key factors. Firstly, the growing global demand for energy, particularly in emerging economies, necessitates diversified and secure energy supplies. Secondly, the transition towards cleaner energy sources positions natural gas as a crucial bridging fuel, reducing reliance on more carbon-intensive fuels like coal and oil. Thirdly, increasing geopolitical instability and the pursuit of energy independence are driving nations to secure non-pipeline gas supplies, with LNG offering significant flexibility and strategic advantage. Technological advancements in liquefaction and regasification technologies, especially the rise of modular and floating terminals, are also making LNG infrastructure more accessible and cost-effective. Finally, supportive government policies and regulatory frameworks aimed at enhancing energy security and promoting LNG adoption are crucial growth catalysts, fostering substantial investments estimated in the tens of billions of dollars annually.
Obstacles in the Large Scale LNG Terminals Industry Market
Despite robust growth prospects, the Large Scale LNG Terminals Industry faces several obstacles. High capital expenditure for terminal construction, often running into billions of dollars, remains a significant barrier to entry and expansion. Complex and lengthy regulatory and permitting processes across different jurisdictions can cause project delays and increase costs. Supply chain disruptions, exacerbated by geopolitical events and global shipping challenges, can impact project timelines and operational efficiency. Environmental concerns and public perception regarding the carbon footprint of natural gas and the potential impacts of LNG terminals can lead to opposition and regulatory hurdles. Furthermore, volatility in natural gas prices and long-term contract negotiations can create uncertainty for investors and project developers, impacting the financial viability of new projects, with potential revenue losses estimated in the hundreds of millions of dollars for delayed or canceled projects.
Future Opportunities in Large Scale LNG Terminals Industry
Emerging opportunities in the Large Scale LNG Terminals Industry are abundant. The growing demand for LNG as a marine fuel presents a significant avenue for growth, requiring new bunkering infrastructure. Development of smaller-scale and modular LNG terminals caters to niche markets and developing economies seeking flexible energy solutions. The increasing focus on decarbonization and the integration of carbon capture, utilization, and storage (CCUS) technologies within LNG facilities offers a path towards lower-emission LNG. Furthermore, the expansion of LNG infrastructure in new and underserved markets, driven by energy security concerns and economic development, presents substantial investment potential. The development of virtual pipelines leveraging smaller LNG carriers and regasification units will also open up new logistical possibilities, creating opportunities estimated to be in the billions of dollars over the forecast period.
Major Players in the Large Scale LNG Terminals Industry Ecosystem
- Tokyo Gas Co Ltd
- Shell PLC
- Exxon Mobil Corporation
- British Petroleum (BP) PLC
- Tokyo Electric Power Company Holding Inc
- Cheniere Energy Inc
- China National Offshore Oil Corporation (CNOOC)
- Chevron Corporation
- Petronet LNG Ltd
- TotalEnergies SE
Key Developments in Large Scale LNG Terminals Industry Industry
- November 2022: Germany finished the construction of its first floating LNG terminal at the North Sea port of Wilhelmshaven, as the country scrambles to obtain additional LNG and transition away from Russian pipeline gas. This development significantly bolsters Germany's energy security and its commitment to diversifying energy sources, impacting the European LNG import market.
- November 2022: China has begun expanding its liquefied natural gas facility in Shanghai's Yangshan port, with a total investment of approximately USD 2.37 billion. The project includes a new 150,000-tonne LNG ship port and 3.1 million cubic meters of storage capacity, approximately 3.5 times the capacity of existing storage tanks. This expansion highlights China's growing role as a major LNG consumer and its strategic investment in critical energy infrastructure, influencing global LNG trade flows and terminal development trends.
Strategic Large Scale LNG Terminals Industry Market Forecast
The strategic forecast for the Large Scale LNG Terminals Industry is overwhelmingly positive, driven by robust demand for energy security and diversification. Future opportunities lie in the expansion of liquefaction and regasification capacities, with a significant focus on the development of floating LNG technologies to enhance flexibility and reduce deployment times. The increasing adoption of LNG as a cleaner transitional fuel, coupled with supportive government policies and substantial investments in new infrastructure projects, will fuel market growth. The market is projected to witness continued expansion, with a compound annual growth rate (CAGR) of approximately 6-8% over the forecast period. The overall market value is expected to reach hundreds of billions of dollars, presenting significant opportunities for stakeholders to invest in and capitalize on the evolving global energy landscape.
Large Scale LNG Terminals Industry Segmentation
-
1. Location of Deployment
- 1.1. Onshore
- 1.2. Offshore
-
2. Operation
- 2.1. Liquefaction
- 2.2. Regasification
Large Scale LNG Terminals Industry Segmentation By Geography
- 1. North America
- 2. Asia Pacific
- 3. Europe
- 4. South America
- 5. Middle East
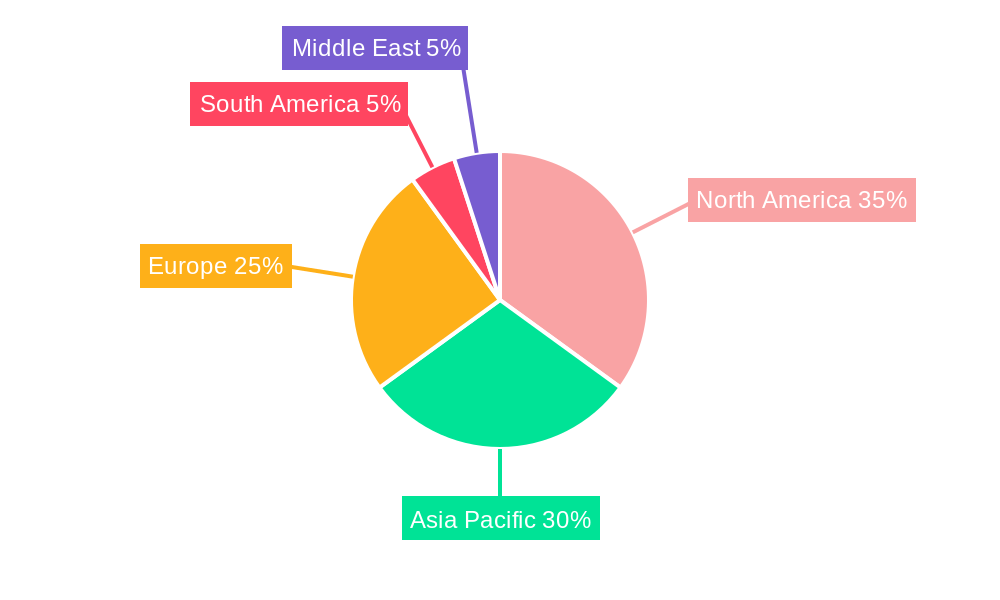
Large Scale LNG Terminals Industry Regional Market Share
Geographic Coverage of Large Scale LNG Terminals Industry
Large Scale LNG Terminals Industry REPORT HIGHLIGHTS
| Aspects | Details |
|---|---|
| Study Period | 2020-2034 |
| Base Year | 2025 |
| Estimated Year | 2026 |
| Forecast Period | 2026-2034 |
| Historical Period | 2020-2025 |
| Growth Rate | CAGR of > 5.00% from 2020-2034 |
| Segmentation |
|
Table of Contents
- 1. Introduction
- 1.1. Research Scope
- 1.2. Market Segmentation
- 1.3. Research Objective
- 1.4. Definitions and Assumptions
- 2. Executive Summary
- 2.1. Market Snapshot
- 3. Market Dynamics
- 3.1. Market Drivers
- 3.2. Market Restrains
- 3.3. Market Trends
- 3.4. Market Opportunities
- 4. Market Factor Analysis
- 4.1. Porters Five Forces
- 4.1.1. Bargaining Power of Suppliers
- 4.1.2. Bargaining Power of Buyers
- 4.1.3. Threat of New Entrants
- 4.1.4. Threat of Substitutes
- 4.1.5. Competitive Rivalry
- 4.2. PESTEL analysis
- 4.3. BCG Analysis
- 4.3.1. Stars (High Growth, High Market Share)
- 4.3.2. Cash Cows (Low Growth, High Market Share)
- 4.3.3. Question Mark (High Growth, Low Market Share)
- 4.3.4. Dogs (Low Growth, Low Market Share)
- 4.4. Ansoff Matrix Analysis
- 4.5. Supply Chain Analysis
- 4.6. Regulatory Landscape
- 4.7. Current Market Potential and Opportunity Assessment (TAM–SAM–SOM Framework)
- 4.8. DMV Analyst Note
- 4.1. Porters Five Forces
- 5. Market Analysis, Insights and Forecast 2021-2033
- 5.1. Market Analysis, Insights and Forecast - by Location of Deployment
- 5.1.1. Onshore
- 5.1.2. Offshore
- 5.2. Market Analysis, Insights and Forecast - by Operation
- 5.2.1. Liquefaction
- 5.2.2. Regasification
- 5.3. Market Analysis, Insights and Forecast - by Region
- 5.3.1. North America
- 5.3.2. Asia Pacific
- 5.3.3. Europe
- 5.3.4. South America
- 5.3.5. Middle East
- 5.1. Market Analysis, Insights and Forecast - by Location of Deployment
- 6. Global Large Scale LNG Terminals Industry Analysis, Insights and Forecast, 2021-2033
- 6.1. Market Analysis, Insights and Forecast - by Location of Deployment
- 6.1.1. Onshore
- 6.1.2. Offshore
- 6.2. Market Analysis, Insights and Forecast - by Operation
- 6.2.1. Liquefaction
- 6.2.2. Regasification
- 6.1. Market Analysis, Insights and Forecast - by Location of Deployment
- 7. North America Large Scale LNG Terminals Industry Analysis, Insights and Forecast, 2020-2032
- 7.1. Market Analysis, Insights and Forecast - by Location of Deployment
- 7.1.1. Onshore
- 7.1.2. Offshore
- 7.2. Market Analysis, Insights and Forecast - by Operation
- 7.2.1. Liquefaction
- 7.2.2. Regasification
- 7.1. Market Analysis, Insights and Forecast - by Location of Deployment
- 8. Asia Pacific Large Scale LNG Terminals Industry Analysis, Insights and Forecast, 2020-2032
- 8.1. Market Analysis, Insights and Forecast - by Location of Deployment
- 8.1.1. Onshore
- 8.1.2. Offshore
- 8.2. Market Analysis, Insights and Forecast - by Operation
- 8.2.1. Liquefaction
- 8.2.2. Regasification
- 8.1. Market Analysis, Insights and Forecast - by Location of Deployment
- 9. Europe Large Scale LNG Terminals Industry Analysis, Insights and Forecast, 2020-2032
- 9.1. Market Analysis, Insights and Forecast - by Location of Deployment
- 9.1.1. Onshore
- 9.1.2. Offshore
- 9.2. Market Analysis, Insights and Forecast - by Operation
- 9.2.1. Liquefaction
- 9.2.2. Regasification
- 9.1. Market Analysis, Insights and Forecast - by Location of Deployment
- 10. South America Large Scale LNG Terminals Industry Analysis, Insights and Forecast, 2020-2032
- 10.1. Market Analysis, Insights and Forecast - by Location of Deployment
- 10.1.1. Onshore
- 10.1.2. Offshore
- 10.2. Market Analysis, Insights and Forecast - by Operation
- 10.2.1. Liquefaction
- 10.2.2. Regasification
- 10.1. Market Analysis, Insights and Forecast - by Location of Deployment
- 11. Middle East Large Scale LNG Terminals Industry Analysis, Insights and Forecast, 2020-2032
- 11.1. Market Analysis, Insights and Forecast - by Location of Deployment
- 11.1.1. Onshore
- 11.1.2. Offshore
- 11.2. Market Analysis, Insights and Forecast - by Operation
- 11.2.1. Liquefaction
- 11.2.2. Regasification
- 11.1. Market Analysis, Insights and Forecast - by Location of Deployment
- 12. Competitive Analysis
- 12.1. Company Profiles
- 12.1.1 Tokyo Gas Co Ltd
- 12.1.1.1. Company Overview
- 12.1.1.2. Products
- 12.1.1.3. Company Financials
- 12.1.1.4. SWOT Analysis
- 12.1.2 Shell PLC
- 12.1.2.1. Company Overview
- 12.1.2.2. Products
- 12.1.2.3. Company Financials
- 12.1.2.4. SWOT Analysis
- 12.1.3 Exxon Mobil Corporation
- 12.1.3.1. Company Overview
- 12.1.3.2. Products
- 12.1.3.3. Company Financials
- 12.1.3.4. SWOT Analysis
- 12.1.4 British Petroleum (BP) PLC
- 12.1.4.1. Company Overview
- 12.1.4.2. Products
- 12.1.4.3. Company Financials
- 12.1.4.4. SWOT Analysis
- 12.1.5 Tokyo Electric Power Company Holding Inc
- 12.1.5.1. Company Overview
- 12.1.5.2. Products
- 12.1.5.3. Company Financials
- 12.1.5.4. SWOT Analysis
- 12.1.6 Cheniere Energy Inc
- 12.1.6.1. Company Overview
- 12.1.6.2. Products
- 12.1.6.3. Company Financials
- 12.1.6.4. SWOT Analysis
- 12.1.7 China National Offshore Oil Corporation (CNOOC)
- 12.1.7.1. Company Overview
- 12.1.7.2. Products
- 12.1.7.3. Company Financials
- 12.1.7.4. SWOT Analysis
- 12.1.8 Chevron Corporation
- 12.1.8.1. Company Overview
- 12.1.8.2. Products
- 12.1.8.3. Company Financials
- 12.1.8.4. SWOT Analysis
- 12.1.9 Petronet LNG Ltd*List Not Exhaustive
- 12.1.9.1. Company Overview
- 12.1.9.2. Products
- 12.1.9.3. Company Financials
- 12.1.9.4. SWOT Analysis
- 12.1.10 TotalEnergies SE
- 12.1.10.1. Company Overview
- 12.1.10.2. Products
- 12.1.10.3. Company Financials
- 12.1.10.4. SWOT Analysis
- 12.1.1 Tokyo Gas Co Ltd
- 12.2. Market Entropy
- 12.2.1 Company's Key Areas Served
- 12.2.2 Recent Developments
- 12.3. Company Market Share Analysis 2025
- 12.3.1 Top 5 Companies Market Share Analysis
- 12.3.2 Top 3 Companies Market Share Analysis
- 12.4. List of Potential Customers
- 13. Research Methodology
List of Figures
- Figure 1: Global Large Scale LNG Terminals Industry Revenue Breakdown (Million, %) by Region 2025 & 2033
- Figure 2: North America Large Scale LNG Terminals Industry Revenue (Million), by Location of Deployment 2025 & 2033
- Figure 3: North America Large Scale LNG Terminals Industry Revenue Share (%), by Location of Deployment 2025 & 2033
- Figure 4: North America Large Scale LNG Terminals Industry Revenue (Million), by Operation 2025 & 2033
- Figure 5: North America Large Scale LNG Terminals Industry Revenue Share (%), by Operation 2025 & 2033
- Figure 6: North America Large Scale LNG Terminals Industry Revenue (Million), by Country 2025 & 2033
- Figure 7: North America Large Scale LNG Terminals Industry Revenue Share (%), by Country 2025 & 2033
- Figure 8: Asia Pacific Large Scale LNG Terminals Industry Revenue (Million), by Location of Deployment 2025 & 2033
- Figure 9: Asia Pacific Large Scale LNG Terminals Industry Revenue Share (%), by Location of Deployment 2025 & 2033
- Figure 10: Asia Pacific Large Scale LNG Terminals Industry Revenue (Million), by Operation 2025 & 2033
- Figure 11: Asia Pacific Large Scale LNG Terminals Industry Revenue Share (%), by Operation 2025 & 2033
- Figure 12: Asia Pacific Large Scale LNG Terminals Industry Revenue (Million), by Country 2025 & 2033
- Figure 13: Asia Pacific Large Scale LNG Terminals Industry Revenue Share (%), by Country 2025 & 2033
- Figure 14: Europe Large Scale LNG Terminals Industry Revenue (Million), by Location of Deployment 2025 & 2033
- Figure 15: Europe Large Scale LNG Terminals Industry Revenue Share (%), by Location of Deployment 2025 & 2033
- Figure 16: Europe Large Scale LNG Terminals Industry Revenue (Million), by Operation 2025 & 2033
- Figure 17: Europe Large Scale LNG Terminals Industry Revenue Share (%), by Operation 2025 & 2033
- Figure 18: Europe Large Scale LNG Terminals Industry Revenue (Million), by Country 2025 & 2033
- Figure 19: Europe Large Scale LNG Terminals Industry Revenue Share (%), by Country 2025 & 2033
- Figure 20: South America Large Scale LNG Terminals Industry Revenue (Million), by Location of Deployment 2025 & 2033
- Figure 21: South America Large Scale LNG Terminals Industry Revenue Share (%), by Location of Deployment 2025 & 2033
- Figure 22: South America Large Scale LNG Terminals Industry Revenue (Million), by Operation 2025 & 2033
- Figure 23: South America Large Scale LNG Terminals Industry Revenue Share (%), by Operation 2025 & 2033
- Figure 24: South America Large Scale LNG Terminals Industry Revenue (Million), by Country 2025 & 2033
- Figure 25: South America Large Scale LNG Terminals Industry Revenue Share (%), by Country 2025 & 2033
- Figure 26: Middle East Large Scale LNG Terminals Industry Revenue (Million), by Location of Deployment 2025 & 2033
- Figure 27: Middle East Large Scale LNG Terminals Industry Revenue Share (%), by Location of Deployment 2025 & 2033
- Figure 28: Middle East Large Scale LNG Terminals Industry Revenue (Million), by Operation 2025 & 2033
- Figure 29: Middle East Large Scale LNG Terminals Industry Revenue Share (%), by Operation 2025 & 2033
- Figure 30: Middle East Large Scale LNG Terminals Industry Revenue (Million), by Country 2025 & 2033
- Figure 31: Middle East Large Scale LNG Terminals Industry Revenue Share (%), by Country 2025 & 2033
List of Tables
- Table 1: Global Large Scale LNG Terminals Industry Revenue Million Forecast, by Location of Deployment 2020 & 2033
- Table 2: Global Large Scale LNG Terminals Industry Revenue Million Forecast, by Operation 2020 & 2033
- Table 3: Global Large Scale LNG Terminals Industry Revenue Million Forecast, by Region 2020 & 2033
- Table 4: Global Large Scale LNG Terminals Industry Revenue Million Forecast, by Location of Deployment 2020 & 2033
- Table 5: Global Large Scale LNG Terminals Industry Revenue Million Forecast, by Operation 2020 & 2033
- Table 6: Global Large Scale LNG Terminals Industry Revenue Million Forecast, by Country 2020 & 2033
- Table 7: Global Large Scale LNG Terminals Industry Revenue Million Forecast, by Location of Deployment 2020 & 2033
- Table 8: Global Large Scale LNG Terminals Industry Revenue Million Forecast, by Operation 2020 & 2033
- Table 9: Global Large Scale LNG Terminals Industry Revenue Million Forecast, by Country 2020 & 2033
- Table 10: Global Large Scale LNG Terminals Industry Revenue Million Forecast, by Location of Deployment 2020 & 2033
- Table 11: Global Large Scale LNG Terminals Industry Revenue Million Forecast, by Operation 2020 & 2033
- Table 12: Global Large Scale LNG Terminals Industry Revenue Million Forecast, by Country 2020 & 2033
- Table 13: Global Large Scale LNG Terminals Industry Revenue Million Forecast, by Location of Deployment 2020 & 2033
- Table 14: Global Large Scale LNG Terminals Industry Revenue Million Forecast, by Operation 2020 & 2033
- Table 15: Global Large Scale LNG Terminals Industry Revenue Million Forecast, by Country 2020 & 2033
- Table 16: Global Large Scale LNG Terminals Industry Revenue Million Forecast, by Location of Deployment 2020 & 2033
- Table 17: Global Large Scale LNG Terminals Industry Revenue Million Forecast, by Operation 2020 & 2033
- Table 18: Global Large Scale LNG Terminals Industry Revenue Million Forecast, by Country 2020 & 2033
Frequently Asked Questions
1. What is the projected Compound Annual Growth Rate (CAGR) of the Large Scale LNG Terminals Industry?
The projected CAGR is approximately > 5.00%.
2. Which companies are prominent players in the Large Scale LNG Terminals Industry?
Key companies in the market include Tokyo Gas Co Ltd, Shell PLC, Exxon Mobil Corporation, British Petroleum (BP) PLC, Tokyo Electric Power Company Holding Inc, Cheniere Energy Inc, China National Offshore Oil Corporation (CNOOC), Chevron Corporation, Petronet LNG Ltd*List Not Exhaustive, TotalEnergies SE.
3. What are the main segments of the Large Scale LNG Terminals Industry?
The market segments include Location of Deployment, Operation.
4. Can you provide details about the market size?
The market size is estimated to be USD XX Million as of 2022.
5. What are some drivers contributing to market growth?
4.; Increasing Demand for Sales of Commercial Vehicles4.; Increasing Deployment of Retail Fuel Outlets Across Various Countries.
6. What are the notable trends driving market growth?
Regasification LNG Terminals to Dominate the Market.
7. Are there any restraints impacting market growth?
4.; Growing Penetration and Demand for Electric Vehicles.
8. Can you provide examples of recent developments in the market?
November 2022: Germany finished the construction of its first floating LNG terminal at the North Sea port of Wilhelmshaven, as the country scrambles to obtain additional LNG and transition away from Russian pipeline gas.
9. What pricing options are available for accessing the report?
Pricing options include single-user, multi-user, and enterprise licenses priced at USD 4750, USD 5250, and USD 8750 respectively.
10. Is the market size provided in terms of value or volume?
The market size is provided in terms of value, measured in Million.
11. Are there any specific market keywords associated with the report?
Yes, the market keyword associated with the report is "Large Scale LNG Terminals Industry," which aids in identifying and referencing the specific market segment covered.
12. How do I determine which pricing option suits my needs best?
The pricing options vary based on user requirements and access needs. Individual users may opt for single-user licenses, while businesses requiring broader access may choose multi-user or enterprise licenses for cost-effective access to the report.
13. Are there any additional resources or data provided in the Large Scale LNG Terminals Industry report?
While the report offers comprehensive insights, it's advisable to review the specific contents or supplementary materials provided to ascertain if additional resources or data are available.
14. How can I stay updated on further developments or reports in the Large Scale LNG Terminals Industry?
To stay informed about further developments, trends, and reports in the Large Scale LNG Terminals Industry, consider subscribing to industry newsletters, following relevant companies and organizations, or regularly checking reputable industry news sources and publications.
Methodology
Step 1 - Identification of Relevant Samples Size from Population Database


Step 2 - Approaches for Defining Global Market Size (Value, Volume* & Price*)

Note*: In applicable scenarios
Step 3 - Data Sources
Primary Research
- Web Analytics
- Survey Reports
- Research Institute
- Latest Research Reports
- Opinion Leaders
Secondary Research
- Annual Reports
- White Paper
- Latest Press Release
- Industry Association
- Paid Database
- Investor Presentations

Step 4 - Data Triangulation
Involves using different sources of information in order to increase the validity of a study
These sources are likely to be stakeholders in a program - participants, other researchers, program staff, other community members, and so on.
Then we put all data in single framework & apply various statistical tools to find out the dynamic on the market.
During the analysis stage, feedback from the stakeholder groups would be compared to determine areas of agreement as well as areas of divergence