

Key Insights
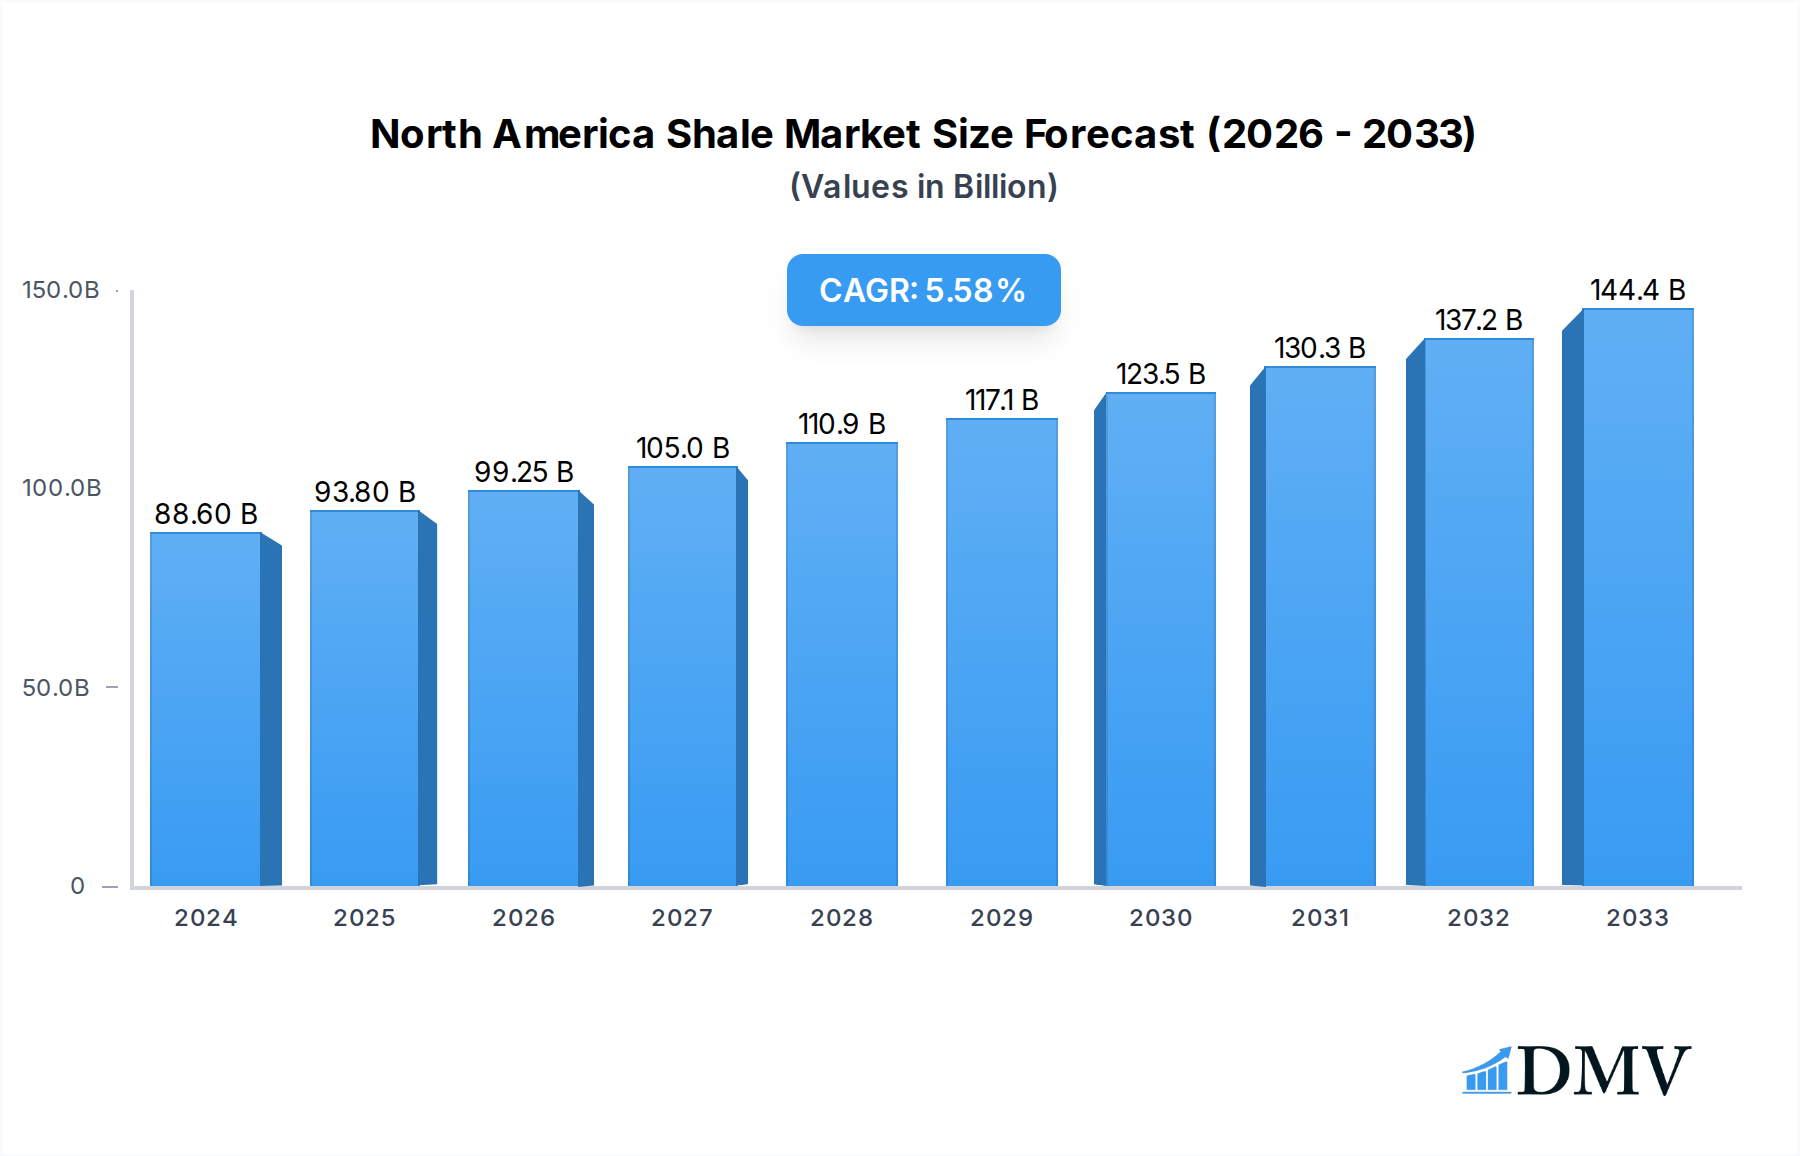
The North America Shale Market is poised for significant expansion, with a market size of USD 88.6 billion in 2024 and a projected Compound Annual Growth Rate (CAGR) of 5.9% throughout the forecast period of 2025-2033. This robust growth is primarily fueled by a confluence of factors. The increasing global demand for energy, driven by industrialization and population growth, is a fundamental catalyst. Technological advancements in extraction techniques, such as horizontal drilling and hydraulic fracturing, have made shale resources more economically viable and accessible, significantly enhancing production capabilities. Furthermore, supportive government policies and investments in infrastructure development within the North American region are bolstering the market's trajectory. The region's abundant shale reserves, particularly in the United States and Canada, provide a substantial foundation for sustained production and market dominance.

North America Shale Market Market Size (In Billion)
Despite the positive outlook, certain restraints could influence the market's pace. Environmental concerns and stringent regulations surrounding hydraulic fracturing and water usage present ongoing challenges, potentially leading to increased operational costs and slower project approvals. Geopolitical uncertainties and fluctuations in global oil and gas prices can also create volatility, impacting investment decisions and market demand. However, the ongoing innovation in green extraction technologies and the development of more sustainable practices are expected to mitigate some of these environmental hurdles. The market is segmented across production analysis, consumption analysis, import and export markets (both value and volume), and price trend analysis, offering a comprehensive view of its dynamics. Key players like ExxonMobil, Chevron, Marathon Petroleum, ConocoPhillips, and Pioneer Natural Resources are actively shaping the competitive landscape through strategic investments and operational expansions.
North America Shale Market Company Market Share
This in-depth report provides a strategic outlook on the North America Shale Market, meticulously analyzing its composition, trends, and future trajectory. Covering the historical period of 2019-2024, base year 2025, and extending to a comprehensive forecast period of 2025-2033, this study offers critical insights for stakeholders seeking to navigate the dynamic landscape of North American unconventional oil and gas production.
North America Shale Market Market Composition & Trends
The North America Shale Market is characterized by a highly concentrated structure, with major players like ExxonMobil, Chevron, Marathon Petroleum, ConocoPhillips, and Pioneer Natural Resources holding significant market share, estimated to be over 65% collectively. Innovation catalysts are primarily driven by advancements in horizontal drilling and hydraulic fracturing technologies, which have continuously improved extraction efficiency and reduced operational costs. The regulatory landscape, while evolving, presents a mixed environment with varying state-level policies impacting permitting and environmental standards. Substitute products, though limited in direct energy replacement for crude oil and natural gas, include renewable energy sources which are influencing long-term demand dynamics. End-user profiles are diverse, spanning industrial manufacturing, transportation, and residential heating, all heavily reliant on shale-derived hydrocarbons. Mergers and Acquisitions (M&A) activities continue to shape the market, with estimated deal values reaching over $50 billion annually in recent years, signaling ongoing consolidation and strategic portfolio optimization among key companies.
North America Shale Market Industry Evolution
The North America Shale Market has undergone a transformative evolution, driven by relentless technological innovation and evolving global energy demands. From its nascent stages, the industry experienced exponential growth, particularly through the application of horizontal drilling and hydraulic fracturing, enabling access to vast previously uneconomical reserves. This paradigm shift, primarily observed from the late 2000s, propelled the United States to become a global energy superpower. The study period of 2019–2033 encapsulates both the mature phase of this growth and the subsequent adjustments in response to market volatilities and increasing environmental consciousness. Technological advancements have consistently focused on optimizing extraction techniques, reducing water usage, and minimizing the environmental footprint. Growth rates in production have averaged between 5% and 10% annually during peak periods, with significant fluctuations tied to commodity prices. The adoption metrics for enhanced oil recovery (EOR) techniques in mature shale plays are steadily increasing, indicating a drive for sustained production from existing assets. Shifting consumer demands, influenced by climate change concerns and the rising prominence of electric vehicles, are gradually impacting the long-term outlook for certain fossil fuel segments, prompting producers to focus on efficiency and diversification. The base year 2025 represents a critical juncture where the market is balancing established production capacities with emerging decarbonization initiatives.
Leading Regions, Countries, or Segments in North America Shale Market
The dominance within the North America Shale Market is multifaceted, with Texas, USA consistently emerging as the leading region across several critical segments.
Production Analysis:
- Dominant Country: United States, with Texas accounting for approximately 40% of the nation's total crude oil production and a substantial portion of its natural gas.
- Key Shale Plays: Permian Basin (Texas/New Mexico), Eagle Ford Shale (Texas), Bakken Formation (North Dakota/Montana), and Marcellus Shale (Pennsylvania/West Virginia) are the major contributors.
- Investment Trends: Significant capital expenditure continues to be directed towards the Permian Basin due to its prolific reserves and established infrastructure.
- Regulatory Support: Favorable state-level regulations in Texas have historically supported production growth, although environmental scrutiny is increasing.
Consumption Analysis:
- Primary Consumption Region: The United States itself remains the largest consumer, driven by its vast industrial and transportation sectors.
- End-User Industries: Petrochemical manufacturing, refining operations, and power generation constitute the bulk of domestic consumption.
- Economic Impact: Domestic consumption directly fuels economic activity, with an estimated consumption of over 20 million barrels of oil equivalent daily.
Import Market Analysis (Value & Volume):
- Dominant Country: Canada is the primary source of crude oil imports into the US, particularly for refineries in the Midwest.
- Value of Imports: Estimated to be in the range of $70 billion to $90 billion annually.
- Volume of Imports: Approximately 3 to 4 million barrels per day of crude oil.
- Natural Gas Imports: While the US is a net exporter of natural gas, specific regional demands can lead to localized imports from Canada, valued at approximately $5 billion to $10 billion annually.
Export Market Analysis (Value & Volume):
- Dominant Country: The United States has become a significant global exporter of crude oil and refined products.
- Value of Exports: Crude oil exports are estimated to range from $100 billion to $130 billion annually, with refined products adding another $80 billion to $100 billion.
- Volume of Exports: Crude oil exports average over 4 million barrels per day.
- Natural Gas Exports: Liquefied Natural Gas (LNG) exports are growing rapidly, with a projected value of $30 billion to $50 billion annually.
Price Trend Analysis:
- Key Influencers: Global supply and demand dynamics, geopolitical events, OPEC+ decisions, and shale production levels heavily influence WTI (West Texas Intermediate) and Henry Hub natural gas prices.
- Historical Volatility: The market has witnessed significant price swings, with crude oil prices fluctuating between $40 and $120 per barrel and natural gas prices ranging from $2 to $8 per MMBtu.
- Forecasted Stability: While volatility is expected to persist, a gradual stabilization is anticipated as production levels adjust to global demand.
North America Shale Market Product Innovations
The North America Shale Market is continuously propelled by product innovations focused on enhancing efficiency and sustainability. Advancements in proppant technology, such as ceramic and coated sands, significantly improve fracture conductivity, leading to higher well productivity. The development of biodegradable hydraulic fracturing fluids and closed-loop water recycling systems are key innovations addressing environmental concerns. Furthermore, the application of artificial intelligence (AI) and machine learning (ML) in reservoir characterization and drilling optimization is leading to more precise extraction strategies. These innovations aim to maximize hydrocarbon recovery while minimizing operational costs and environmental impact, with improved recovery rates of up to 15% reported in pilot projects.
Propelling Factors for North America Shale Market Growth
The growth of the North America Shale Market is propelled by a confluence of technological, economic, and regulatory factors. Technological advancements in horizontal drilling and hydraulic fracturing remain paramount, enabling access to vast, previously inaccessible reserves and driving down production costs. Economic drivers such as robust global demand for oil and natural gas, particularly from emerging economies, and the strategic advantage of North America's abundant resources, create a favorable investment climate. Supportive government policies, including tax incentives and streamlined permitting processes in certain regions, further encourage exploration and production activities. The increasing utilization of shale gas as a cleaner-burning fuel compared to coal in power generation also fuels demand.
Obstacles in the North America Shale Market Market
Despite its robust growth, the North America Shale Market faces several significant obstacles. Environmental concerns and regulatory hurdles, including stringent regulations on water usage, wastewater disposal, and methane emissions, can lead to increased operational costs and project delays. Price volatility in global commodity markets poses a persistent challenge, impacting investment decisions and profitability. Supply chain disruptions, exacerbated by geopolitical events and labor shortages, can impede the timely delivery of equipment and services. Furthermore, increasing competition from other energy sources, including renewables, and growing investor pressure for sustainable practices are shaping the market's future direction. The cost of capital can also fluctuate significantly, affecting the financial viability of new projects.
Future Opportunities in North America Shale Market
Emerging opportunities in the North America Shale Market are centered around technological innovation and evolving market demands. The development of advanced extraction techniques, such as enhanced oil recovery (EOR) methods specifically tailored for shale formations, presents a significant opportunity for maximizing output from existing fields. The growing global demand for Liquefied Natural Gas (LNG), driven by energy security concerns and the transition away from coal, offers substantial export potential for North American producers. Furthermore, the integration of carbon capture, utilization, and storage (CCUS) technologies within shale operations can mitigate environmental impact and open new avenues for sustainable production. The potential for geothermal energy extraction from deep shale formations also represents a long-term, albeit nascent, opportunity.
Major Players in the North America Shale Market Ecosystem
- ExxonMobil
- Chevron
- Marathon Petroleum
- ConocoPhillips
- Pioneer Natural Resources
- EOG Resources
- Occidental Petroleum
- APA Corporation
- Coterra Energy
- Diamondback Energy
Key Developments in North America Shale Market Industry
- 2023: Increased focus on methane emission reduction technologies and regulatory compliance, with several companies announcing ambitious targets.
- 2023: Significant M&A activity, with major players consolidating assets to achieve economies of scale and operational efficiencies.
- 2024: Advancements in AI and machine learning for reservoir analysis and drilling optimization, leading to improved well performance.
- 2024: Growing investment in LNG export terminals to meet surging international demand.
- 2024: Emerging discussions around the integration of CCUS technologies within existing shale operations to address climate concerns.
Strategic North America Shale Market Market Forecast
The North America Shale Market is poised for continued, albeit more measured, growth, driven by ongoing technological advancements and sustained global energy demand. The strategic forecast indicates a strong emphasis on operational efficiency, cost optimization, and environmental stewardship. Investments will likely concentrate on optimizing existing acreage and exploring novel extraction techniques that minimize environmental impact. The burgeoning LNG export market presents a significant growth catalyst for natural gas production. While geopolitical factors and commodity price volatility will continue to influence market dynamics, the inherent resource advantage and robust infrastructure position North America to remain a dominant force in the global energy landscape for the foreseeable future, with an estimated market value to reach over $500 billion by 2033.
North America Shale Market Segmentation
- 1. Production Analysis
- 2. Consumption Analysis
- 3. Import Market Analysis (Value & Volume)
- 4. Export Market Analysis (Value & Volume)
- 5. Price Trend Analysis
North America Shale Market Segmentation By Geography
- 1. United States
- 2. Canada
- 3. Rest of North America
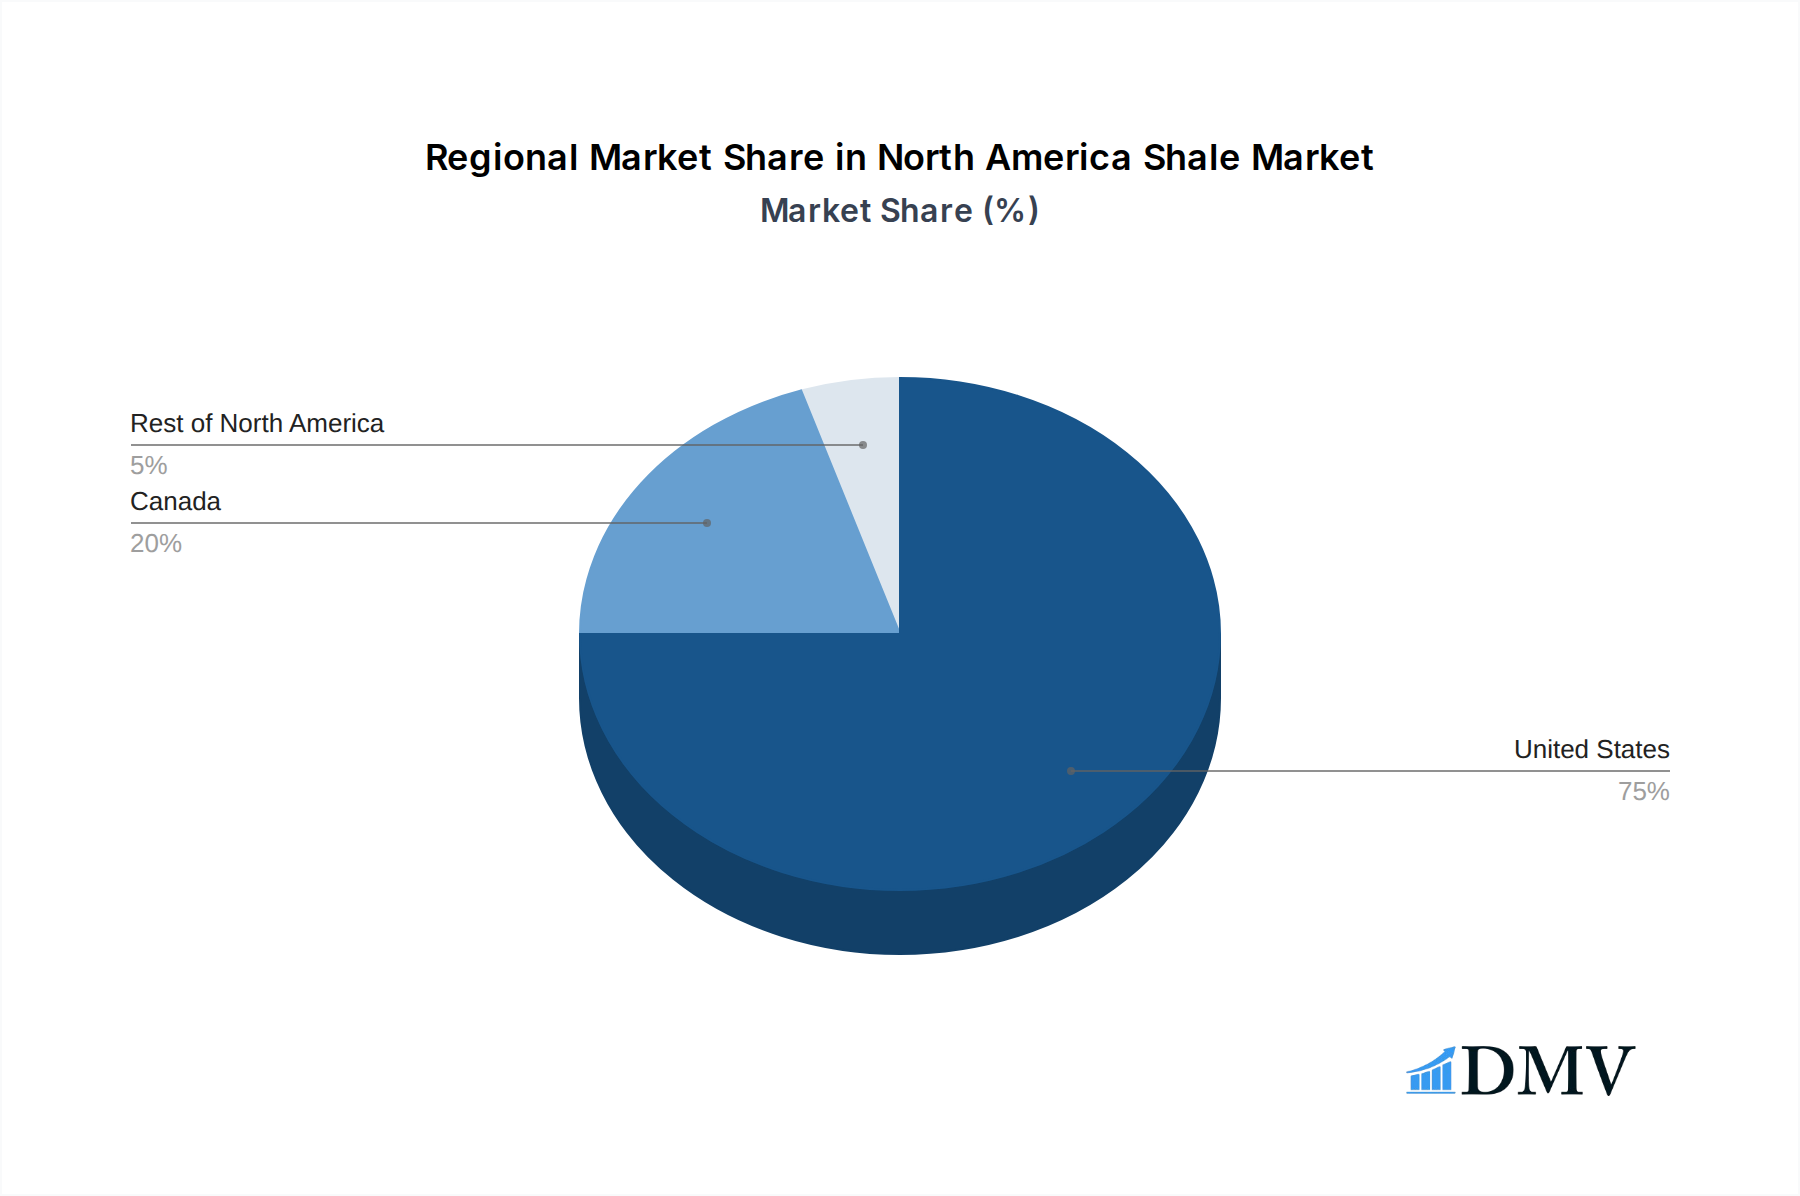
North America Shale Market Regional Market Share
Geographic Coverage of North America Shale Market
North America Shale Market REPORT HIGHLIGHTS
| Aspects | Details |
|---|---|
| Study Period | 2020-2034 |
| Base Year | 2025 |
| Estimated Year | 2026 |
| Forecast Period | 2026-2034 |
| Historical Period | 2020-2025 |
| Growth Rate | CAGR of 5.9% from 2020-2034 |
| Segmentation |
|
Table of Contents
- 1. Introduction
- 1.1. Research Scope
- 1.2. Market Segmentation
- 1.3. Research Objective
- 1.4. Definitions and Assumptions
- 2. Executive Summary
- 2.1. Market Snapshot
- 3. Market Dynamics
- 3.1. Market Drivers
- 3.2. Market Restrains
- 3.3. Market Trends
- 3.4. Market Opportunities
- 4. Market Factor Analysis
- 4.1. Porters Five Forces
- 4.1.1. Bargaining Power of Suppliers
- 4.1.2. Bargaining Power of Buyers
- 4.1.3. Threat of New Entrants
- 4.1.4. Threat of Substitutes
- 4.1.5. Competitive Rivalry
- 4.2. PESTEL analysis
- 4.3. BCG Analysis
- 4.3.1. Stars (High Growth, High Market Share)
- 4.3.2. Cash Cows (Low Growth, High Market Share)
- 4.3.3. Question Mark (High Growth, Low Market Share)
- 4.3.4. Dogs (Low Growth, Low Market Share)
- 4.4. Ansoff Matrix Analysis
- 4.5. Supply Chain Analysis
- 4.6. Regulatory Landscape
- 4.7. Current Market Potential and Opportunity Assessment (TAM–SAM–SOM Framework)
- 4.8. DMV Analyst Note
- 4.1. Porters Five Forces
- 5. Market Analysis, Insights and Forecast 2021-2033
- 5.1. Market Analysis, Insights and Forecast - by Production Analysis
- 5.2. Market Analysis, Insights and Forecast - by Consumption Analysis
- 5.3. Market Analysis, Insights and Forecast - by Import Market Analysis (Value & Volume)
- 5.4. Market Analysis, Insights and Forecast - by Export Market Analysis (Value & Volume)
- 5.5. Market Analysis, Insights and Forecast - by Price Trend Analysis
- 5.6. Market Analysis, Insights and Forecast - by Region
- 5.6.1. United States
- 5.6.2. Canada
- 5.6.3. Rest of North America
- 6. North America Shale Market Analysis, Insights and Forecast, 2021-2033
- 6.1. Market Analysis, Insights and Forecast - by Production Analysis
- 6.2. Market Analysis, Insights and Forecast - by Consumption Analysis
- 6.3. Market Analysis, Insights and Forecast - by Import Market Analysis (Value & Volume)
- 6.4. Market Analysis, Insights and Forecast - by Export Market Analysis (Value & Volume)
- 6.5. Market Analysis, Insights and Forecast - by Price Trend Analysis
- 7. United States North America Shale Market Analysis, Insights and Forecast, 2020-2032
- 7.1. Market Analysis, Insights and Forecast - by Production Analysis
- 7.2. Market Analysis, Insights and Forecast - by Consumption Analysis
- 7.3. Market Analysis, Insights and Forecast - by Import Market Analysis (Value & Volume)
- 7.4. Market Analysis, Insights and Forecast - by Export Market Analysis (Value & Volume)
- 7.5. Market Analysis, Insights and Forecast - by Price Trend Analysis
- 8. Canada North America Shale Market Analysis, Insights and Forecast, 2020-2032
- 8.1. Market Analysis, Insights and Forecast - by Production Analysis
- 8.2. Market Analysis, Insights and Forecast - by Consumption Analysis
- 8.3. Market Analysis, Insights and Forecast - by Import Market Analysis (Value & Volume)
- 8.4. Market Analysis, Insights and Forecast - by Export Market Analysis (Value & Volume)
- 8.5. Market Analysis, Insights and Forecast - by Price Trend Analysis
- 9. Rest of North America North America Shale Market Analysis, Insights and Forecast, 2020-2032
- 9.1. Market Analysis, Insights and Forecast - by Production Analysis
- 9.2. Market Analysis, Insights and Forecast - by Consumption Analysis
- 9.3. Market Analysis, Insights and Forecast - by Import Market Analysis (Value & Volume)
- 9.4. Market Analysis, Insights and Forecast - by Export Market Analysis (Value & Volume)
- 9.5. Market Analysis, Insights and Forecast - by Price Trend Analysis
- 10. Competitive Analysis
- 10.1. Company Profiles
- 10.1.1 ExxonMobil
- 10.1.1.1. Company Overview
- 10.1.1.2. Products
- 10.1.1.3. Company Financials
- 10.1.1.4. SWOT Analysis
- 10.1.2 Chevron
- 10.1.2.1. Company Overview
- 10.1.2.2. Products
- 10.1.2.3. Company Financials
- 10.1.2.4. SWOT Analysis
- 10.1.3 Marathon Petroleum
- 10.1.3.1. Company Overview
- 10.1.3.2. Products
- 10.1.3.3. Company Financials
- 10.1.3.4. SWOT Analysis
- 10.1.4 ConocoPhillips
- 10.1.4.1. Company Overview
- 10.1.4.2. Products
- 10.1.4.3. Company Financials
- 10.1.4.4. SWOT Analysis
- 10.1.5 Pioneer Natural Resources
- 10.1.5.1. Company Overview
- 10.1.5.2. Products
- 10.1.5.3. Company Financials
- 10.1.5.4. SWOT Analysis
- 10.1.1 ExxonMobil
- 10.2. Market Entropy
- 10.2.1 Company's Key Areas Served
- 10.2.2 Recent Developments
- 10.3. Company Market Share Analysis 2025
- 10.3.1 Top 5 Companies Market Share Analysis
- 10.3.2 Top 3 Companies Market Share Analysis
- 10.4. List of Potential Customers
- 11. Research Methodology
List of Figures
- Figure 1: North America Shale Market Revenue Breakdown (billion, %) by Product 2025 & 2033
- Figure 2: North America Shale Market Share (%) by Company 2025
List of Tables
- Table 1: North America Shale Market Revenue billion Forecast, by Production Analysis 2020 & 2033
- Table 2: North America Shale Market Revenue billion Forecast, by Consumption Analysis 2020 & 2033
- Table 3: North America Shale Market Revenue billion Forecast, by Import Market Analysis (Value & Volume) 2020 & 2033
- Table 4: North America Shale Market Revenue billion Forecast, by Export Market Analysis (Value & Volume) 2020 & 2033
- Table 5: North America Shale Market Revenue billion Forecast, by Price Trend Analysis 2020 & 2033
- Table 6: North America Shale Market Revenue billion Forecast, by Region 2020 & 2033
- Table 7: North America Shale Market Revenue billion Forecast, by Production Analysis 2020 & 2033
- Table 8: North America Shale Market Revenue billion Forecast, by Consumption Analysis 2020 & 2033
- Table 9: North America Shale Market Revenue billion Forecast, by Import Market Analysis (Value & Volume) 2020 & 2033
- Table 10: North America Shale Market Revenue billion Forecast, by Export Market Analysis (Value & Volume) 2020 & 2033
- Table 11: North America Shale Market Revenue billion Forecast, by Price Trend Analysis 2020 & 2033
- Table 12: North America Shale Market Revenue billion Forecast, by Country 2020 & 2033
- Table 13: North America Shale Market Revenue billion Forecast, by Production Analysis 2020 & 2033
- Table 14: North America Shale Market Revenue billion Forecast, by Consumption Analysis 2020 & 2033
- Table 15: North America Shale Market Revenue billion Forecast, by Import Market Analysis (Value & Volume) 2020 & 2033
- Table 16: North America Shale Market Revenue billion Forecast, by Export Market Analysis (Value & Volume) 2020 & 2033
- Table 17: North America Shale Market Revenue billion Forecast, by Price Trend Analysis 2020 & 2033
- Table 18: North America Shale Market Revenue billion Forecast, by Country 2020 & 2033
- Table 19: North America Shale Market Revenue billion Forecast, by Production Analysis 2020 & 2033
- Table 20: North America Shale Market Revenue billion Forecast, by Consumption Analysis 2020 & 2033
- Table 21: North America Shale Market Revenue billion Forecast, by Import Market Analysis (Value & Volume) 2020 & 2033
- Table 22: North America Shale Market Revenue billion Forecast, by Export Market Analysis (Value & Volume) 2020 & 2033
- Table 23: North America Shale Market Revenue billion Forecast, by Price Trend Analysis 2020 & 2033
- Table 24: North America Shale Market Revenue billion Forecast, by Country 2020 & 2033
Frequently Asked Questions
1. What is the projected Compound Annual Growth Rate (CAGR) of the North America Shale Market?
The projected CAGR is approximately 5.9%.
2. Which companies are prominent players in the North America Shale Market?
Key companies in the market include ExxonMobil, Chevron , Marathon Petroleum , ConocoPhillips , Pioneer Natural Resources.
3. What are the main segments of the North America Shale Market?
The market segments include Production Analysis, Consumption Analysis, Import Market Analysis (Value & Volume), Export Market Analysis (Value & Volume), Price Trend Analysis.
4. Can you provide details about the market size?
The market size is estimated to be USD 88.6 billion as of 2022.
5. What are some drivers contributing to market growth?
4.; Increasing Number of Offshore Operations 4.; Demand Coming for Unconventional Energy Sources.
6. What are the notable trends driving market growth?
Shale Gas to Dominate the Market.
7. Are there any restraints impacting market growth?
4.; Demand for Renewable Energy.
8. Can you provide examples of recent developments in the market?
N/A
9. What pricing options are available for accessing the report?
Pricing options include single-user, multi-user, and enterprise licenses priced at USD 4750, USD 5250, and USD 8750 respectively.
10. Is the market size provided in terms of value or volume?
The market size is provided in terms of value, measured in billion.
11. Are there any specific market keywords associated with the report?
Yes, the market keyword associated with the report is "North America Shale Market," which aids in identifying and referencing the specific market segment covered.
12. How do I determine which pricing option suits my needs best?
The pricing options vary based on user requirements and access needs. Individual users may opt for single-user licenses, while businesses requiring broader access may choose multi-user or enterprise licenses for cost-effective access to the report.
13. Are there any additional resources or data provided in the North America Shale Market report?
While the report offers comprehensive insights, it's advisable to review the specific contents or supplementary materials provided to ascertain if additional resources or data are available.
14. How can I stay updated on further developments or reports in the North America Shale Market?
To stay informed about further developments, trends, and reports in the North America Shale Market, consider subscribing to industry newsletters, following relevant companies and organizations, or regularly checking reputable industry news sources and publications.
Methodology
Step 1 - Identification of Relevant Samples Size from Population Database


Step 2 - Approaches for Defining Global Market Size (Value, Volume* & Price*)

Note*: In applicable scenarios
Step 3 - Data Sources
Primary Research
- Web Analytics
- Survey Reports
- Research Institute
- Latest Research Reports
- Opinion Leaders
Secondary Research
- Annual Reports
- White Paper
- Latest Press Release
- Industry Association
- Paid Database
- Investor Presentations

Step 4 - Data Triangulation
Involves using different sources of information in order to increase the validity of a study
These sources are likely to be stakeholders in a program - participants, other researchers, program staff, other community members, and so on.
Then we put all data in single framework & apply various statistical tools to find out the dynamic on the market.
During the analysis stage, feedback from the stakeholder groups would be compared to determine areas of agreement as well as areas of divergence