

Key Insights
The Qatari oil and gas industry is poised for significant growth and evolution, with a current market size estimated at $38 billion in 2023. This robust market is projected to expand at a compound annual growth rate (CAGR) of 4.2% through 2033, driven by sustained global energy demand and Qatar's strategic position as a leading liquefied natural gas (LNG) exporter. Key drivers include ongoing investments in upstream exploration and production to bolster reserves, coupled with substantial midstream infrastructure development aimed at enhancing processing and transportation capabilities. The downstream sector is also experiencing growth, with an increasing focus on petrochemical diversification and value-added products. Major players like Exxon Mobil Corporation, TotalEnergies SE, Qatargas Operating Company Limited, ConocoPhillips Company, and Qatar Petroleum are actively engaged in expanding their operations and capitalizing on new opportunities within this dynamic market. The industry's expansion is further supported by favorable government policies promoting investment and technological advancements.
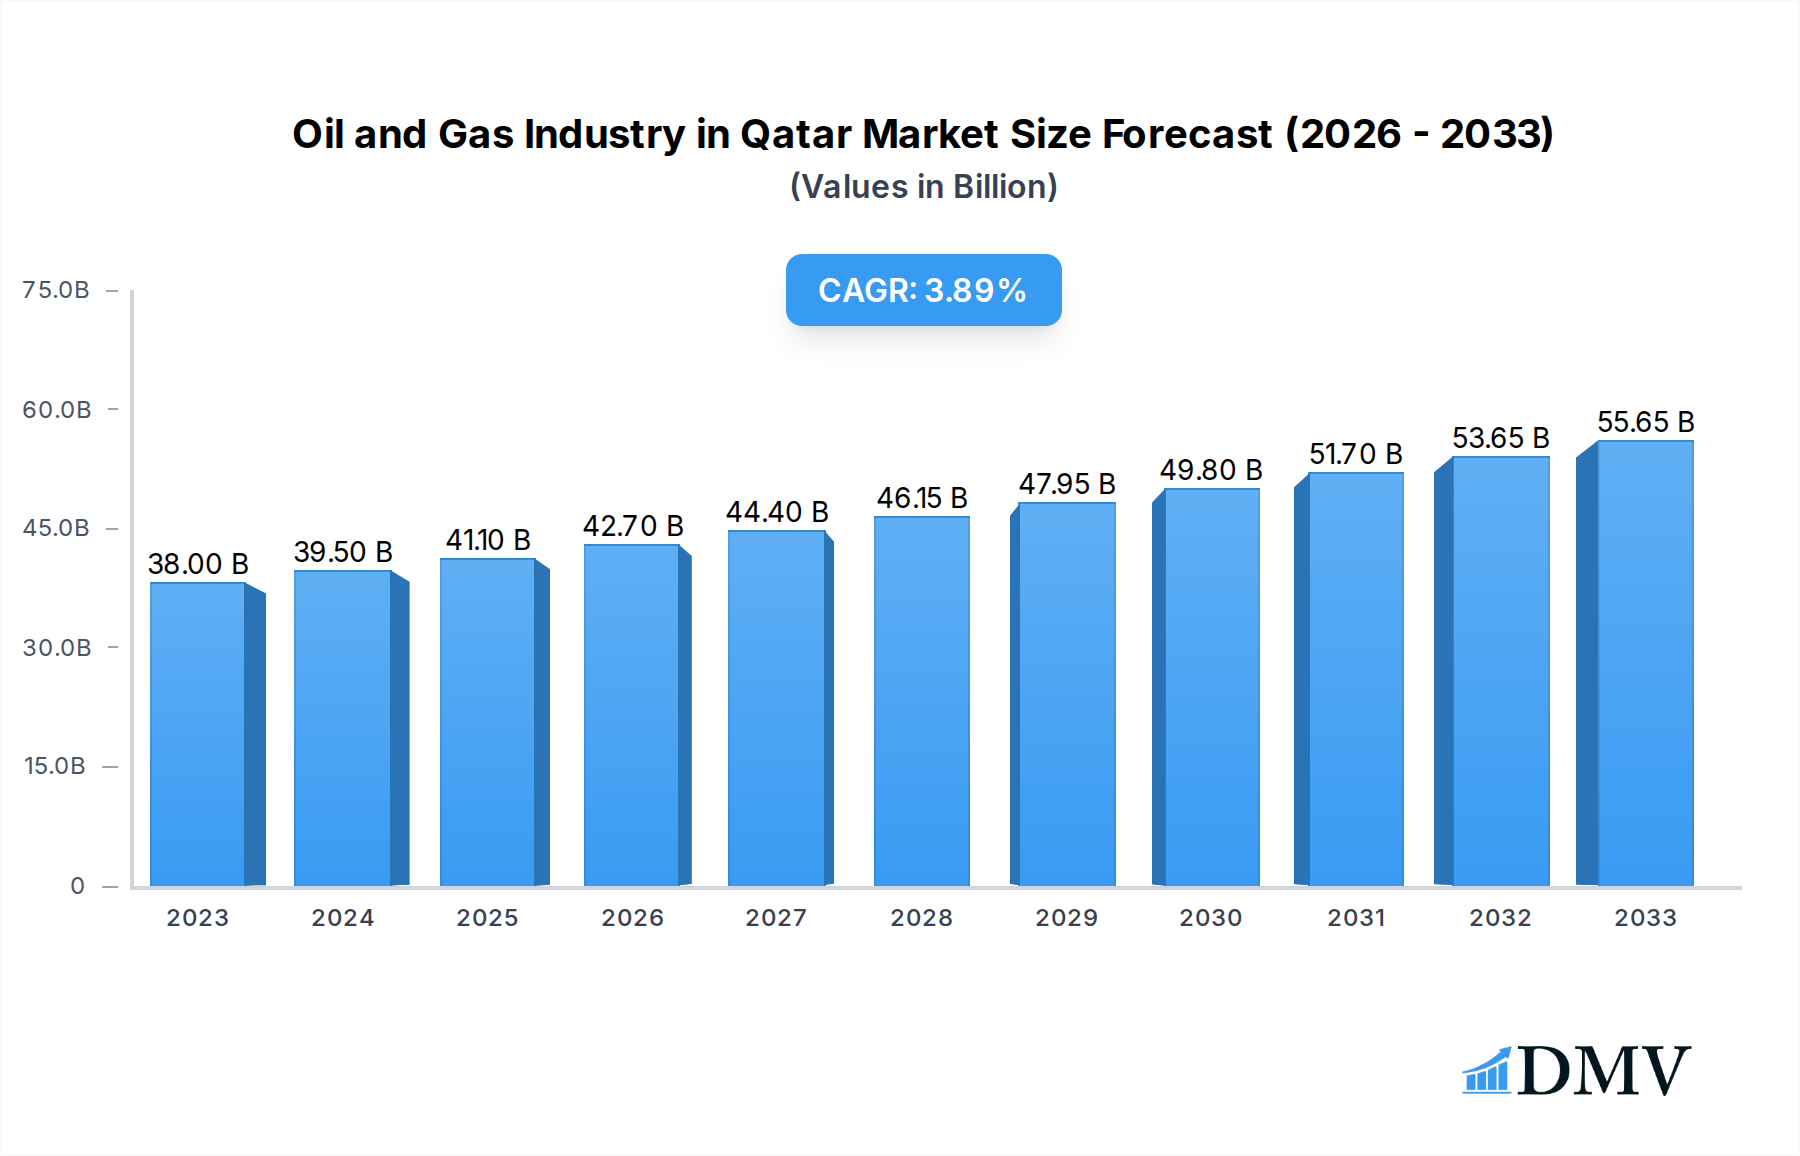
Oil and Gas Industry in Qatar Market Size (In Billion)
Looking ahead, the industry's trajectory will be shaped by a series of emerging trends. A significant trend is the increasing emphasis on sustainability and decarbonization, prompting investments in cleaner energy technologies and operational efficiencies. Qatar's commitment to reducing its carbon footprint while maintaining its status as a major energy supplier will be crucial. Furthermore, the ongoing expansion of LNG production capacity, exemplified by projects like the North Field Expansion, will solidify Qatar's position as a global energy leader. However, the industry faces potential restraints such as volatile global energy prices, geopolitical uncertainties, and increasing regulatory pressures related to environmental standards. Navigating these challenges will require strategic agility and continuous innovation to ensure long-term prosperity and competitiveness in the international energy landscape. The market is characterized by a strong presence in the Middle East and Africa, with growing influence in the Asia Pacific region due to high energy demand.

Oil and Gas Industry in Qatar Company Market Share
Oil and Gas Industry in Qatar Market Composition & Trends
The Qatari oil and gas sector is characterized by a high degree of concentration, dominated by state-owned entities and strategic joint ventures with global energy giants. Exxon Mobil Corporation, TotalEnergies SE, Qatargas Operating Company Limited, ConocoPhillips Company, and Qatar Petroleum are pivotal players, wielding significant market share. Innovation catalysts stem from substantial investments in liquefied natural gas (LNG) expansion projects and advanced exploration technologies, aimed at maximizing resource recovery and optimizing operational efficiency. The regulatory landscape, primarily shaped by the Ministry of Energy and Industry, fosters a stable investment climate with clear frameworks for production sharing and environmental compliance. While direct substitute products for core oil and gas commodities are limited in the short to medium term, the global shift towards renewable energy sources presents an indirect competitive pressure. End-user profiles are diverse, encompassing major industrial consumers, power generation facilities, and international markets for LNG and refined products. Merger and acquisition (M&A) activities, while less frequent due to the established dominance of state entities, are strategic, often involving asset optimization and technology acquisition. For instance, historical M&A values have often been in the tens of billions, reflecting the scale of these transactions.
- Market Concentration: Dominated by national oil company (NOC) and supermajor joint ventures.
- Innovation Catalysts: LNG expansion, advanced exploration, and decarbonization technologies.
- Regulatory Landscape: Stable, supportive frameworks for foreign investment and production.
- Substitute Products: Limited direct substitutes for core oil and gas, but growing pressure from renewables.
- End-User Profiles: Industrial, power generation, and international export markets.
- M&A Activities: Strategic, focused on asset optimization and technology transfer, with historical deal values in the billions.
Oil and Gas Industry in Qatar Industry Evolution
The evolution of the oil and gas industry in Qatar is a compelling narrative of strategic vision, massive investment, and technological prowess, transforming the nation into a global energy powerhouse. From its early exploration and production phases, the sector has consistently driven economic diversification and national development. The Upstream segment, encompassing exploration, drilling, and production, has witnessed significant growth, fueled by extensive offshore reserves, particularly the North Field, the world's largest non-associated natural gas field. Advancements in seismic imaging, horizontal drilling, and enhanced oil recovery (EOR) techniques have been instrumental in optimizing extraction rates and extending the lifespan of existing fields.
The Midstream segment, crucial for transporting and processing crude oil and natural gas, has seen colossal investments in pipeline infrastructure, storage facilities, and liquefaction plants. The rapid expansion of Qatar's Liquefied Natural Gas (LNG) production capacity, spearheaded by Qatargas Operating Company Limited, has been a defining feature of this evolution. This includes the development of massive LNG trains and export terminals, facilitating the efficient delivery of natural gas to global markets.
The Downstream segment, focused on refining crude oil into valuable products and petrochemicals, has also undergone substantial development. Qatar Petroleum has led initiatives to build and expand refineries, petrochemical complexes, and fertilizer plants, adding significant value to the nation's hydrocarbon resources. This vertical integration strategy has not only boosted export revenues but also fostered industrial growth within the country.
Technological advancements have been a constant theme, with a persistent drive towards digitalization, automation, and the adoption of cutting-edge technologies to improve safety, efficiency, and environmental performance. Shifting consumer demands, particularly the global impetus for cleaner energy sources and reduced carbon footprints, have also influenced the industry's trajectory. In response, Qatar has been increasingly investing in carbon capture, utilization, and storage (CCUS) technologies, as well as exploring opportunities in hydrogen and other lower-carbon fuels.
Market growth trajectories in the oil and gas industry in Qatar have been consistently upward, driven by its strategic position as a leading LNG exporter. The average annual growth rate for the sector has been robust, often exceeding xx% over the historical period, reflecting sustained demand for its primary commodities. Adoption metrics for new technologies, such as advanced drilling techniques, have shown a rapid uptake, often reaching over xx% implementation in new projects within a few years of their successful pilot phases. The industry's ability to adapt to evolving global energy landscapes and embrace innovation will be critical for its continued success in the forecast period.
Leading Regions, Countries, or Segments in Oil and Gas Industry in Qatar
The dominance within the Oil and Gas Industry in Qatar is unequivocally held by the Upstream segment, primarily driven by the unparalleled scale and significance of the North Field. This colossal natural gas reservoir underpins Qatar's status as a global energy leader. The strategic importance of this segment is underscored by sustained, multi-billion dollar investments in exploration, development, and production.
Key drivers for the dominance of the Upstream segment include:
- Massive Natural Gas Reserves: The North Field's vast reserves, estimated to be in the hundreds of trillions of cubic feet, provide a foundation for decades of production and export. This sheer volume makes Qatar a preeminent player in the global gas market.
- Technological Advancements in Extraction: Continuous investment in cutting-edge exploration and drilling technologies, including advanced seismic surveys and directional drilling, has allowed for efficient and cost-effective extraction from challenging offshore environments. Companies like Exxon Mobil Corporation and TotalEnergies SE bring world-class expertise in these areas.
- Strategic Joint Ventures: The formation of joint ventures between Qatar Petroleum and international energy majors like Exxon Mobil Corporation, TotalEnergies SE, and ConocoPhillips Company has provided access to capital, technology, and global market intelligence, further solidifying the Upstream segment's leading position.
- Government Support and Policy Framework: The Qatari government's unwavering commitment to developing its hydrocarbon resources, coupled with a stable and attractive investment policy framework, has consistently encouraged large-scale upstream projects. This includes the development of new LNG trains and associated infrastructure.
- Global Demand for LNG: The ever-increasing global demand for liquefied natural gas as a cleaner-burning alternative to coal and oil for power generation and industrial use directly benefits Qatar's Upstream operations and its subsequent Midstream and Downstream activities.
While the Midstream and Downstream segments are integral to Qatar's energy value chain, their growth and significance are intrinsically linked to the abundance and successful extraction of resources from the Upstream segment. The expansion of LNG liquefaction and export terminals in the Midstream, and the development of refineries and petrochemical plants in the Downstream, are all dependent on the consistent supply of feedstock from the North Field. Therefore, the Upstream segment, powered by its immense reserves and strategic investments, remains the foundational and dominant force in Qatar's oil and gas industry, setting the pace and direction for the entire sector. The projected investment in the North Field East and North Field South expansion projects alone amounts to tens of billions, underscoring the continued focus and dominance of this segment.
Oil and Gas Industry in Qatar Product Innovations
Qatar's oil and gas industry is actively pursuing product innovations to enhance efficiency and meet evolving market demands. This includes advancements in the production of ultra-low sulfur diesel and cleaner gasoline grades, crucial for meeting stringent environmental regulations globally. Furthermore, significant investments are being made in developing technologies for producing blue and green hydrogen and ammonia, leveraging the country's abundant natural gas and its growing renewable energy capacity. These innovations aim to reduce the carbon footprint of existing operations and position Qatar as a leader in the emerging hydrogen economy. Performance metrics for new fuel blends are demonstrating reduced emissions by xx%, while hydrogen production technologies are achieving energy efficiency rates of over xx%.
Propelling Factors for Oil and Gas Industry in Qatar Growth
The growth of Qatar's oil and gas industry is propelled by several key factors. Firstly, its vast and high-quality natural gas reserves, particularly the North Field, provide a consistent and substantial feedstock for production. Secondly, significant government investment, often in the tens of billions, directed towards expanding LNG export capacity and developing downstream petrochemical industries, fuels sector expansion. Thirdly, strategic partnerships with global energy majors like Exxon Mobil Corporation and TotalEnergies SE bring technological expertise and market access. Finally, the increasing global demand for cleaner energy sources, especially LNG, positions Qatar favorably in the international market.
Obstacles in the Oil and Gas Industry in Qatar Market
Despite its strengths, the oil and gas industry in Qatar faces several obstacles. Geopolitical instability in key export markets can create demand volatility, impacting revenue streams. Furthermore, the global push towards decarbonization and renewable energy sources presents a long-term challenge to fossil fuel demand, necessitating strategic diversification. Supply chain disruptions, as witnessed in recent global events, can also impact project timelines and costs. Finally, competition from other major energy producers vying for market share in the LNG sector requires continuous innovation and cost optimization.
Future Opportunities in Oil and Gas Industry in Qatar
Emerging opportunities for Qatar's oil and gas sector lie in the burgeoning demand for lower-carbon energy solutions. The expansion into blue and green hydrogen and ammonia production represents a significant avenue for growth, leveraging existing infrastructure and expertise. Furthermore, increased investment in petrochemicals and specialty chemicals can further diversify revenue streams and add higher value to hydrocarbon resources. Exploring new export markets for LNG and its derivatives, particularly in Asia, also presents substantial potential. Strategic collaborations on carbon capture, utilization, and storage (CCUS) technologies will be crucial for maintaining environmental sustainability and market access.
Major Players in the Oil and Gas Industry in Qatar Ecosystem
- Exxon Mobil Corporation
- TotalEnergies SE
- Qatargas Operating Company Limited
- ConocoPhillips Company
- Qatar Petroleum
Key Developments in Oil and Gas Industry in Qatar Industry
- 2022/2023: Major expansion of LNG production capacity with the North Field East and North Field South projects underway, signaling substantial investment in the tens of billions.
- 2023/2024: Increased focus on carbon capture, utilization, and storage (CCUS) initiatives to reduce the carbon footprint of operations.
- Ongoing: Continued advancements in downstream petrochemical production, aiming to diversify product portfolios and capture higher value.
- 2024: Exploration and pilot projects for blue and green hydrogen and ammonia production initiated, signifying a strategic pivot towards cleaner energy.
- 2025: Expected significant progress in the implementation of decarbonization strategies across major operational facilities.
Strategic Oil and Gas Industry in Qatar Market Forecast
The strategic forecast for Qatar's oil and gas industry indicates continued robust growth, largely driven by its dominant position in the global LNG market and its proactive diversification into lower-carbon energy carriers. Significant future opportunities lie in the expansion of blue and green hydrogen production, a sector poised for exponential growth. Continued investment in downstream petrochemicals will further enhance value addition and market reach. The market is expected to witness sustained demand for LNG, particularly from Asian markets, solidifying Qatar's role as a reliable energy supplier. Strategic collaborations and technological innovation will be paramount in navigating the evolving energy landscape and ensuring long-term prosperity, with projected market expansion in the coming years.
Oil and Gas Industry in Qatar Segmentation
- 1. Upstream
- 2. Midstream
- 3. Downstream
Oil and Gas Industry in Qatar Segmentation By Geography
-
1. North America
- 1.1. United States
- 1.2. Canada
- 1.3. Mexico
-
2. South America
- 2.1. Brazil
- 2.2. Argentina
- 2.3. Rest of South America
-
3. Europe
- 3.1. United Kingdom
- 3.2. Germany
- 3.3. France
- 3.4. Italy
- 3.5. Spain
- 3.6. Russia
- 3.7. Benelux
- 3.8. Nordics
- 3.9. Rest of Europe
-
4. Middle East & Africa
- 4.1. Turkey
- 4.2. Israel
- 4.3. GCC
- 4.4. North Africa
- 4.5. South Africa
- 4.6. Rest of Middle East & Africa
-
5. Asia Pacific
- 5.1. China
- 5.2. India
- 5.3. Japan
- 5.4. South Korea
- 5.5. ASEAN
- 5.6. Oceania
- 5.7. Rest of Asia Pacific
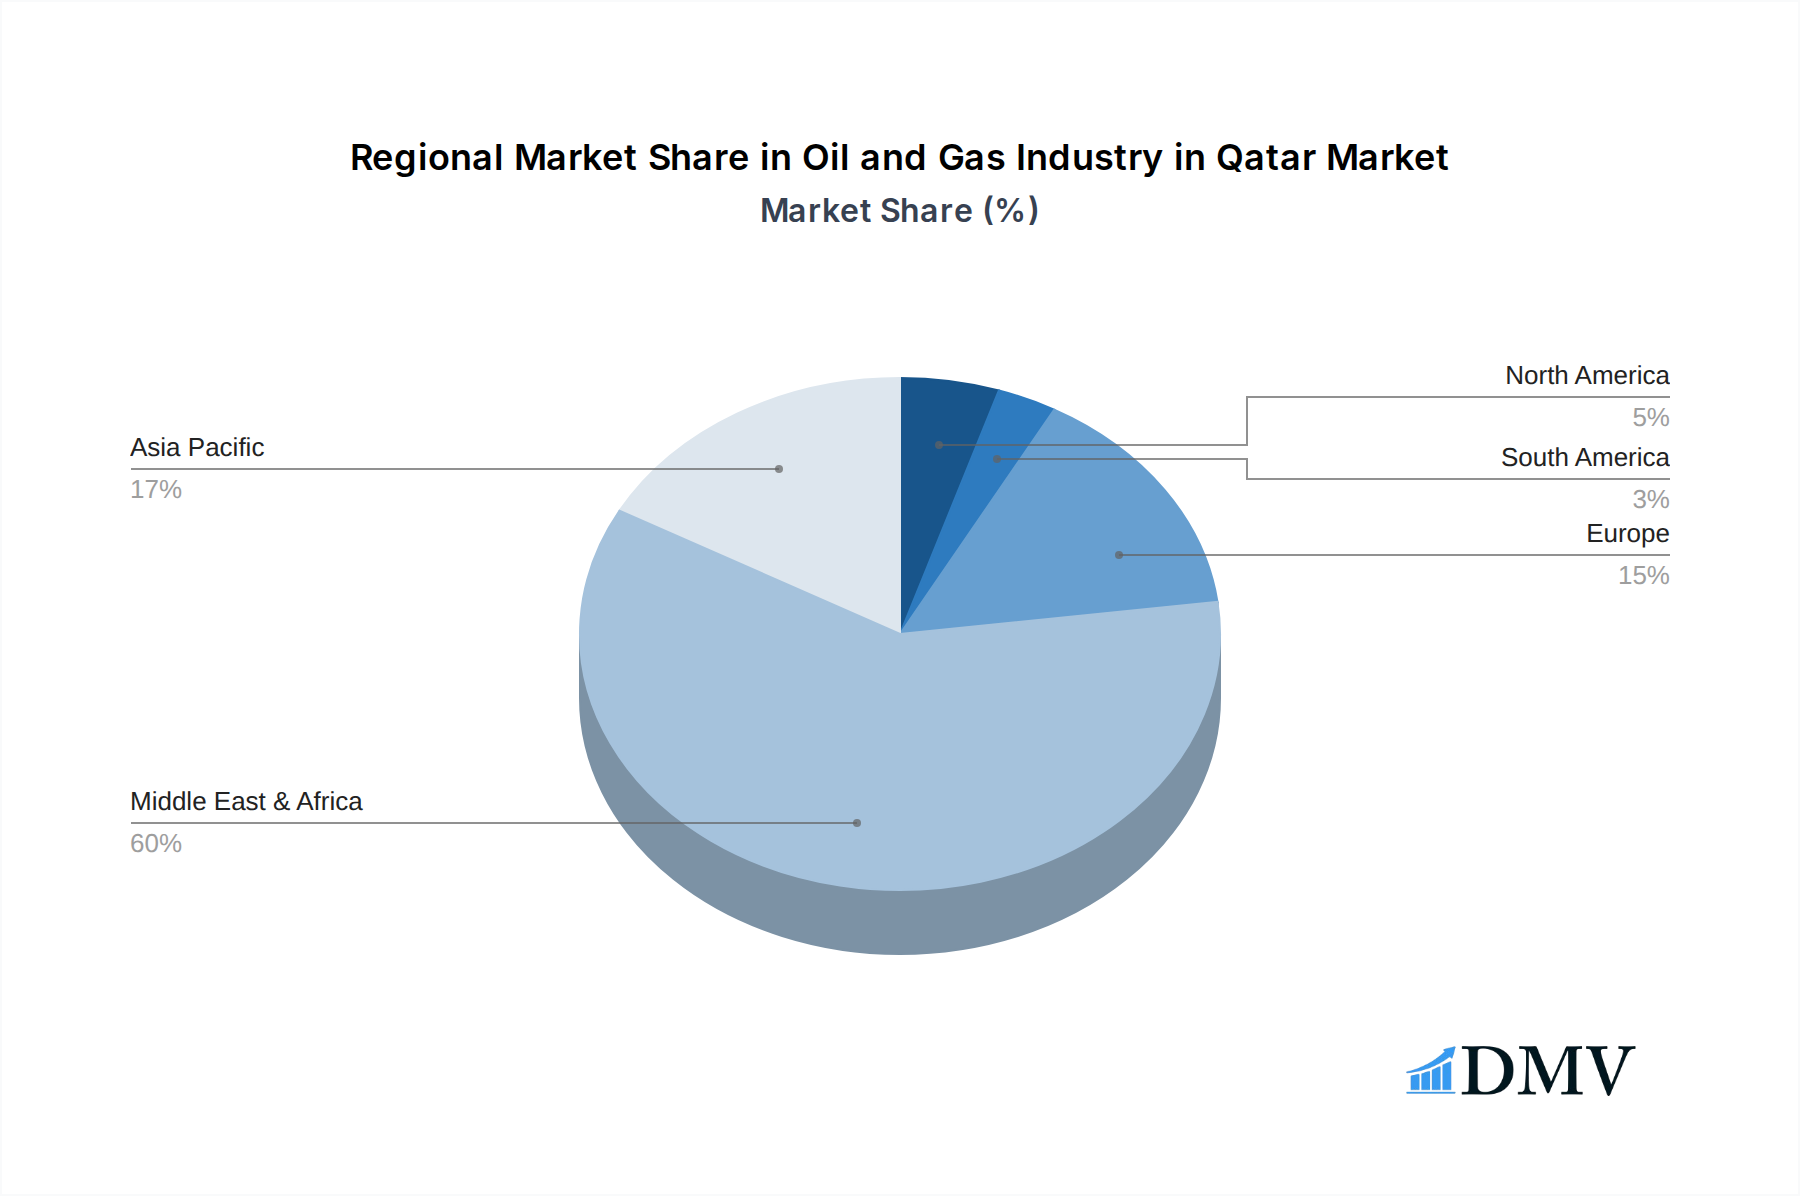
Oil and Gas Industry in Qatar Regional Market Share
Geographic Coverage of Oil and Gas Industry in Qatar
Oil and Gas Industry in Qatar REPORT HIGHLIGHTS
| Aspects | Details |
|---|---|
| Study Period | 2020-2034 |
| Base Year | 2025 |
| Estimated Year | 2026 |
| Forecast Period | 2026-2034 |
| Historical Period | 2020-2025 |
| Growth Rate | CAGR of 4.2% from 2020-2034 |
| Segmentation |
|
Table of Contents
- 1. Introduction
- 1.1. Research Scope
- 1.2. Market Segmentation
- 1.3. Research Objective
- 1.4. Definitions and Assumptions
- 2. Executive Summary
- 2.1. Market Snapshot
- 3. Market Dynamics
- 3.1. Market Drivers
- 3.2. Market Restrains
- 3.3. Market Trends
- 3.4. Market Opportunities
- 4. Market Factor Analysis
- 4.1. Porters Five Forces
- 4.1.1. Bargaining Power of Suppliers
- 4.1.2. Bargaining Power of Buyers
- 4.1.3. Threat of New Entrants
- 4.1.4. Threat of Substitutes
- 4.1.5. Competitive Rivalry
- 4.2. PESTEL analysis
- 4.3. BCG Analysis
- 4.3.1. Stars (High Growth, High Market Share)
- 4.3.2. Cash Cows (Low Growth, High Market Share)
- 4.3.3. Question Mark (High Growth, Low Market Share)
- 4.3.4. Dogs (Low Growth, Low Market Share)
- 4.4. Ansoff Matrix Analysis
- 4.5. Supply Chain Analysis
- 4.6. Regulatory Landscape
- 4.7. Current Market Potential and Opportunity Assessment (TAM–SAM–SOM Framework)
- 4.8. DMV Analyst Note
- 4.1. Porters Five Forces
- 5. Market Analysis, Insights and Forecast 2021-2033
- 5.1. Market Analysis, Insights and Forecast - by Upstream
- 5.2. Market Analysis, Insights and Forecast - by Midstream
- 5.3. Market Analysis, Insights and Forecast - by Downstream
- 5.4. Market Analysis, Insights and Forecast - by Region
- 5.4.1. North America
- 5.4.2. South America
- 5.4.3. Europe
- 5.4.4. Middle East & Africa
- 5.4.5. Asia Pacific
- 6. Global Oil and Gas Industry in Qatar Analysis, Insights and Forecast, 2021-2033
- 6.1. Market Analysis, Insights and Forecast - by Upstream
- 6.2. Market Analysis, Insights and Forecast - by Midstream
- 6.3. Market Analysis, Insights and Forecast - by Downstream
- 7. North America Oil and Gas Industry in Qatar Analysis, Insights and Forecast, 2020-2032
- 7.1. Market Analysis, Insights and Forecast - by Upstream
- 7.2. Market Analysis, Insights and Forecast - by Midstream
- 7.3. Market Analysis, Insights and Forecast - by Downstream
- 8. South America Oil and Gas Industry in Qatar Analysis, Insights and Forecast, 2020-2032
- 8.1. Market Analysis, Insights and Forecast - by Upstream
- 8.2. Market Analysis, Insights and Forecast - by Midstream
- 8.3. Market Analysis, Insights and Forecast - by Downstream
- 9. Europe Oil and Gas Industry in Qatar Analysis, Insights and Forecast, 2020-2032
- 9.1. Market Analysis, Insights and Forecast - by Upstream
- 9.2. Market Analysis, Insights and Forecast - by Midstream
- 9.3. Market Analysis, Insights and Forecast - by Downstream
- 10. Middle East & Africa Oil and Gas Industry in Qatar Analysis, Insights and Forecast, 2020-2032
- 10.1. Market Analysis, Insights and Forecast - by Upstream
- 10.2. Market Analysis, Insights and Forecast - by Midstream
- 10.3. Market Analysis, Insights and Forecast - by Downstream
- 11. Asia Pacific Oil and Gas Industry in Qatar Analysis, Insights and Forecast, 2020-2032
- 11.1. Market Analysis, Insights and Forecast - by Upstream
- 11.2. Market Analysis, Insights and Forecast - by Midstream
- 11.3. Market Analysis, Insights and Forecast - by Downstream
- 12. Competitive Analysis
- 12.1. Company Profiles
- 12.1.1 Exxon Mobil Corporation
- 12.1.1.1. Company Overview
- 12.1.1.2. Products
- 12.1.1.3. Company Financials
- 12.1.1.4. SWOT Analysis
- 12.1.2 TotalEnergies SE
- 12.1.2.1. Company Overview
- 12.1.2.2. Products
- 12.1.2.3. Company Financials
- 12.1.2.4. SWOT Analysis
- 12.1.3 Qatargas Operating Company Limited
- 12.1.3.1. Company Overview
- 12.1.3.2. Products
- 12.1.3.3. Company Financials
- 12.1.3.4. SWOT Analysis
- 12.1.4 ConocoPhillips Company
- 12.1.4.1. Company Overview
- 12.1.4.2. Products
- 12.1.4.3. Company Financials
- 12.1.4.4. SWOT Analysis
- 12.1.5 Qatar Petroleum
- 12.1.5.1. Company Overview
- 12.1.5.2. Products
- 12.1.5.3. Company Financials
- 12.1.5.4. SWOT Analysis
- 12.1.1 Exxon Mobil Corporation
- 12.2. Market Entropy
- 12.2.1 Company's Key Areas Served
- 12.2.2 Recent Developments
- 12.3. Company Market Share Analysis 2025
- 12.3.1 Top 5 Companies Market Share Analysis
- 12.3.2 Top 3 Companies Market Share Analysis
- 12.4. List of Potential Customers
- 13. Research Methodology
List of Figures
- Figure 1: Global Oil and Gas Industry in Qatar Revenue Breakdown (billion, %) by Region 2025 & 2033
- Figure 2: Global Oil and Gas Industry in Qatar Volume Breakdown (Tonnes, %) by Region 2025 & 2033
- Figure 3: North America Oil and Gas Industry in Qatar Revenue (billion), by Upstream 2025 & 2033
- Figure 4: North America Oil and Gas Industry in Qatar Volume (Tonnes), by Upstream 2025 & 2033
- Figure 5: North America Oil and Gas Industry in Qatar Revenue Share (%), by Upstream 2025 & 2033
- Figure 6: North America Oil and Gas Industry in Qatar Volume Share (%), by Upstream 2025 & 2033
- Figure 7: North America Oil and Gas Industry in Qatar Revenue (billion), by Midstream 2025 & 2033
- Figure 8: North America Oil and Gas Industry in Qatar Volume (Tonnes), by Midstream 2025 & 2033
- Figure 9: North America Oil and Gas Industry in Qatar Revenue Share (%), by Midstream 2025 & 2033
- Figure 10: North America Oil and Gas Industry in Qatar Volume Share (%), by Midstream 2025 & 2033
- Figure 11: North America Oil and Gas Industry in Qatar Revenue (billion), by Downstream 2025 & 2033
- Figure 12: North America Oil and Gas Industry in Qatar Volume (Tonnes), by Downstream 2025 & 2033
- Figure 13: North America Oil and Gas Industry in Qatar Revenue Share (%), by Downstream 2025 & 2033
- Figure 14: North America Oil and Gas Industry in Qatar Volume Share (%), by Downstream 2025 & 2033
- Figure 15: North America Oil and Gas Industry in Qatar Revenue (billion), by Country 2025 & 2033
- Figure 16: North America Oil and Gas Industry in Qatar Volume (Tonnes), by Country 2025 & 2033
- Figure 17: North America Oil and Gas Industry in Qatar Revenue Share (%), by Country 2025 & 2033
- Figure 18: North America Oil and Gas Industry in Qatar Volume Share (%), by Country 2025 & 2033
- Figure 19: South America Oil and Gas Industry in Qatar Revenue (billion), by Upstream 2025 & 2033
- Figure 20: South America Oil and Gas Industry in Qatar Volume (Tonnes), by Upstream 2025 & 2033
- Figure 21: South America Oil and Gas Industry in Qatar Revenue Share (%), by Upstream 2025 & 2033
- Figure 22: South America Oil and Gas Industry in Qatar Volume Share (%), by Upstream 2025 & 2033
- Figure 23: South America Oil and Gas Industry in Qatar Revenue (billion), by Midstream 2025 & 2033
- Figure 24: South America Oil and Gas Industry in Qatar Volume (Tonnes), by Midstream 2025 & 2033
- Figure 25: South America Oil and Gas Industry in Qatar Revenue Share (%), by Midstream 2025 & 2033
- Figure 26: South America Oil and Gas Industry in Qatar Volume Share (%), by Midstream 2025 & 2033
- Figure 27: South America Oil and Gas Industry in Qatar Revenue (billion), by Downstream 2025 & 2033
- Figure 28: South America Oil and Gas Industry in Qatar Volume (Tonnes), by Downstream 2025 & 2033
- Figure 29: South America Oil and Gas Industry in Qatar Revenue Share (%), by Downstream 2025 & 2033
- Figure 30: South America Oil and Gas Industry in Qatar Volume Share (%), by Downstream 2025 & 2033
- Figure 31: South America Oil and Gas Industry in Qatar Revenue (billion), by Country 2025 & 2033
- Figure 32: South America Oil and Gas Industry in Qatar Volume (Tonnes), by Country 2025 & 2033
- Figure 33: South America Oil and Gas Industry in Qatar Revenue Share (%), by Country 2025 & 2033
- Figure 34: South America Oil and Gas Industry in Qatar Volume Share (%), by Country 2025 & 2033
- Figure 35: Europe Oil and Gas Industry in Qatar Revenue (billion), by Upstream 2025 & 2033
- Figure 36: Europe Oil and Gas Industry in Qatar Volume (Tonnes), by Upstream 2025 & 2033
- Figure 37: Europe Oil and Gas Industry in Qatar Revenue Share (%), by Upstream 2025 & 2033
- Figure 38: Europe Oil and Gas Industry in Qatar Volume Share (%), by Upstream 2025 & 2033
- Figure 39: Europe Oil and Gas Industry in Qatar Revenue (billion), by Midstream 2025 & 2033
- Figure 40: Europe Oil and Gas Industry in Qatar Volume (Tonnes), by Midstream 2025 & 2033
- Figure 41: Europe Oil and Gas Industry in Qatar Revenue Share (%), by Midstream 2025 & 2033
- Figure 42: Europe Oil and Gas Industry in Qatar Volume Share (%), by Midstream 2025 & 2033
- Figure 43: Europe Oil and Gas Industry in Qatar Revenue (billion), by Downstream 2025 & 2033
- Figure 44: Europe Oil and Gas Industry in Qatar Volume (Tonnes), by Downstream 2025 & 2033
- Figure 45: Europe Oil and Gas Industry in Qatar Revenue Share (%), by Downstream 2025 & 2033
- Figure 46: Europe Oil and Gas Industry in Qatar Volume Share (%), by Downstream 2025 & 2033
- Figure 47: Europe Oil and Gas Industry in Qatar Revenue (billion), by Country 2025 & 2033
- Figure 48: Europe Oil and Gas Industry in Qatar Volume (Tonnes), by Country 2025 & 2033
- Figure 49: Europe Oil and Gas Industry in Qatar Revenue Share (%), by Country 2025 & 2033
- Figure 50: Europe Oil and Gas Industry in Qatar Volume Share (%), by Country 2025 & 2033
- Figure 51: Middle East & Africa Oil and Gas Industry in Qatar Revenue (billion), by Upstream 2025 & 2033
- Figure 52: Middle East & Africa Oil and Gas Industry in Qatar Volume (Tonnes), by Upstream 2025 & 2033
- Figure 53: Middle East & Africa Oil and Gas Industry in Qatar Revenue Share (%), by Upstream 2025 & 2033
- Figure 54: Middle East & Africa Oil and Gas Industry in Qatar Volume Share (%), by Upstream 2025 & 2033
- Figure 55: Middle East & Africa Oil and Gas Industry in Qatar Revenue (billion), by Midstream 2025 & 2033
- Figure 56: Middle East & Africa Oil and Gas Industry in Qatar Volume (Tonnes), by Midstream 2025 & 2033
- Figure 57: Middle East & Africa Oil and Gas Industry in Qatar Revenue Share (%), by Midstream 2025 & 2033
- Figure 58: Middle East & Africa Oil and Gas Industry in Qatar Volume Share (%), by Midstream 2025 & 2033
- Figure 59: Middle East & Africa Oil and Gas Industry in Qatar Revenue (billion), by Downstream 2025 & 2033
- Figure 60: Middle East & Africa Oil and Gas Industry in Qatar Volume (Tonnes), by Downstream 2025 & 2033
- Figure 61: Middle East & Africa Oil and Gas Industry in Qatar Revenue Share (%), by Downstream 2025 & 2033
- Figure 62: Middle East & Africa Oil and Gas Industry in Qatar Volume Share (%), by Downstream 2025 & 2033
- Figure 63: Middle East & Africa Oil and Gas Industry in Qatar Revenue (billion), by Country 2025 & 2033
- Figure 64: Middle East & Africa Oil and Gas Industry in Qatar Volume (Tonnes), by Country 2025 & 2033
- Figure 65: Middle East & Africa Oil and Gas Industry in Qatar Revenue Share (%), by Country 2025 & 2033
- Figure 66: Middle East & Africa Oil and Gas Industry in Qatar Volume Share (%), by Country 2025 & 2033
- Figure 67: Asia Pacific Oil and Gas Industry in Qatar Revenue (billion), by Upstream 2025 & 2033
- Figure 68: Asia Pacific Oil and Gas Industry in Qatar Volume (Tonnes), by Upstream 2025 & 2033
- Figure 69: Asia Pacific Oil and Gas Industry in Qatar Revenue Share (%), by Upstream 2025 & 2033
- Figure 70: Asia Pacific Oil and Gas Industry in Qatar Volume Share (%), by Upstream 2025 & 2033
- Figure 71: Asia Pacific Oil and Gas Industry in Qatar Revenue (billion), by Midstream 2025 & 2033
- Figure 72: Asia Pacific Oil and Gas Industry in Qatar Volume (Tonnes), by Midstream 2025 & 2033
- Figure 73: Asia Pacific Oil and Gas Industry in Qatar Revenue Share (%), by Midstream 2025 & 2033
- Figure 74: Asia Pacific Oil and Gas Industry in Qatar Volume Share (%), by Midstream 2025 & 2033
- Figure 75: Asia Pacific Oil and Gas Industry in Qatar Revenue (billion), by Downstream 2025 & 2033
- Figure 76: Asia Pacific Oil and Gas Industry in Qatar Volume (Tonnes), by Downstream 2025 & 2033
- Figure 77: Asia Pacific Oil and Gas Industry in Qatar Revenue Share (%), by Downstream 2025 & 2033
- Figure 78: Asia Pacific Oil and Gas Industry in Qatar Volume Share (%), by Downstream 2025 & 2033
- Figure 79: Asia Pacific Oil and Gas Industry in Qatar Revenue (billion), by Country 2025 & 2033
- Figure 80: Asia Pacific Oil and Gas Industry in Qatar Volume (Tonnes), by Country 2025 & 2033
- Figure 81: Asia Pacific Oil and Gas Industry in Qatar Revenue Share (%), by Country 2025 & 2033
- Figure 82: Asia Pacific Oil and Gas Industry in Qatar Volume Share (%), by Country 2025 & 2033
List of Tables
- Table 1: Global Oil and Gas Industry in Qatar Revenue billion Forecast, by Upstream 2020 & 2033
- Table 2: Global Oil and Gas Industry in Qatar Volume Tonnes Forecast, by Upstream 2020 & 2033
- Table 3: Global Oil and Gas Industry in Qatar Revenue billion Forecast, by Midstream 2020 & 2033
- Table 4: Global Oil and Gas Industry in Qatar Volume Tonnes Forecast, by Midstream 2020 & 2033
- Table 5: Global Oil and Gas Industry in Qatar Revenue billion Forecast, by Downstream 2020 & 2033
- Table 6: Global Oil and Gas Industry in Qatar Volume Tonnes Forecast, by Downstream 2020 & 2033
- Table 7: Global Oil and Gas Industry in Qatar Revenue billion Forecast, by Region 2020 & 2033
- Table 8: Global Oil and Gas Industry in Qatar Volume Tonnes Forecast, by Region 2020 & 2033
- Table 9: Global Oil and Gas Industry in Qatar Revenue billion Forecast, by Upstream 2020 & 2033
- Table 10: Global Oil and Gas Industry in Qatar Volume Tonnes Forecast, by Upstream 2020 & 2033
- Table 11: Global Oil and Gas Industry in Qatar Revenue billion Forecast, by Midstream 2020 & 2033
- Table 12: Global Oil and Gas Industry in Qatar Volume Tonnes Forecast, by Midstream 2020 & 2033
- Table 13: Global Oil and Gas Industry in Qatar Revenue billion Forecast, by Downstream 2020 & 2033
- Table 14: Global Oil and Gas Industry in Qatar Volume Tonnes Forecast, by Downstream 2020 & 2033
- Table 15: Global Oil and Gas Industry in Qatar Revenue billion Forecast, by Country 2020 & 2033
- Table 16: Global Oil and Gas Industry in Qatar Volume Tonnes Forecast, by Country 2020 & 2033
- Table 17: United States Oil and Gas Industry in Qatar Revenue (billion) Forecast, by Application 2020 & 2033
- Table 18: United States Oil and Gas Industry in Qatar Volume (Tonnes) Forecast, by Application 2020 & 2033
- Table 19: Canada Oil and Gas Industry in Qatar Revenue (billion) Forecast, by Application 2020 & 2033
- Table 20: Canada Oil and Gas Industry in Qatar Volume (Tonnes) Forecast, by Application 2020 & 2033
- Table 21: Mexico Oil and Gas Industry in Qatar Revenue (billion) Forecast, by Application 2020 & 2033
- Table 22: Mexico Oil and Gas Industry in Qatar Volume (Tonnes) Forecast, by Application 2020 & 2033
- Table 23: Global Oil and Gas Industry in Qatar Revenue billion Forecast, by Upstream 2020 & 2033
- Table 24: Global Oil and Gas Industry in Qatar Volume Tonnes Forecast, by Upstream 2020 & 2033
- Table 25: Global Oil and Gas Industry in Qatar Revenue billion Forecast, by Midstream 2020 & 2033
- Table 26: Global Oil and Gas Industry in Qatar Volume Tonnes Forecast, by Midstream 2020 & 2033
- Table 27: Global Oil and Gas Industry in Qatar Revenue billion Forecast, by Downstream 2020 & 2033
- Table 28: Global Oil and Gas Industry in Qatar Volume Tonnes Forecast, by Downstream 2020 & 2033
- Table 29: Global Oil and Gas Industry in Qatar Revenue billion Forecast, by Country 2020 & 2033
- Table 30: Global Oil and Gas Industry in Qatar Volume Tonnes Forecast, by Country 2020 & 2033
- Table 31: Brazil Oil and Gas Industry in Qatar Revenue (billion) Forecast, by Application 2020 & 2033
- Table 32: Brazil Oil and Gas Industry in Qatar Volume (Tonnes) Forecast, by Application 2020 & 2033
- Table 33: Argentina Oil and Gas Industry in Qatar Revenue (billion) Forecast, by Application 2020 & 2033
- Table 34: Argentina Oil and Gas Industry in Qatar Volume (Tonnes) Forecast, by Application 2020 & 2033
- Table 35: Rest of South America Oil and Gas Industry in Qatar Revenue (billion) Forecast, by Application 2020 & 2033
- Table 36: Rest of South America Oil and Gas Industry in Qatar Volume (Tonnes) Forecast, by Application 2020 & 2033
- Table 37: Global Oil and Gas Industry in Qatar Revenue billion Forecast, by Upstream 2020 & 2033
- Table 38: Global Oil and Gas Industry in Qatar Volume Tonnes Forecast, by Upstream 2020 & 2033
- Table 39: Global Oil and Gas Industry in Qatar Revenue billion Forecast, by Midstream 2020 & 2033
- Table 40: Global Oil and Gas Industry in Qatar Volume Tonnes Forecast, by Midstream 2020 & 2033
- Table 41: Global Oil and Gas Industry in Qatar Revenue billion Forecast, by Downstream 2020 & 2033
- Table 42: Global Oil and Gas Industry in Qatar Volume Tonnes Forecast, by Downstream 2020 & 2033
- Table 43: Global Oil and Gas Industry in Qatar Revenue billion Forecast, by Country 2020 & 2033
- Table 44: Global Oil and Gas Industry in Qatar Volume Tonnes Forecast, by Country 2020 & 2033
- Table 45: United Kingdom Oil and Gas Industry in Qatar Revenue (billion) Forecast, by Application 2020 & 2033
- Table 46: United Kingdom Oil and Gas Industry in Qatar Volume (Tonnes) Forecast, by Application 2020 & 2033
- Table 47: Germany Oil and Gas Industry in Qatar Revenue (billion) Forecast, by Application 2020 & 2033
- Table 48: Germany Oil and Gas Industry in Qatar Volume (Tonnes) Forecast, by Application 2020 & 2033
- Table 49: France Oil and Gas Industry in Qatar Revenue (billion) Forecast, by Application 2020 & 2033
- Table 50: France Oil and Gas Industry in Qatar Volume (Tonnes) Forecast, by Application 2020 & 2033
- Table 51: Italy Oil and Gas Industry in Qatar Revenue (billion) Forecast, by Application 2020 & 2033
- Table 52: Italy Oil and Gas Industry in Qatar Volume (Tonnes) Forecast, by Application 2020 & 2033
- Table 53: Spain Oil and Gas Industry in Qatar Revenue (billion) Forecast, by Application 2020 & 2033
- Table 54: Spain Oil and Gas Industry in Qatar Volume (Tonnes) Forecast, by Application 2020 & 2033
- Table 55: Russia Oil and Gas Industry in Qatar Revenue (billion) Forecast, by Application 2020 & 2033
- Table 56: Russia Oil and Gas Industry in Qatar Volume (Tonnes) Forecast, by Application 2020 & 2033
- Table 57: Benelux Oil and Gas Industry in Qatar Revenue (billion) Forecast, by Application 2020 & 2033
- Table 58: Benelux Oil and Gas Industry in Qatar Volume (Tonnes) Forecast, by Application 2020 & 2033
- Table 59: Nordics Oil and Gas Industry in Qatar Revenue (billion) Forecast, by Application 2020 & 2033
- Table 60: Nordics Oil and Gas Industry in Qatar Volume (Tonnes) Forecast, by Application 2020 & 2033
- Table 61: Rest of Europe Oil and Gas Industry in Qatar Revenue (billion) Forecast, by Application 2020 & 2033
- Table 62: Rest of Europe Oil and Gas Industry in Qatar Volume (Tonnes) Forecast, by Application 2020 & 2033
- Table 63: Global Oil and Gas Industry in Qatar Revenue billion Forecast, by Upstream 2020 & 2033
- Table 64: Global Oil and Gas Industry in Qatar Volume Tonnes Forecast, by Upstream 2020 & 2033
- Table 65: Global Oil and Gas Industry in Qatar Revenue billion Forecast, by Midstream 2020 & 2033
- Table 66: Global Oil and Gas Industry in Qatar Volume Tonnes Forecast, by Midstream 2020 & 2033
- Table 67: Global Oil and Gas Industry in Qatar Revenue billion Forecast, by Downstream 2020 & 2033
- Table 68: Global Oil and Gas Industry in Qatar Volume Tonnes Forecast, by Downstream 2020 & 2033
- Table 69: Global Oil and Gas Industry in Qatar Revenue billion Forecast, by Country 2020 & 2033
- Table 70: Global Oil and Gas Industry in Qatar Volume Tonnes Forecast, by Country 2020 & 2033
- Table 71: Turkey Oil and Gas Industry in Qatar Revenue (billion) Forecast, by Application 2020 & 2033
- Table 72: Turkey Oil and Gas Industry in Qatar Volume (Tonnes) Forecast, by Application 2020 & 2033
- Table 73: Israel Oil and Gas Industry in Qatar Revenue (billion) Forecast, by Application 2020 & 2033
- Table 74: Israel Oil and Gas Industry in Qatar Volume (Tonnes) Forecast, by Application 2020 & 2033
- Table 75: GCC Oil and Gas Industry in Qatar Revenue (billion) Forecast, by Application 2020 & 2033
- Table 76: GCC Oil and Gas Industry in Qatar Volume (Tonnes) Forecast, by Application 2020 & 2033
- Table 77: North Africa Oil and Gas Industry in Qatar Revenue (billion) Forecast, by Application 2020 & 2033
- Table 78: North Africa Oil and Gas Industry in Qatar Volume (Tonnes) Forecast, by Application 2020 & 2033
- Table 79: South Africa Oil and Gas Industry in Qatar Revenue (billion) Forecast, by Application 2020 & 2033
- Table 80: South Africa Oil and Gas Industry in Qatar Volume (Tonnes) Forecast, by Application 2020 & 2033
- Table 81: Rest of Middle East & Africa Oil and Gas Industry in Qatar Revenue (billion) Forecast, by Application 2020 & 2033
- Table 82: Rest of Middle East & Africa Oil and Gas Industry in Qatar Volume (Tonnes) Forecast, by Application 2020 & 2033
- Table 83: Global Oil and Gas Industry in Qatar Revenue billion Forecast, by Upstream 2020 & 2033
- Table 84: Global Oil and Gas Industry in Qatar Volume Tonnes Forecast, by Upstream 2020 & 2033
- Table 85: Global Oil and Gas Industry in Qatar Revenue billion Forecast, by Midstream 2020 & 2033
- Table 86: Global Oil and Gas Industry in Qatar Volume Tonnes Forecast, by Midstream 2020 & 2033
- Table 87: Global Oil and Gas Industry in Qatar Revenue billion Forecast, by Downstream 2020 & 2033
- Table 88: Global Oil and Gas Industry in Qatar Volume Tonnes Forecast, by Downstream 2020 & 2033
- Table 89: Global Oil and Gas Industry in Qatar Revenue billion Forecast, by Country 2020 & 2033
- Table 90: Global Oil and Gas Industry in Qatar Volume Tonnes Forecast, by Country 2020 & 2033
- Table 91: China Oil and Gas Industry in Qatar Revenue (billion) Forecast, by Application 2020 & 2033
- Table 92: China Oil and Gas Industry in Qatar Volume (Tonnes) Forecast, by Application 2020 & 2033
- Table 93: India Oil and Gas Industry in Qatar Revenue (billion) Forecast, by Application 2020 & 2033
- Table 94: India Oil and Gas Industry in Qatar Volume (Tonnes) Forecast, by Application 2020 & 2033
- Table 95: Japan Oil and Gas Industry in Qatar Revenue (billion) Forecast, by Application 2020 & 2033
- Table 96: Japan Oil and Gas Industry in Qatar Volume (Tonnes) Forecast, by Application 2020 & 2033
- Table 97: South Korea Oil and Gas Industry in Qatar Revenue (billion) Forecast, by Application 2020 & 2033
- Table 98: South Korea Oil and Gas Industry in Qatar Volume (Tonnes) Forecast, by Application 2020 & 2033
- Table 99: ASEAN Oil and Gas Industry in Qatar Revenue (billion) Forecast, by Application 2020 & 2033
- Table 100: ASEAN Oil and Gas Industry in Qatar Volume (Tonnes) Forecast, by Application 2020 & 2033
- Table 101: Oceania Oil and Gas Industry in Qatar Revenue (billion) Forecast, by Application 2020 & 2033
- Table 102: Oceania Oil and Gas Industry in Qatar Volume (Tonnes) Forecast, by Application 2020 & 2033
- Table 103: Rest of Asia Pacific Oil and Gas Industry in Qatar Revenue (billion) Forecast, by Application 2020 & 2033
- Table 104: Rest of Asia Pacific Oil and Gas Industry in Qatar Volume (Tonnes) Forecast, by Application 2020 & 2033
Frequently Asked Questions
1. What is the projected Compound Annual Growth Rate (CAGR) of the Oil and Gas Industry in Qatar?
The projected CAGR is approximately 4.2%.
2. Which companies are prominent players in the Oil and Gas Industry in Qatar?
Key companies in the market include Exxon Mobil Corporation, TotalEnergies SE, Qatargas Operating Company Limited, ConocoPhillips Company, Qatar Petroleum.
3. What are the main segments of the Oil and Gas Industry in Qatar?
The market segments include Upstream, Midstream, Downstream.
4. Can you provide details about the market size?
The market size is estimated to be USD 38 billion as of 2022.
5. What are some drivers contributing to market growth?
Drivers; Restraints.
6. What are the notable trends driving market growth?
Upstream Segment to Dominate the Market.
7. Are there any restraints impacting market growth?
4.; Political Instability and Militant Attacks on Pipeline Infrastructure.
8. Can you provide examples of recent developments in the market?
N/A
9. What pricing options are available for accessing the report?
Pricing options include single-user, multi-user, and enterprise licenses priced at USD 3800, USD 4500, and USD 5800 respectively.
10. Is the market size provided in terms of value or volume?
The market size is provided in terms of value, measured in billion and volume, measured in Tonnes.
11. Are there any specific market keywords associated with the report?
Yes, the market keyword associated with the report is "Oil and Gas Industry in Qatar," which aids in identifying and referencing the specific market segment covered.
12. How do I determine which pricing option suits my needs best?
The pricing options vary based on user requirements and access needs. Individual users may opt for single-user licenses, while businesses requiring broader access may choose multi-user or enterprise licenses for cost-effective access to the report.
13. Are there any additional resources or data provided in the Oil and Gas Industry in Qatar report?
While the report offers comprehensive insights, it's advisable to review the specific contents or supplementary materials provided to ascertain if additional resources or data are available.
14. How can I stay updated on further developments or reports in the Oil and Gas Industry in Qatar?
To stay informed about further developments, trends, and reports in the Oil and Gas Industry in Qatar, consider subscribing to industry newsletters, following relevant companies and organizations, or regularly checking reputable industry news sources and publications.
Methodology
Step 1 - Identification of Relevant Samples Size from Population Database


Step 2 - Approaches for Defining Global Market Size (Value, Volume* & Price*)

Note*: In applicable scenarios
Step 3 - Data Sources
Primary Research
- Web Analytics
- Survey Reports
- Research Institute
- Latest Research Reports
- Opinion Leaders
Secondary Research
- Annual Reports
- White Paper
- Latest Press Release
- Industry Association
- Paid Database
- Investor Presentations

Step 4 - Data Triangulation
Involves using different sources of information in order to increase the validity of a study
These sources are likely to be stakeholders in a program - participants, other researchers, program staff, other community members, and so on.
Then we put all data in single framework & apply various statistical tools to find out the dynamic on the market.
During the analysis stage, feedback from the stakeholder groups would be compared to determine areas of agreement as well as areas of divergence