

Key Insights
The global HUD reflector market is poised for significant expansion, driven by the escalating adoption of advanced driver-assistance systems (ADAS) and the increasing demand for augmented reality head-up displays (AR-HUDs) in both electric vehicles (EVs) and traditional fuel vehicles. The market is estimated to be valued at approximately $1,500 million in 2025, with a projected Compound Annual Growth Rate (CAGR) of around 15% through 2033. This robust growth is fueled by the automotive industry's focus on enhancing driver safety and the in-car user experience through intuitive, information-rich displays. The integration of HUD reflectors is crucial for projecting vital driving information, navigation, and alerts directly into the driver's line of sight, thereby minimizing distractions and improving situational awareness. Emerging trends such as miniaturization of HUD units, improved optical performance, and the development of more sophisticated AR overlays will further stimulate market demand.
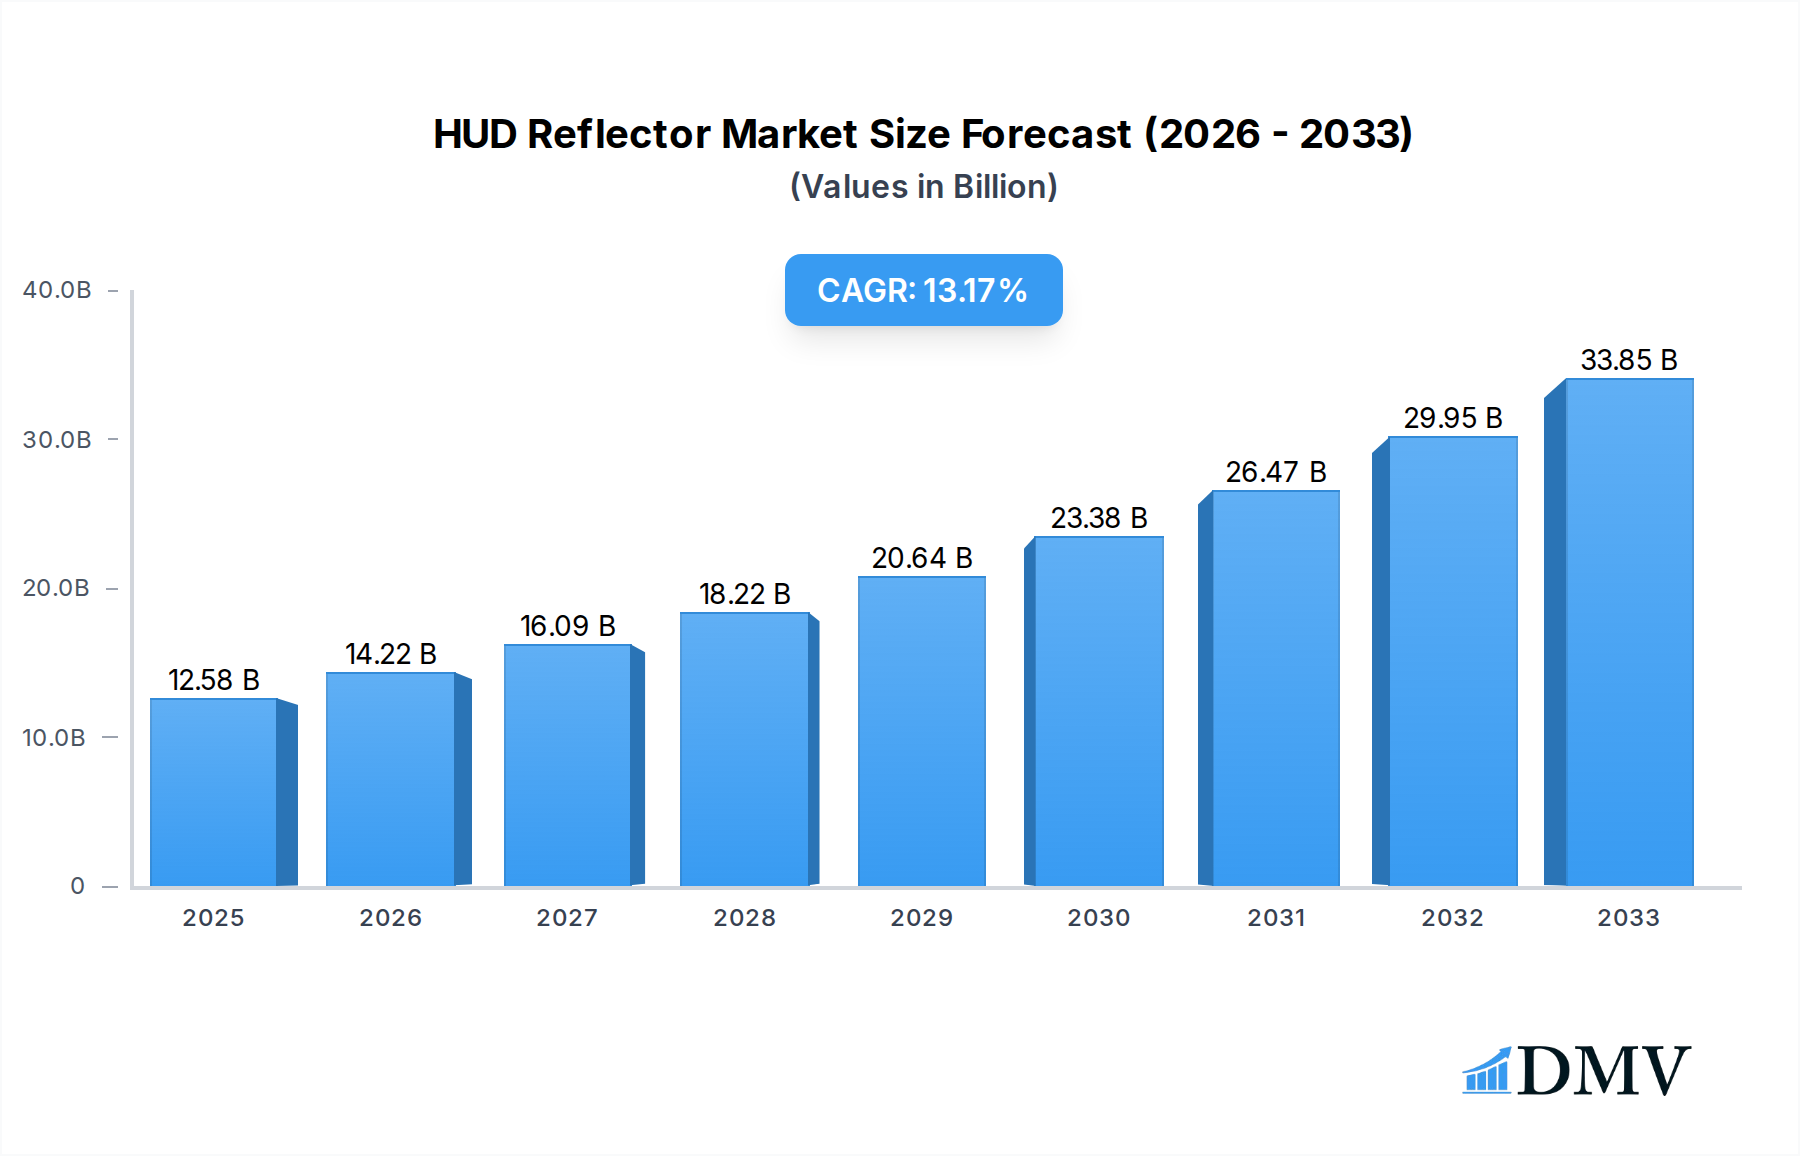
HUD Reflector Market Size (In Billion)
Geographically, Asia Pacific, led by China, is expected to dominate the HUD reflector market, owing to its large automotive production base, rapid technological advancements, and a growing consumer appetite for premium vehicle features. North America and Europe also represent substantial markets, propelled by stringent safety regulations and a high penetration of luxury and advanced vehicles. While the market is expected to witness steady growth across all segments, the increasing sophistication of AR-HUD technology will likely see it outpace the growth of conventional C-HUD and W-HUD systems. Key restraints, such as the high cost of advanced HUD technologies and the need for robust supply chain integration, are being addressed by technological innovations and increasing production volumes, paving the way for broader market penetration in the coming years.

HUD Reflector Company Market Share
HUD Reflector Market Composition & Trends
The global HUD Reflector market demonstrates a moderately concentrated landscape, with key players like 3M, Nippon Seiki, and Corning holding significant market share, estimated at over 60% combined. Innovation is driven by advancements in optical coatings, material science, and augmented reality integration, leading to the development of sophisticated C-HUD, W-HUD, and AR-HUD systems. Regulatory landscapes, particularly concerning automotive safety standards and driver distraction, are evolving to favor advanced Heads-Up Display technologies, acting as a significant catalyst for growth. Substitute products, such as integrated infotainment screens and advanced driver-assistance systems (ADAS) without HUDs, present some competitive pressure, but the unique value proposition of HUD reflectors—providing critical information without requiring the driver to divert their gaze—continues to differentiate them. End-user profiles span both the Electric Vehicle (EV) and Fuel Vehicle segments, with a growing demand for advanced HUDs in premium and performance-oriented EVs and increasingly in mainstream passenger vehicles. Merger and acquisition (M&A) activities are observed, though often at a smaller scale, focusing on synergistic technology acquisitions or market access expansion. For instance, recent strategic partnerships in the optical technology sector, valued in the tens of millions, indicate a consolidation of expertise. The market is projected to witness a compound annual growth rate (CAGR) of approximately 15% from 2025 to 2033, with a total market valuation expected to reach over $5,000 million by 2033.
- Market Share Distribution: Leading players collectively command over 60% of the market.
- Innovation Catalysts: Advanced optical coatings, AR integration, and miniaturization.
- Regulatory Impact: Evolving automotive safety standards promoting HUD adoption.
- Substitute Products: Integrated infotainment systems, standalone ADAS.
- End-User Segments: Electric Vehicles (EVs) and Fuel Vehicles.
- M&A Activity: Strategic partnerships and technology acquisitions, with deal values in the tens of millions.
HUD Reflector Industry Evolution
The HUD Reflector industry is poised for dynamic evolution throughout the forecast period of 2025–2033, building upon a strong historical foundation from 2019–2024. The market has witnessed a consistent upward trajectory, driven by a confluence of technological advancements, increasing consumer demand for enhanced in-car experiences, and supportive automotive industry trends. From its base year in 2025, the industry is projected to experience robust growth, with an estimated CAGR of 15%. This growth is intrinsically linked to the increasing sophistication and affordability of HUD technologies. Initially, Heads-Up Displays were primarily featured in luxury vehicles, but as production scaled and manufacturing efficiencies improved, C-HUD and W-HUD systems became more accessible, driving wider adoption across various vehicle segments. The advent and rapid development of Augmented Reality HUDs (AR-HUDs) represent a significant leap forward, offering immersive navigation, hazard warnings, and vehicle information superimposed directly onto the driver's line of sight, drastically improving situational awareness and driving safety.
The proliferation of electric vehicles (EVs) has acted as a potent growth accelerant. EV manufacturers are increasingly integrating advanced digital cockpits, where HUDs play a central role in showcasing critical data such as battery range, charging status, and regenerative braking efficiency. Similarly, traditional fuel vehicle manufacturers are also investing heavily in HUD technology to remain competitive and meet evolving consumer expectations for a technologically advanced driving experience. Consumer demand for in-car connectivity and advanced safety features continues to climb, with HUDs being perceived as a crucial component of the modern automotive interior. This demand is further fueled by an increasing awareness of the safety benefits offered by HUDs, which minimize driver distraction by keeping essential information within their primary field of vision. The industry's trajectory is also shaped by strategic investments in research and development, leading to lighter, more compact, and more energy-efficient HUD reflector designs. These advancements, coupled with the growing integration of AI and machine learning for personalized information delivery, promise to make HUDs an indispensable feature in future automobiles, projecting a market valuation exceeding $5,000 million by the estimated year of 2025 and continuing its upward trend through 2033.
Leading Regions, Countries, or Segments in HUD Reflector
The global HUD Reflector market exhibits significant regional and segmental dominance, primarily driven by the interplay of automotive manufacturing hubs, technological adoption rates, and regulatory frameworks. Within the Application segment, Electric Vehicles (EVs) are emerging as the most dominant driver, with a projected market share growth of over 55% by 2033. This ascendancy is fueled by aggressive government initiatives promoting EV adoption worldwide, coupled with the inherent technological affinity of EV manufacturers for advanced digital interfaces. Major EV markets like China, North America, and Europe are heavily investing in sophisticated in-car technologies, with HUDs, especially AR-HUDs, becoming a de facto standard in new EV models.
In terms of Types, AR-HUD is rapidly gaining prominence and is expected to capture a substantial market share, potentially exceeding 40% by the end of the forecast period. This is attributed to its ability to offer a more immersive and informative driving experience, directly overlaying critical data like navigation arrows, speed limits, and potential hazards onto the driver's view of the road. The advanced capabilities of AR-HUDs align perfectly with the sophisticated technological advancements expected in future vehicles, particularly EVs.
Geographically, Asia Pacific, spearheaded by China, stands out as the leading region. China's colossal automotive market, its position as a global manufacturing powerhouse for both traditional and electric vehicles, and its strong government support for advanced automotive technologies have positioned it at the forefront of HUD reflector adoption. The region benefits from a robust supply chain, including key players like Shentong Technology, Sunny Optical Technology, Liangyu Holdings, Fujian Fran Optics, and Ningbo Jinhui Optical Technology, who are instrumental in driving innovation and production volumes.
- Dominant Application Segment: Electric Vehicles (EVs) are set to capture over 55% of the market by 2033.
- Key Drivers: Government EV mandates, increasing EV sales, technological integration in EV cockpits.
- Impact: Higher demand for advanced HUDs in premium and mainstream EVs.
- Dominant HUD Type: Augmented Reality HUD (AR-HUD) is expected to exceed 40% market share by 2033.
- Key Drivers: Enhanced safety features, immersive navigation, advanced driver assistance system integration.
- Impact: Driving innovation in optical technology and display systems.
- Leading Region: Asia Pacific, with China as the primary market.
- Key Drivers: Massive automotive production, supportive government policies for EVs and advanced technologies, strong domestic component manufacturers.
- Impact: Significant manufacturing capacity and rapid adoption of HUD technology.
- Key Countries Driving Adoption: China, United States, Germany, South Korea.
- Impact: High investment in automotive R&D and consumer demand for innovative features.
HUD Reflector Product Innovations
HUD reflector technology is witnessing rapid product innovation, focusing on enhancing clarity, reducing size, and integrating advanced functionalities. Corning is at the forefront with its lightweight, shatter-resistant optical glass solutions, enabling thinner and more efficient reflector designs. 3M contributes with its advanced optical films and coatings that improve brightness, contrast, and reduce glare, crucial for optimal daytime visibility. Nippon Seiki is pushing the boundaries of miniaturization and projection efficiency for compact W-HUD and C-HUD systems. Shentong Technology and Sunny Optical Technology are focusing on developing high-resolution projection systems for immersive AR-HUD experiences, integrating complex optical elements for wider fields of view and sharper imagery. These innovations collectively aim to deliver safer, more intuitive, and aesthetically pleasing in-car information displays.
Propelling Factors for HUD Reflector Growth
Several key factors are propelling the growth of the HUD Reflector market. The increasing emphasis on automotive safety, driven by both regulatory mandates and consumer demand, makes HUDs an indispensable feature for minimizing driver distraction. The rapid expansion of the Electric Vehicle (EV) market, where advanced digital cockpits are a common feature, further fuels demand. Technological advancements, particularly in augmented reality, are enabling more sophisticated and informative HUD displays. Furthermore, the decreasing cost of production due to economies of scale and advancements in manufacturing processes is making HUDs more accessible across a wider range of vehicle models.
- Automotive Safety Regulations: Mandates promoting driver attention and reducing distractions.
- Electric Vehicle Adoption: Integration of advanced digital cockpits and information systems.
- Augmented Reality Advancements: Enabling immersive navigation and real-time data overlay.
- Technological Sophistication: Miniaturization, improved brightness, and reduced power consumption of HUD components.
- Cost Reduction: Economies of scale and manufacturing efficiencies driving down unit costs.
Obstacles in the HUD Reflector Market
Despite robust growth prospects, the HUD Reflector market faces several obstacles. High initial development and integration costs for advanced AR-HUD systems can be a barrier for some automakers, particularly those focused on budget-friendly vehicle segments. Supply chain disruptions, as observed in recent years, can impact the availability and pricing of critical optical components. Intense competition among established players and emerging technology providers can lead to price pressures. Additionally, evolving automotive electronics architectures and the need for seamless integration with other in-car systems present significant engineering challenges. The market is valued at approximately $3,000 million in the base year of 2025.
- High Integration Costs: Especially for complex AR-HUD systems.
- Supply Chain Volatility: Potential for component shortages and price fluctuations.
- Intense Competition: Leading to potential price erosion.
- Integration Complexity: Challenges in seamlessly integrating HUDs with other vehicle electronics.
Future Opportunities in HUD Reflector
Emerging opportunities in the HUD Reflector market are abundant. The expanding integration of Artificial Intelligence (AI) for personalized driver information and predictive alerts presents a significant growth avenue. The increasing penetration of autonomous driving technologies will necessitate advanced HUDs capable of communicating complex environmental data to the driver. Expansion into aftermarket applications and retrofitting solutions for older vehicles could unlock new market segments. Furthermore, developing more compact and energy-efficient HUDs for micro-mobility solutions like electric scooters and motorcycles represents an untapped potential.
- AI Integration: Personalized driver insights and predictive alerts.
- Autonomous Driving Support: Communicating environmental and vehicle status.
- Aftermarket and Retrofit Solutions: Expanding market reach beyond new vehicle sales.
- Micro-mobility Applications: Developing HUDs for smaller electric vehicles.
Major Players in the HUD Reflector Ecosystem
- 3M
- Nippon Seiki
- Corning
- Shentong Technology
- Sunny Optical Technology
- Liangyu Holdings
- Fujian Fran Optics
- Ningbo Jinhui Optical Technology
Key Developments in HUD Reflector Industry
- 2023: Introduction of advanced laser projection technology for AR-HUDs, significantly improving brightness and contrast ratios.
- 2024: Increased adoption of solid-state LiDAR integration with AR-HUDs for enhanced object detection and real-time hazard warnings.
- 2024: Key partnerships formed between optical component manufacturers and automotive OEMs to co-develop next-generation HUD systems.
- 2024: Growth in the integration of HUDs within electric vehicle charging infrastructure information displays.
- 2025: Expected launch of ultra-compact HUD projectors, enabling wider integration into smaller vehicle interiors and aftermarket solutions.
- 2026: Advancements in transparent display technologies for AR-HUDs, offering even more seamless visual integration.
- 2027: Increased focus on developing AI-powered dynamic content for HUDs based on driver behavior and traffic conditions.
- 2028: Potential for widespread adoption of gesture control for HUD interaction in premium vehicle segments.
- 2030: Maturation of AR-HUD technology leading to a significant decrease in unit costs, driving mass-market adoption.
- 2033: Projected widespread integration of advanced HUDs across all vehicle types, including emerging mobility solutions.
Strategic HUD Reflector Market Forecast
The HUD Reflector market is strategically positioned for substantial growth driven by the increasing demand for advanced safety features, the rapid electrification of the automotive industry, and continuous technological innovation. The forecast period of 2025–2033 anticipates a CAGR of 15%, propelling the market valuation beyond $5,000 million by 2033. Key growth catalysts include the pervasive adoption of Augmented Reality HUDs (AR-HUDs), particularly within electric vehicles, and the growing integration of AI for personalized driver experiences. The market's trajectory is further supported by evolving regulatory landscapes that encourage advanced driver-assistance systems and a robust ecosystem of leading manufacturers like 3M, Nippon Seiki, and Corning, alongside emerging players in Asia. The inherent value proposition of HUDs in enhancing driver safety and convenience ensures sustained market expansion and significant future opportunities.
HUD Reflector Segmentation
-
1. Application
- 1.1. Electric Vehicle
- 1.2. Fuel Vehicle
-
2. Types
- 2.1. C-HUD
- 2.2. W-HUD
- 2.3. AR-HUD
HUD Reflector Segmentation By Geography
-
1. North America
- 1.1. United States
- 1.2. Canada
- 1.3. Mexico
-
2. South America
- 2.1. Brazil
- 2.2. Argentina
- 2.3. Rest of South America
-
3. Europe
- 3.1. United Kingdom
- 3.2. Germany
- 3.3. France
- 3.4. Italy
- 3.5. Spain
- 3.6. Russia
- 3.7. Benelux
- 3.8. Nordics
- 3.9. Rest of Europe
-
4. Middle East & Africa
- 4.1. Turkey
- 4.2. Israel
- 4.3. GCC
- 4.4. North Africa
- 4.5. South Africa
- 4.6. Rest of Middle East & Africa
-
5. Asia Pacific
- 5.1. China
- 5.2. India
- 5.3. Japan
- 5.4. South Korea
- 5.5. ASEAN
- 5.6. Oceania
- 5.7. Rest of Asia Pacific
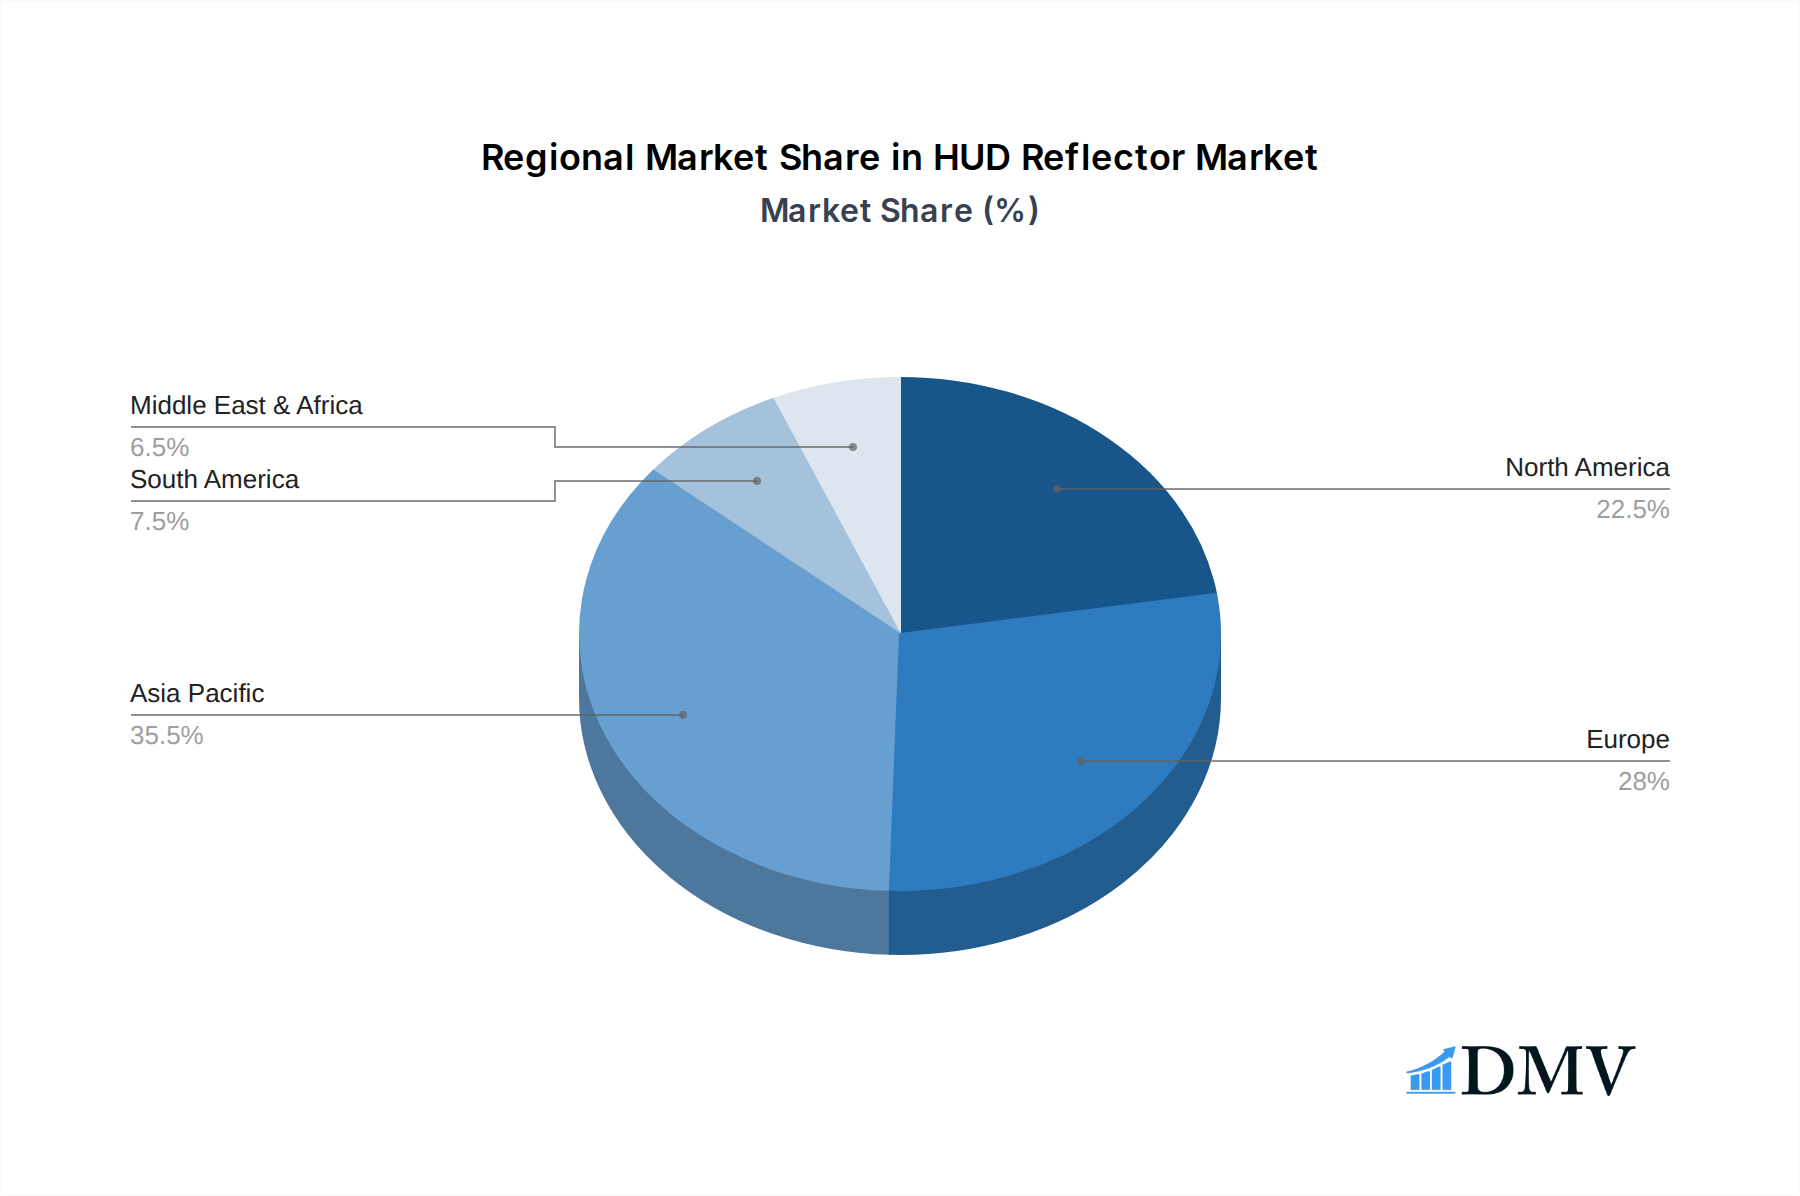
HUD Reflector Regional Market Share
Geographic Coverage of HUD Reflector
HUD Reflector REPORT HIGHLIGHTS
| Aspects | Details |
|---|---|
| Study Period | 2020-2034 |
| Base Year | 2025 |
| Estimated Year | 2026 |
| Forecast Period | 2026-2034 |
| Historical Period | 2020-2025 |
| Growth Rate | CAGR of 13.25% from 2020-2034 |
| Segmentation |
|
Table of Contents
- 1. Introduction
- 1.1. Research Scope
- 1.2. Market Segmentation
- 1.3. Research Methodology
- 1.4. Definitions and Assumptions
- 2. Executive Summary
- 2.1. Introduction
- 3. Market Dynamics
- 3.1. Introduction
- 3.2. Market Drivers
- 3.3. Market Restrains
- 3.4. Market Trends
- 4. Market Factor Analysis
- 4.1. Porters Five Forces
- 4.2. Supply/Value Chain
- 4.3. PESTEL analysis
- 4.4. Market Entropy
- 4.5. Patent/Trademark Analysis
- 5. Global HUD Reflector Analysis, Insights and Forecast, 2020-2032
- 5.1. Market Analysis, Insights and Forecast - by Application
- 5.1.1. Electric Vehicle
- 5.1.2. Fuel Vehicle
- 5.2. Market Analysis, Insights and Forecast - by Types
- 5.2.1. C-HUD
- 5.2.2. W-HUD
- 5.2.3. AR-HUD
- 5.3. Market Analysis, Insights and Forecast - by Region
- 5.3.1. North America
- 5.3.2. South America
- 5.3.3. Europe
- 5.3.4. Middle East & Africa
- 5.3.5. Asia Pacific
- 5.1. Market Analysis, Insights and Forecast - by Application
- 6. North America HUD Reflector Analysis, Insights and Forecast, 2020-2032
- 6.1. Market Analysis, Insights and Forecast - by Application
- 6.1.1. Electric Vehicle
- 6.1.2. Fuel Vehicle
- 6.2. Market Analysis, Insights and Forecast - by Types
- 6.2.1. C-HUD
- 6.2.2. W-HUD
- 6.2.3. AR-HUD
- 6.1. Market Analysis, Insights and Forecast - by Application
- 7. South America HUD Reflector Analysis, Insights and Forecast, 2020-2032
- 7.1. Market Analysis, Insights and Forecast - by Application
- 7.1.1. Electric Vehicle
- 7.1.2. Fuel Vehicle
- 7.2. Market Analysis, Insights and Forecast - by Types
- 7.2.1. C-HUD
- 7.2.2. W-HUD
- 7.2.3. AR-HUD
- 7.1. Market Analysis, Insights and Forecast - by Application
- 8. Europe HUD Reflector Analysis, Insights and Forecast, 2020-2032
- 8.1. Market Analysis, Insights and Forecast - by Application
- 8.1.1. Electric Vehicle
- 8.1.2. Fuel Vehicle
- 8.2. Market Analysis, Insights and Forecast - by Types
- 8.2.1. C-HUD
- 8.2.2. W-HUD
- 8.2.3. AR-HUD
- 8.1. Market Analysis, Insights and Forecast - by Application
- 9. Middle East & Africa HUD Reflector Analysis, Insights and Forecast, 2020-2032
- 9.1. Market Analysis, Insights and Forecast - by Application
- 9.1.1. Electric Vehicle
- 9.1.2. Fuel Vehicle
- 9.2. Market Analysis, Insights and Forecast - by Types
- 9.2.1. C-HUD
- 9.2.2. W-HUD
- 9.2.3. AR-HUD
- 9.1. Market Analysis, Insights and Forecast - by Application
- 10. Asia Pacific HUD Reflector Analysis, Insights and Forecast, 2020-2032
- 10.1. Market Analysis, Insights and Forecast - by Application
- 10.1.1. Electric Vehicle
- 10.1.2. Fuel Vehicle
- 10.2. Market Analysis, Insights and Forecast - by Types
- 10.2.1. C-HUD
- 10.2.2. W-HUD
- 10.2.3. AR-HUD
- 10.1. Market Analysis, Insights and Forecast - by Application
- 11. Competitive Analysis
- 11.1. Global Market Share Analysis 2025
- 11.2. Company Profiles
- 11.2.1 3M
- 11.2.1.1. Overview
- 11.2.1.2. Products
- 11.2.1.3. SWOT Analysis
- 11.2.1.4. Recent Developments
- 11.2.1.5. Financials (Based on Availability)
- 11.2.2 Nippon Seiki
- 11.2.2.1. Overview
- 11.2.2.2. Products
- 11.2.2.3. SWOT Analysis
- 11.2.2.4. Recent Developments
- 11.2.2.5. Financials (Based on Availability)
- 11.2.3 Corning
- 11.2.3.1. Overview
- 11.2.3.2. Products
- 11.2.3.3. SWOT Analysis
- 11.2.3.4. Recent Developments
- 11.2.3.5. Financials (Based on Availability)
- 11.2.4 Shentong Technology
- 11.2.4.1. Overview
- 11.2.4.2. Products
- 11.2.4.3. SWOT Analysis
- 11.2.4.4. Recent Developments
- 11.2.4.5. Financials (Based on Availability)
- 11.2.5 Sunny Optical Technology
- 11.2.5.1. Overview
- 11.2.5.2. Products
- 11.2.5.3. SWOT Analysis
- 11.2.5.4. Recent Developments
- 11.2.5.5. Financials (Based on Availability)
- 11.2.6 Liangyu Holdings
- 11.2.6.1. Overview
- 11.2.6.2. Products
- 11.2.6.3. SWOT Analysis
- 11.2.6.4. Recent Developments
- 11.2.6.5. Financials (Based on Availability)
- 11.2.7 Fujian Fran Optics
- 11.2.7.1. Overview
- 11.2.7.2. Products
- 11.2.7.3. SWOT Analysis
- 11.2.7.4. Recent Developments
- 11.2.7.5. Financials (Based on Availability)
- 11.2.8 Ningbo Jinhui Optical Technology
- 11.2.8.1. Overview
- 11.2.8.2. Products
- 11.2.8.3. SWOT Analysis
- 11.2.8.4. Recent Developments
- 11.2.8.5. Financials (Based on Availability)
- 11.2.1 3M
List of Figures
- Figure 1: Global HUD Reflector Revenue Breakdown (undefined, %) by Region 2025 & 2033
- Figure 2: North America HUD Reflector Revenue (undefined), by Application 2025 & 2033
- Figure 3: North America HUD Reflector Revenue Share (%), by Application 2025 & 2033
- Figure 4: North America HUD Reflector Revenue (undefined), by Types 2025 & 2033
- Figure 5: North America HUD Reflector Revenue Share (%), by Types 2025 & 2033
- Figure 6: North America HUD Reflector Revenue (undefined), by Country 2025 & 2033
- Figure 7: North America HUD Reflector Revenue Share (%), by Country 2025 & 2033
- Figure 8: South America HUD Reflector Revenue (undefined), by Application 2025 & 2033
- Figure 9: South America HUD Reflector Revenue Share (%), by Application 2025 & 2033
- Figure 10: South America HUD Reflector Revenue (undefined), by Types 2025 & 2033
- Figure 11: South America HUD Reflector Revenue Share (%), by Types 2025 & 2033
- Figure 12: South America HUD Reflector Revenue (undefined), by Country 2025 & 2033
- Figure 13: South America HUD Reflector Revenue Share (%), by Country 2025 & 2033
- Figure 14: Europe HUD Reflector Revenue (undefined), by Application 2025 & 2033
- Figure 15: Europe HUD Reflector Revenue Share (%), by Application 2025 & 2033
- Figure 16: Europe HUD Reflector Revenue (undefined), by Types 2025 & 2033
- Figure 17: Europe HUD Reflector Revenue Share (%), by Types 2025 & 2033
- Figure 18: Europe HUD Reflector Revenue (undefined), by Country 2025 & 2033
- Figure 19: Europe HUD Reflector Revenue Share (%), by Country 2025 & 2033
- Figure 20: Middle East & Africa HUD Reflector Revenue (undefined), by Application 2025 & 2033
- Figure 21: Middle East & Africa HUD Reflector Revenue Share (%), by Application 2025 & 2033
- Figure 22: Middle East & Africa HUD Reflector Revenue (undefined), by Types 2025 & 2033
- Figure 23: Middle East & Africa HUD Reflector Revenue Share (%), by Types 2025 & 2033
- Figure 24: Middle East & Africa HUD Reflector Revenue (undefined), by Country 2025 & 2033
- Figure 25: Middle East & Africa HUD Reflector Revenue Share (%), by Country 2025 & 2033
- Figure 26: Asia Pacific HUD Reflector Revenue (undefined), by Application 2025 & 2033
- Figure 27: Asia Pacific HUD Reflector Revenue Share (%), by Application 2025 & 2033
- Figure 28: Asia Pacific HUD Reflector Revenue (undefined), by Types 2025 & 2033
- Figure 29: Asia Pacific HUD Reflector Revenue Share (%), by Types 2025 & 2033
- Figure 30: Asia Pacific HUD Reflector Revenue (undefined), by Country 2025 & 2033
- Figure 31: Asia Pacific HUD Reflector Revenue Share (%), by Country 2025 & 2033
List of Tables
- Table 1: Global HUD Reflector Revenue undefined Forecast, by Application 2020 & 2033
- Table 2: Global HUD Reflector Revenue undefined Forecast, by Types 2020 & 2033
- Table 3: Global HUD Reflector Revenue undefined Forecast, by Region 2020 & 2033
- Table 4: Global HUD Reflector Revenue undefined Forecast, by Application 2020 & 2033
- Table 5: Global HUD Reflector Revenue undefined Forecast, by Types 2020 & 2033
- Table 6: Global HUD Reflector Revenue undefined Forecast, by Country 2020 & 2033
- Table 7: United States HUD Reflector Revenue (undefined) Forecast, by Application 2020 & 2033
- Table 8: Canada HUD Reflector Revenue (undefined) Forecast, by Application 2020 & 2033
- Table 9: Mexico HUD Reflector Revenue (undefined) Forecast, by Application 2020 & 2033
- Table 10: Global HUD Reflector Revenue undefined Forecast, by Application 2020 & 2033
- Table 11: Global HUD Reflector Revenue undefined Forecast, by Types 2020 & 2033
- Table 12: Global HUD Reflector Revenue undefined Forecast, by Country 2020 & 2033
- Table 13: Brazil HUD Reflector Revenue (undefined) Forecast, by Application 2020 & 2033
- Table 14: Argentina HUD Reflector Revenue (undefined) Forecast, by Application 2020 & 2033
- Table 15: Rest of South America HUD Reflector Revenue (undefined) Forecast, by Application 2020 & 2033
- Table 16: Global HUD Reflector Revenue undefined Forecast, by Application 2020 & 2033
- Table 17: Global HUD Reflector Revenue undefined Forecast, by Types 2020 & 2033
- Table 18: Global HUD Reflector Revenue undefined Forecast, by Country 2020 & 2033
- Table 19: United Kingdom HUD Reflector Revenue (undefined) Forecast, by Application 2020 & 2033
- Table 20: Germany HUD Reflector Revenue (undefined) Forecast, by Application 2020 & 2033
- Table 21: France HUD Reflector Revenue (undefined) Forecast, by Application 2020 & 2033
- Table 22: Italy HUD Reflector Revenue (undefined) Forecast, by Application 2020 & 2033
- Table 23: Spain HUD Reflector Revenue (undefined) Forecast, by Application 2020 & 2033
- Table 24: Russia HUD Reflector Revenue (undefined) Forecast, by Application 2020 & 2033
- Table 25: Benelux HUD Reflector Revenue (undefined) Forecast, by Application 2020 & 2033
- Table 26: Nordics HUD Reflector Revenue (undefined) Forecast, by Application 2020 & 2033
- Table 27: Rest of Europe HUD Reflector Revenue (undefined) Forecast, by Application 2020 & 2033
- Table 28: Global HUD Reflector Revenue undefined Forecast, by Application 2020 & 2033
- Table 29: Global HUD Reflector Revenue undefined Forecast, by Types 2020 & 2033
- Table 30: Global HUD Reflector Revenue undefined Forecast, by Country 2020 & 2033
- Table 31: Turkey HUD Reflector Revenue (undefined) Forecast, by Application 2020 & 2033
- Table 32: Israel HUD Reflector Revenue (undefined) Forecast, by Application 2020 & 2033
- Table 33: GCC HUD Reflector Revenue (undefined) Forecast, by Application 2020 & 2033
- Table 34: North Africa HUD Reflector Revenue (undefined) Forecast, by Application 2020 & 2033
- Table 35: South Africa HUD Reflector Revenue (undefined) Forecast, by Application 2020 & 2033
- Table 36: Rest of Middle East & Africa HUD Reflector Revenue (undefined) Forecast, by Application 2020 & 2033
- Table 37: Global HUD Reflector Revenue undefined Forecast, by Application 2020 & 2033
- Table 38: Global HUD Reflector Revenue undefined Forecast, by Types 2020 & 2033
- Table 39: Global HUD Reflector Revenue undefined Forecast, by Country 2020 & 2033
- Table 40: China HUD Reflector Revenue (undefined) Forecast, by Application 2020 & 2033
- Table 41: India HUD Reflector Revenue (undefined) Forecast, by Application 2020 & 2033
- Table 42: Japan HUD Reflector Revenue (undefined) Forecast, by Application 2020 & 2033
- Table 43: South Korea HUD Reflector Revenue (undefined) Forecast, by Application 2020 & 2033
- Table 44: ASEAN HUD Reflector Revenue (undefined) Forecast, by Application 2020 & 2033
- Table 45: Oceania HUD Reflector Revenue (undefined) Forecast, by Application 2020 & 2033
- Table 46: Rest of Asia Pacific HUD Reflector Revenue (undefined) Forecast, by Application 2020 & 2033
Frequently Asked Questions
1. What is the projected Compound Annual Growth Rate (CAGR) of the HUD Reflector?
The projected CAGR is approximately 13.25%.
2. Which companies are prominent players in the HUD Reflector?
Key companies in the market include 3M, Nippon Seiki, Corning, Shentong Technology, Sunny Optical Technology, Liangyu Holdings, Fujian Fran Optics, Ningbo Jinhui Optical Technology.
3. What are the main segments of the HUD Reflector?
The market segments include Application, Types.
4. Can you provide details about the market size?
The market size is estimated to be USD XXX N/A as of 2022.
5. What are some drivers contributing to market growth?
N/A
6. What are the notable trends driving market growth?
N/A
7. Are there any restraints impacting market growth?
N/A
8. Can you provide examples of recent developments in the market?
N/A
9. What pricing options are available for accessing the report?
Pricing options include single-user, multi-user, and enterprise licenses priced at USD 4900.00, USD 7350.00, and USD 9800.00 respectively.
10. Is the market size provided in terms of value or volume?
The market size is provided in terms of value, measured in N/A.
11. Are there any specific market keywords associated with the report?
Yes, the market keyword associated with the report is "HUD Reflector," which aids in identifying and referencing the specific market segment covered.
12. How do I determine which pricing option suits my needs best?
The pricing options vary based on user requirements and access needs. Individual users may opt for single-user licenses, while businesses requiring broader access may choose multi-user or enterprise licenses for cost-effective access to the report.
13. Are there any additional resources or data provided in the HUD Reflector report?
While the report offers comprehensive insights, it's advisable to review the specific contents or supplementary materials provided to ascertain if additional resources or data are available.
14. How can I stay updated on further developments or reports in the HUD Reflector?
To stay informed about further developments, trends, and reports in the HUD Reflector, consider subscribing to industry newsletters, following relevant companies and organizations, or regularly checking reputable industry news sources and publications.
Methodology
Step 1 - Identification of Relevant Samples Size from Population Database


Step 2 - Approaches for Defining Global Market Size (Value, Volume* & Price*)

Note*: In applicable scenarios
Step 3 - Data Sources
Primary Research
- Web Analytics
- Survey Reports
- Research Institute
- Latest Research Reports
- Opinion Leaders
Secondary Research
- Annual Reports
- White Paper
- Latest Press Release
- Industry Association
- Paid Database
- Investor Presentations

Step 4 - Data Triangulation
Involves using different sources of information in order to increase the validity of a study
These sources are likely to be stakeholders in a program - participants, other researchers, program staff, other community members, and so on.
Then we put all data in single framework & apply various statistical tools to find out the dynamic on the market.
During the analysis stage, feedback from the stakeholder groups would be compared to determine areas of agreement as well as areas of divergence