

Key Insights
The global green car market is experiencing robust growth, driven by increasing environmental concerns, stringent government regulations promoting electric vehicles (EVs) and hybrids, and advancements in battery technology leading to improved vehicle range and performance. The market, encompassing Battery Electric Vehicles (BEVs), Plug-in Hybrid Electric Vehicles (PHEVs), and Hybrid Electric Vehicles (HEVs), is projected to maintain a significant Compound Annual Growth Rate (CAGR) throughout the forecast period (2025-2033). Key players like Tesla, BMW, Toyota, and Volkswagen are heavily investing in R&D and expanding their product portfolios to capture market share. Government incentives, such as tax credits and subsidies, are further accelerating adoption, particularly in regions with ambitious emission reduction targets like Europe and North America. However, challenges remain, including the high initial cost of green cars, limited charging infrastructure in certain areas, and concerns about battery lifespan and sourcing of raw materials for battery production. The market segmentation is complex, with variations in vehicle type, battery capacity, range, and price point affecting consumer choice.
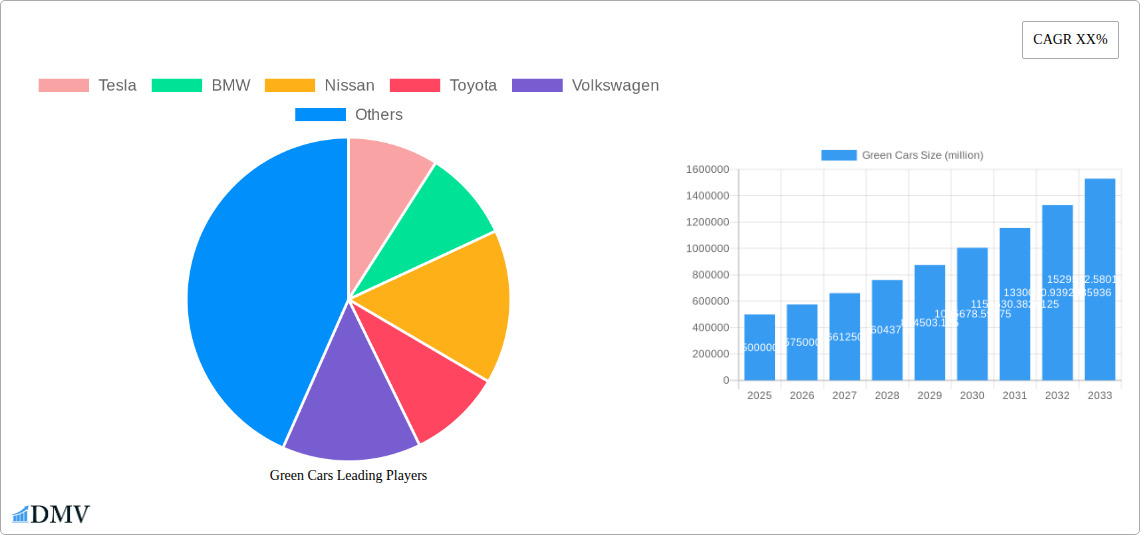
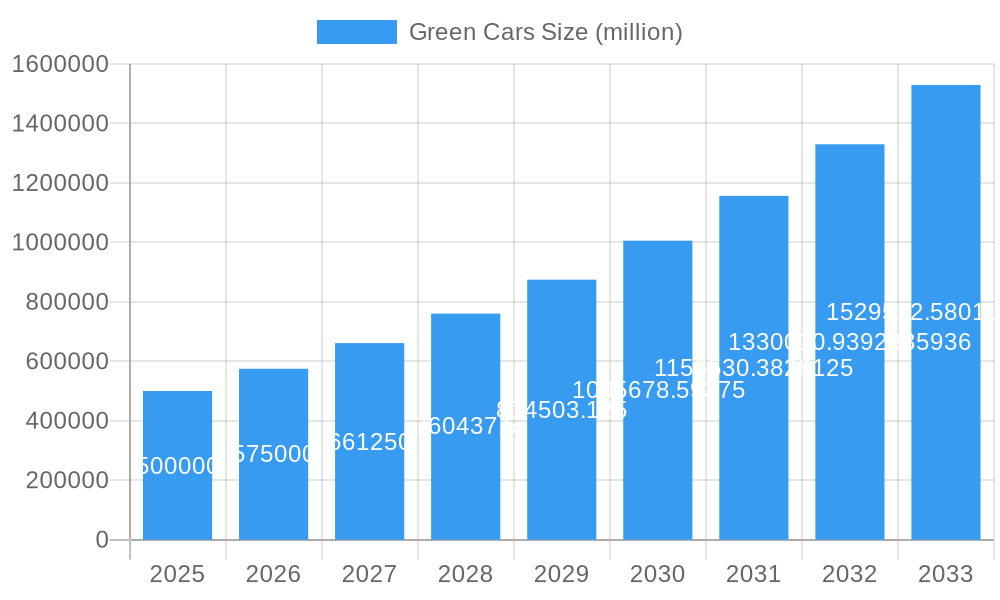
Green Cars Market Size (In Million)
Over the next decade, we anticipate continued market expansion fueled by technological breakthroughs, such as solid-state batteries promising longer ranges and faster charging times, and the rise of autonomous driving features integrated into green vehicles. The geographic distribution of the market will likely see a shift towards developing economies as production costs decrease and infrastructure improves. Competition will intensify among established automakers and new entrants, driving innovation and potentially leading to price reductions. The success of individual companies will depend on their ability to adapt to evolving consumer preferences, optimize supply chains, and effectively address the challenges related to battery technology, charging infrastructure, and raw material sustainability. A focus on developing affordable and accessible green car options for a broader consumer base will be critical for achieving widespread market penetration.
Green Cars Company Market Share
Green Cars Market: A Comprehensive Report (2019-2033)
This insightful report provides a deep dive into the burgeoning Green Cars market, projecting a multi-million dollar valuation by 2033. Leveraging data from 2019-2024 (historical period), with 2025 as the base and estimated year, this study forecasts market trends through 2033. Key players like Tesla, BMW, Nissan, Toyota, Volkswagen, General Motors, Daimler, Energica, BYD, Ford, Bosch, Honda, Chrysler, Mercedes-Benz, and Chevrolet are analyzed, providing a comprehensive overview of this dynamic sector.
Green Cars Market Composition & Trends
This section evaluates the market concentration, analyzing market share distribution amongst key players. For instance, Tesla's market share in the premium EV segment is estimated at xx% in 2025, while BYD holds xx% in the global market. We examine innovation catalysts, such as advancements in battery technology and charging infrastructure, and how regulatory landscapes, including emission standards and government incentives, shape market growth. Substitute products, like hydrogen fuel cell vehicles, are considered alongside evolving end-user profiles and shifting consumer preferences. Finally, we analyze significant M&A activities, including deal values (estimated at millions of dollars) in the sector during the study period.
- Market Share Distribution (2025): Tesla (xx%), BYD (xx%), Volkswagen (xx%), others (xx%).
- Significant M&A Deals (2019-2024): Deal 1 (xx million USD), Deal 2 (xx million USD).
- Key Innovation Catalysts: Improved battery density, advancements in fast-charging technology, development of autonomous driving features.
- Regulatory Landscape Influence: Stringent emission norms in Europe and China, government subsidies in various countries.
Green Cars Industry Evolution
This section details the evolution of the Green Cars industry from 2019 to 2033. We analyze market growth trajectories, with a Compound Annual Growth Rate (CAGR) estimated at xx% during the forecast period (2025-2033). Technological advancements, such as solid-state batteries and improved motor efficiency, are discussed in detail, along with shifting consumer demands, encompassing factors like range anxiety, charging convenience, and vehicle affordability. Specific adoption metrics, such as the number of green cars sold annually, are provided to demonstrate market growth. For example, the global sales of electric vehicles are projected to reach xx million units by 2033.
Leading Regions, Countries, or Segments in Green Cars
This section identifies the dominant regions, countries, and segments within the Green Cars market. Currently, xx is the leading region due to factors detailed below.
- Key Drivers for Dominance in [Leading Region]:
- Strong government support and substantial investments in charging infrastructure.
- Favorable policies promoting electric vehicle adoption, including tax incentives and emission regulations.
- High consumer awareness and acceptance of green technologies.
[Detailed paragraph analyzing dominance factors, including market size, growth rate, and key players operating in the leading region.]
Green Cars Product Innovations
Recent product innovations include significant advancements in battery technology, resulting in increased range and faster charging times. New models boast improved aerodynamics and lightweight materials for enhanced efficiency. Unique selling propositions (USPs) include advanced driver-assistance systems (ADAS), sophisticated infotainment systems, and sustainable interior materials, catering to the growing demand for eco-friendly and technologically advanced vehicles.
Propelling Factors for Green Cars Growth
Several factors contribute to the Green Cars market's growth. Technological advancements, such as improved battery technology and charging infrastructure, reduce range anxiety and increase accessibility. Stringent government regulations on emissions globally are driving manufacturers towards developing and producing green cars, while favorable government incentives such as tax credits and subsidies are boosting consumer demand. Furthermore, increasing consumer awareness of environmental issues and the desire for sustainable transportation choices fuel market growth.
Obstacles in the Green Cars Market
Despite the positive outlook, several challenges impede Green Cars market expansion. Supply chain disruptions, particularly concerning battery materials like lithium and cobalt, increase production costs and limit availability. High initial purchase prices and limited charging infrastructure remain significant barriers for wider adoption. Furthermore, intense competition among established and emerging players creates pricing pressures and affects market dynamics. The overall impact of these challenges can be quantified through reduced sales figures or delayed technological advancements (e.g., a xx% reduction in sales due to supply chain issues).
Future Opportunities in Green Cars
Emerging opportunities lie in expanding into new markets, particularly in developing economies with growing middle classes and increasing vehicle ownership rates. Technological advancements, such as solid-state batteries and hydrogen fuel cell technology, promise to further enhance the performance and affordability of green cars. New business models, such as battery-as-a-service, are also emerging and will shape the industry's future.
Major Players in the Green Cars Ecosystem
- Tesla
- BMW
- Nissan
- Toyota
- Volkswagen
- General Motors
- Daimler
- Energica
- BYD
- Ford
- Bosch (Robert)
- Honda
- Chrysler
- Mercedes-Benz
- Chevrolet
Key Developments in Green Cars Industry
- Jan 2023: Tesla announces a new battery technology with improved range and charging speed.
- Mar 2023: Volkswagen and BYD announce a strategic partnership to expand their EV offerings.
- June 2023: The EU implements stricter emission standards for new vehicles. (Add further bullet points as needed).
Strategic Green Cars Market Forecast
The Green Cars market is poised for significant growth in the coming years, driven by technological advancements, supportive government policies, and a growing awareness of environmental sustainability. The market is expected to reach a valuation of xx million USD by 2033, with continued expansion across various regions and segments. Innovation in battery technology, charging infrastructure, and vehicle design will remain key catalysts for growth, along with emerging business models and increased consumer adoption.
Green Cars Segmentation
-
1. Application
- 1.1. Personal
- 1.2. Commercial
-
2. Types
- 2.1. Electric and fuel cell-powered
- 2.2. Hybrid electric vehicles
- 2.3. Compressed air cars, stirling vehicles, and others
- 2.4. Improving conventional cars
- 2.5. Electric Motor and Pedal Powered Vehicles
- 2.6. Other
Green Cars Segmentation By Geography
-
1. North America
- 1.1. United States
- 1.2. Canada
- 1.3. Mexico
-
2. South America
- 2.1. Brazil
- 2.2. Argentina
- 2.3. Rest of South America
-
3. Europe
- 3.1. United Kingdom
- 3.2. Germany
- 3.3. France
- 3.4. Italy
- 3.5. Spain
- 3.6. Russia
- 3.7. Benelux
- 3.8. Nordics
- 3.9. Rest of Europe
-
4. Middle East & Africa
- 4.1. Turkey
- 4.2. Israel
- 4.3. GCC
- 4.4. North Africa
- 4.5. South Africa
- 4.6. Rest of Middle East & Africa
-
5. Asia Pacific
- 5.1. China
- 5.2. India
- 5.3. Japan
- 5.4. South Korea
- 5.5. ASEAN
- 5.6. Oceania
- 5.7. Rest of Asia Pacific
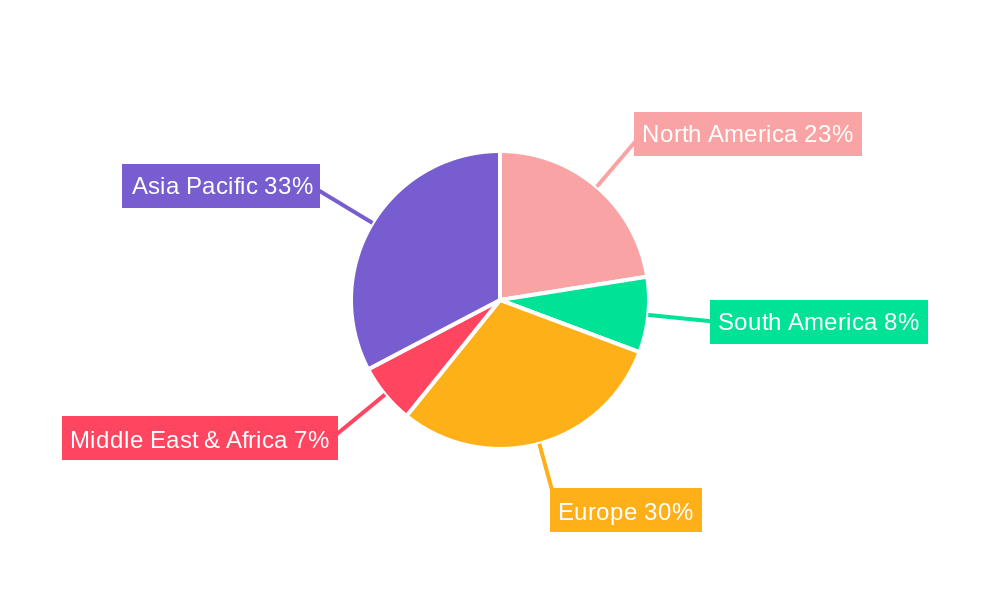
Green Cars Regional Market Share
Geographic Coverage of Green Cars
Green Cars REPORT HIGHLIGHTS
| Aspects | Details |
|---|---|
| Study Period | 2020-2034 |
| Base Year | 2025 |
| Estimated Year | 2026 |
| Forecast Period | 2026-2034 |
| Historical Period | 2020-2025 |
| Growth Rate | CAGR of 15% from 2020-2034 |
| Segmentation |
|
Table of Contents
- 1. Introduction
- 1.1. Research Scope
- 1.2. Market Segmentation
- 1.3. Research Methodology
- 1.4. Definitions and Assumptions
- 2. Executive Summary
- 2.1. Introduction
- 3. Market Dynamics
- 3.1. Introduction
- 3.2. Market Drivers
- 3.3. Market Restrains
- 3.4. Market Trends
- 4. Market Factor Analysis
- 4.1. Porters Five Forces
- 4.2. Supply/Value Chain
- 4.3. PESTEL analysis
- 4.4. Market Entropy
- 4.5. Patent/Trademark Analysis
- 5. Global Green Cars Analysis, Insights and Forecast, 2020-2032
- 5.1. Market Analysis, Insights and Forecast - by Application
- 5.1.1. Personal
- 5.1.2. Commercial
- 5.2. Market Analysis, Insights and Forecast - by Types
- 5.2.1. Electric and fuel cell-powered
- 5.2.2. Hybrid electric vehicles
- 5.2.3. Compressed air cars, stirling vehicles, and others
- 5.2.4. Improving conventional cars
- 5.2.5. Electric Motor and Pedal Powered Vehicles
- 5.2.6. Other
- 5.3. Market Analysis, Insights and Forecast - by Region
- 5.3.1. North America
- 5.3.2. South America
- 5.3.3. Europe
- 5.3.4. Middle East & Africa
- 5.3.5. Asia Pacific
- 5.1. Market Analysis, Insights and Forecast - by Application
- 6. North America Green Cars Analysis, Insights and Forecast, 2020-2032
- 6.1. Market Analysis, Insights and Forecast - by Application
- 6.1.1. Personal
- 6.1.2. Commercial
- 6.2. Market Analysis, Insights and Forecast - by Types
- 6.2.1. Electric and fuel cell-powered
- 6.2.2. Hybrid electric vehicles
- 6.2.3. Compressed air cars, stirling vehicles, and others
- 6.2.4. Improving conventional cars
- 6.2.5. Electric Motor and Pedal Powered Vehicles
- 6.2.6. Other
- 6.1. Market Analysis, Insights and Forecast - by Application
- 7. South America Green Cars Analysis, Insights and Forecast, 2020-2032
- 7.1. Market Analysis, Insights and Forecast - by Application
- 7.1.1. Personal
- 7.1.2. Commercial
- 7.2. Market Analysis, Insights and Forecast - by Types
- 7.2.1. Electric and fuel cell-powered
- 7.2.2. Hybrid electric vehicles
- 7.2.3. Compressed air cars, stirling vehicles, and others
- 7.2.4. Improving conventional cars
- 7.2.5. Electric Motor and Pedal Powered Vehicles
- 7.2.6. Other
- 7.1. Market Analysis, Insights and Forecast - by Application
- 8. Europe Green Cars Analysis, Insights and Forecast, 2020-2032
- 8.1. Market Analysis, Insights and Forecast - by Application
- 8.1.1. Personal
- 8.1.2. Commercial
- 8.2. Market Analysis, Insights and Forecast - by Types
- 8.2.1. Electric and fuel cell-powered
- 8.2.2. Hybrid electric vehicles
- 8.2.3. Compressed air cars, stirling vehicles, and others
- 8.2.4. Improving conventional cars
- 8.2.5. Electric Motor and Pedal Powered Vehicles
- 8.2.6. Other
- 8.1. Market Analysis, Insights and Forecast - by Application
- 9. Middle East & Africa Green Cars Analysis, Insights and Forecast, 2020-2032
- 9.1. Market Analysis, Insights and Forecast - by Application
- 9.1.1. Personal
- 9.1.2. Commercial
- 9.2. Market Analysis, Insights and Forecast - by Types
- 9.2.1. Electric and fuel cell-powered
- 9.2.2. Hybrid electric vehicles
- 9.2.3. Compressed air cars, stirling vehicles, and others
- 9.2.4. Improving conventional cars
- 9.2.5. Electric Motor and Pedal Powered Vehicles
- 9.2.6. Other
- 9.1. Market Analysis, Insights and Forecast - by Application
- 10. Asia Pacific Green Cars Analysis, Insights and Forecast, 2020-2032
- 10.1. Market Analysis, Insights and Forecast - by Application
- 10.1.1. Personal
- 10.1.2. Commercial
- 10.2. Market Analysis, Insights and Forecast - by Types
- 10.2.1. Electric and fuel cell-powered
- 10.2.2. Hybrid electric vehicles
- 10.2.3. Compressed air cars, stirling vehicles, and others
- 10.2.4. Improving conventional cars
- 10.2.5. Electric Motor and Pedal Powered Vehicles
- 10.2.6. Other
- 10.1. Market Analysis, Insights and Forecast - by Application
- 11. Competitive Analysis
- 11.1. Global Market Share Analysis 2025
- 11.2. Company Profiles
- 11.2.1 Tesla
- 11.2.1.1. Overview
- 11.2.1.2. Products
- 11.2.1.3. SWOT Analysis
- 11.2.1.4. Recent Developments
- 11.2.1.5. Financials (Based on Availability)
- 11.2.2 BMW
- 11.2.2.1. Overview
- 11.2.2.2. Products
- 11.2.2.3. SWOT Analysis
- 11.2.2.4. Recent Developments
- 11.2.2.5. Financials (Based on Availability)
- 11.2.3 Nissan
- 11.2.3.1. Overview
- 11.2.3.2. Products
- 11.2.3.3. SWOT Analysis
- 11.2.3.4. Recent Developments
- 11.2.3.5. Financials (Based on Availability)
- 11.2.4 Toyota
- 11.2.4.1. Overview
- 11.2.4.2. Products
- 11.2.4.3. SWOT Analysis
- 11.2.4.4. Recent Developments
- 11.2.4.5. Financials (Based on Availability)
- 11.2.5 Volkswagen
- 11.2.5.1. Overview
- 11.2.5.2. Products
- 11.2.5.3. SWOT Analysis
- 11.2.5.4. Recent Developments
- 11.2.5.5. Financials (Based on Availability)
- 11.2.6 General
- 11.2.6.1. Overview
- 11.2.6.2. Products
- 11.2.6.3. SWOT Analysis
- 11.2.6.4. Recent Developments
- 11.2.6.5. Financials (Based on Availability)
- 11.2.7 Daimler
- 11.2.7.1. Overview
- 11.2.7.2. Products
- 11.2.7.3. SWOT Analysis
- 11.2.7.4. Recent Developments
- 11.2.7.5. Financials (Based on Availability)
- 11.2.8 Energica
- 11.2.8.1. Overview
- 11.2.8.2. Products
- 11.2.8.3. SWOT Analysis
- 11.2.8.4. Recent Developments
- 11.2.8.5. Financials (Based on Availability)
- 11.2.9 BYD
- 11.2.9.1. Overview
- 11.2.9.2. Products
- 11.2.9.3. SWOT Analysis
- 11.2.9.4. Recent Developments
- 11.2.9.5. Financials (Based on Availability)
- 11.2.10 Ford
- 11.2.10.1. Overview
- 11.2.10.2. Products
- 11.2.10.3. SWOT Analysis
- 11.2.10.4. Recent Developments
- 11.2.10.5. Financials (Based on Availability)
- 11.2.11 Bosch (Robert)
- 11.2.11.1. Overview
- 11.2.11.2. Products
- 11.2.11.3. SWOT Analysis
- 11.2.11.4. Recent Developments
- 11.2.11.5. Financials (Based on Availability)
- 11.2.12 Honda
- 11.2.12.1. Overview
- 11.2.12.2. Products
- 11.2.12.3. SWOT Analysis
- 11.2.12.4. Recent Developments
- 11.2.12.5. Financials (Based on Availability)
- 11.2.13 Chrysler
- 11.2.13.1. Overview
- 11.2.13.2. Products
- 11.2.13.3. SWOT Analysis
- 11.2.13.4. Recent Developments
- 11.2.13.5. Financials (Based on Availability)
- 11.2.14 Mercedes Benz
- 11.2.14.1. Overview
- 11.2.14.2. Products
- 11.2.14.3. SWOT Analysis
- 11.2.14.4. Recent Developments
- 11.2.14.5. Financials (Based on Availability)
- 11.2.15 Chevrolet
- 11.2.15.1. Overview
- 11.2.15.2. Products
- 11.2.15.3. SWOT Analysis
- 11.2.15.4. Recent Developments
- 11.2.15.5. Financials (Based on Availability)
- 11.2.1 Tesla
List of Figures
- Figure 1: Global Green Cars Revenue Breakdown (undefined, %) by Region 2025 & 2033
- Figure 2: North America Green Cars Revenue (undefined), by Application 2025 & 2033
- Figure 3: North America Green Cars Revenue Share (%), by Application 2025 & 2033
- Figure 4: North America Green Cars Revenue (undefined), by Types 2025 & 2033
- Figure 5: North America Green Cars Revenue Share (%), by Types 2025 & 2033
- Figure 6: North America Green Cars Revenue (undefined), by Country 2025 & 2033
- Figure 7: North America Green Cars Revenue Share (%), by Country 2025 & 2033
- Figure 8: South America Green Cars Revenue (undefined), by Application 2025 & 2033
- Figure 9: South America Green Cars Revenue Share (%), by Application 2025 & 2033
- Figure 10: South America Green Cars Revenue (undefined), by Types 2025 & 2033
- Figure 11: South America Green Cars Revenue Share (%), by Types 2025 & 2033
- Figure 12: South America Green Cars Revenue (undefined), by Country 2025 & 2033
- Figure 13: South America Green Cars Revenue Share (%), by Country 2025 & 2033
- Figure 14: Europe Green Cars Revenue (undefined), by Application 2025 & 2033
- Figure 15: Europe Green Cars Revenue Share (%), by Application 2025 & 2033
- Figure 16: Europe Green Cars Revenue (undefined), by Types 2025 & 2033
- Figure 17: Europe Green Cars Revenue Share (%), by Types 2025 & 2033
- Figure 18: Europe Green Cars Revenue (undefined), by Country 2025 & 2033
- Figure 19: Europe Green Cars Revenue Share (%), by Country 2025 & 2033
- Figure 20: Middle East & Africa Green Cars Revenue (undefined), by Application 2025 & 2033
- Figure 21: Middle East & Africa Green Cars Revenue Share (%), by Application 2025 & 2033
- Figure 22: Middle East & Africa Green Cars Revenue (undefined), by Types 2025 & 2033
- Figure 23: Middle East & Africa Green Cars Revenue Share (%), by Types 2025 & 2033
- Figure 24: Middle East & Africa Green Cars Revenue (undefined), by Country 2025 & 2033
- Figure 25: Middle East & Africa Green Cars Revenue Share (%), by Country 2025 & 2033
- Figure 26: Asia Pacific Green Cars Revenue (undefined), by Application 2025 & 2033
- Figure 27: Asia Pacific Green Cars Revenue Share (%), by Application 2025 & 2033
- Figure 28: Asia Pacific Green Cars Revenue (undefined), by Types 2025 & 2033
- Figure 29: Asia Pacific Green Cars Revenue Share (%), by Types 2025 & 2033
- Figure 30: Asia Pacific Green Cars Revenue (undefined), by Country 2025 & 2033
- Figure 31: Asia Pacific Green Cars Revenue Share (%), by Country 2025 & 2033
List of Tables
- Table 1: Global Green Cars Revenue undefined Forecast, by Application 2020 & 2033
- Table 2: Global Green Cars Revenue undefined Forecast, by Types 2020 & 2033
- Table 3: Global Green Cars Revenue undefined Forecast, by Region 2020 & 2033
- Table 4: Global Green Cars Revenue undefined Forecast, by Application 2020 & 2033
- Table 5: Global Green Cars Revenue undefined Forecast, by Types 2020 & 2033
- Table 6: Global Green Cars Revenue undefined Forecast, by Country 2020 & 2033
- Table 7: United States Green Cars Revenue (undefined) Forecast, by Application 2020 & 2033
- Table 8: Canada Green Cars Revenue (undefined) Forecast, by Application 2020 & 2033
- Table 9: Mexico Green Cars Revenue (undefined) Forecast, by Application 2020 & 2033
- Table 10: Global Green Cars Revenue undefined Forecast, by Application 2020 & 2033
- Table 11: Global Green Cars Revenue undefined Forecast, by Types 2020 & 2033
- Table 12: Global Green Cars Revenue undefined Forecast, by Country 2020 & 2033
- Table 13: Brazil Green Cars Revenue (undefined) Forecast, by Application 2020 & 2033
- Table 14: Argentina Green Cars Revenue (undefined) Forecast, by Application 2020 & 2033
- Table 15: Rest of South America Green Cars Revenue (undefined) Forecast, by Application 2020 & 2033
- Table 16: Global Green Cars Revenue undefined Forecast, by Application 2020 & 2033
- Table 17: Global Green Cars Revenue undefined Forecast, by Types 2020 & 2033
- Table 18: Global Green Cars Revenue undefined Forecast, by Country 2020 & 2033
- Table 19: United Kingdom Green Cars Revenue (undefined) Forecast, by Application 2020 & 2033
- Table 20: Germany Green Cars Revenue (undefined) Forecast, by Application 2020 & 2033
- Table 21: France Green Cars Revenue (undefined) Forecast, by Application 2020 & 2033
- Table 22: Italy Green Cars Revenue (undefined) Forecast, by Application 2020 & 2033
- Table 23: Spain Green Cars Revenue (undefined) Forecast, by Application 2020 & 2033
- Table 24: Russia Green Cars Revenue (undefined) Forecast, by Application 2020 & 2033
- Table 25: Benelux Green Cars Revenue (undefined) Forecast, by Application 2020 & 2033
- Table 26: Nordics Green Cars Revenue (undefined) Forecast, by Application 2020 & 2033
- Table 27: Rest of Europe Green Cars Revenue (undefined) Forecast, by Application 2020 & 2033
- Table 28: Global Green Cars Revenue undefined Forecast, by Application 2020 & 2033
- Table 29: Global Green Cars Revenue undefined Forecast, by Types 2020 & 2033
- Table 30: Global Green Cars Revenue undefined Forecast, by Country 2020 & 2033
- Table 31: Turkey Green Cars Revenue (undefined) Forecast, by Application 2020 & 2033
- Table 32: Israel Green Cars Revenue (undefined) Forecast, by Application 2020 & 2033
- Table 33: GCC Green Cars Revenue (undefined) Forecast, by Application 2020 & 2033
- Table 34: North Africa Green Cars Revenue (undefined) Forecast, by Application 2020 & 2033
- Table 35: South Africa Green Cars Revenue (undefined) Forecast, by Application 2020 & 2033
- Table 36: Rest of Middle East & Africa Green Cars Revenue (undefined) Forecast, by Application 2020 & 2033
- Table 37: Global Green Cars Revenue undefined Forecast, by Application 2020 & 2033
- Table 38: Global Green Cars Revenue undefined Forecast, by Types 2020 & 2033
- Table 39: Global Green Cars Revenue undefined Forecast, by Country 2020 & 2033
- Table 40: China Green Cars Revenue (undefined) Forecast, by Application 2020 & 2033
- Table 41: India Green Cars Revenue (undefined) Forecast, by Application 2020 & 2033
- Table 42: Japan Green Cars Revenue (undefined) Forecast, by Application 2020 & 2033
- Table 43: South Korea Green Cars Revenue (undefined) Forecast, by Application 2020 & 2033
- Table 44: ASEAN Green Cars Revenue (undefined) Forecast, by Application 2020 & 2033
- Table 45: Oceania Green Cars Revenue (undefined) Forecast, by Application 2020 & 2033
- Table 46: Rest of Asia Pacific Green Cars Revenue (undefined) Forecast, by Application 2020 & 2033
Frequently Asked Questions
1. What is the projected Compound Annual Growth Rate (CAGR) of the Green Cars?
The projected CAGR is approximately 15%.
2. Which companies are prominent players in the Green Cars?
Key companies in the market include Tesla, BMW, Nissan, Toyota, Volkswagen, General, Daimler, Energica, BYD, Ford, Bosch (Robert), Honda, Chrysler, Mercedes Benz, Chevrolet.
3. What are the main segments of the Green Cars?
The market segments include Application, Types.
4. Can you provide details about the market size?
The market size is estimated to be USD XXX N/A as of 2022.
5. What are some drivers contributing to market growth?
N/A
6. What are the notable trends driving market growth?
N/A
7. Are there any restraints impacting market growth?
N/A
8. Can you provide examples of recent developments in the market?
N/A
9. What pricing options are available for accessing the report?
Pricing options include single-user, multi-user, and enterprise licenses priced at USD 4900.00, USD 7350.00, and USD 9800.00 respectively.
10. Is the market size provided in terms of value or volume?
The market size is provided in terms of value, measured in N/A.
11. Are there any specific market keywords associated with the report?
Yes, the market keyword associated with the report is "Green Cars," which aids in identifying and referencing the specific market segment covered.
12. How do I determine which pricing option suits my needs best?
The pricing options vary based on user requirements and access needs. Individual users may opt for single-user licenses, while businesses requiring broader access may choose multi-user or enterprise licenses for cost-effective access to the report.
13. Are there any additional resources or data provided in the Green Cars report?
While the report offers comprehensive insights, it's advisable to review the specific contents or supplementary materials provided to ascertain if additional resources or data are available.
14. How can I stay updated on further developments or reports in the Green Cars?
To stay informed about further developments, trends, and reports in the Green Cars, consider subscribing to industry newsletters, following relevant companies and organizations, or regularly checking reputable industry news sources and publications.
Methodology
Step 1 - Identification of Relevant Samples Size from Population Database


Step 2 - Approaches for Defining Global Market Size (Value, Volume* & Price*)

Note*: In applicable scenarios
Step 3 - Data Sources
Primary Research
- Web Analytics
- Survey Reports
- Research Institute
- Latest Research Reports
- Opinion Leaders
Secondary Research
- Annual Reports
- White Paper
- Latest Press Release
- Industry Association
- Paid Database
- Investor Presentations

Step 4 - Data Triangulation
Involves using different sources of information in order to increase the validity of a study
These sources are likely to be stakeholders in a program - participants, other researchers, program staff, other community members, and so on.
Then we put all data in single framework & apply various statistical tools to find out the dynamic on the market.
During the analysis stage, feedback from the stakeholder groups would be compared to determine areas of agreement as well as areas of divergence