

Key Insights
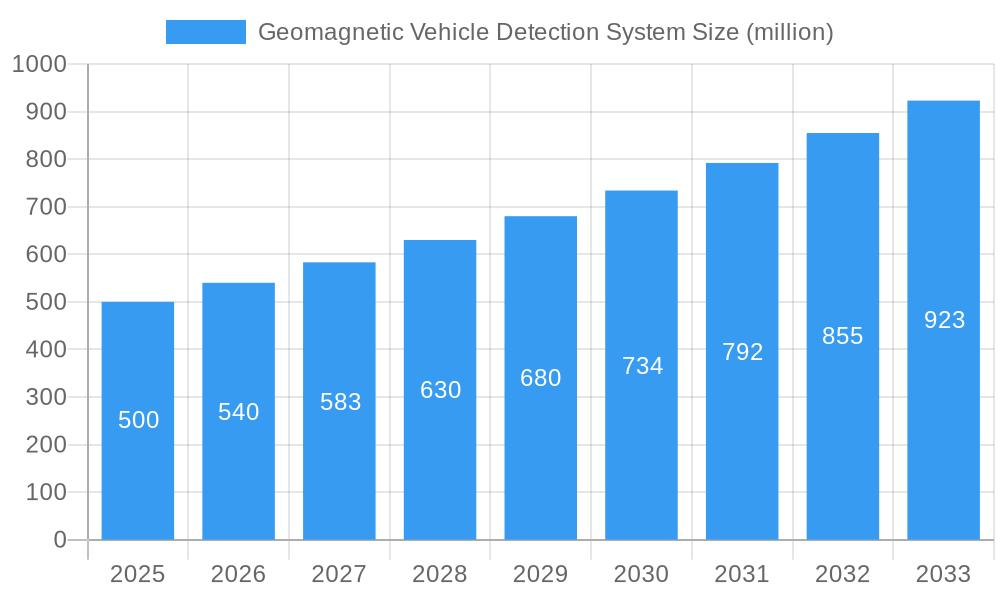
The global Geomagnetic Vehicle Detection System market is experiencing robust growth, driven by increasing urbanization, the need for efficient traffic management, and the rising demand for advanced parking solutions. The market's expansion is fueled by technological advancements leading to more accurate, reliable, and cost-effective systems. These systems offer several advantages over traditional loop detectors, including non-intrusive installation, reduced maintenance costs, and enhanced durability. The integration of these systems with smart city initiatives further enhances their appeal, allowing for real-time traffic monitoring, improved parking guidance, and optimized traffic flow. We estimate the current market size (2025) to be around $500 million, based on a reasonable assessment of similar technology markets and considering the adoption rate of advanced traffic management solutions. A conservative Compound Annual Growth Rate (CAGR) of 8% is projected for the forecast period (2025-2033), indicating a significant market expansion in the coming years.
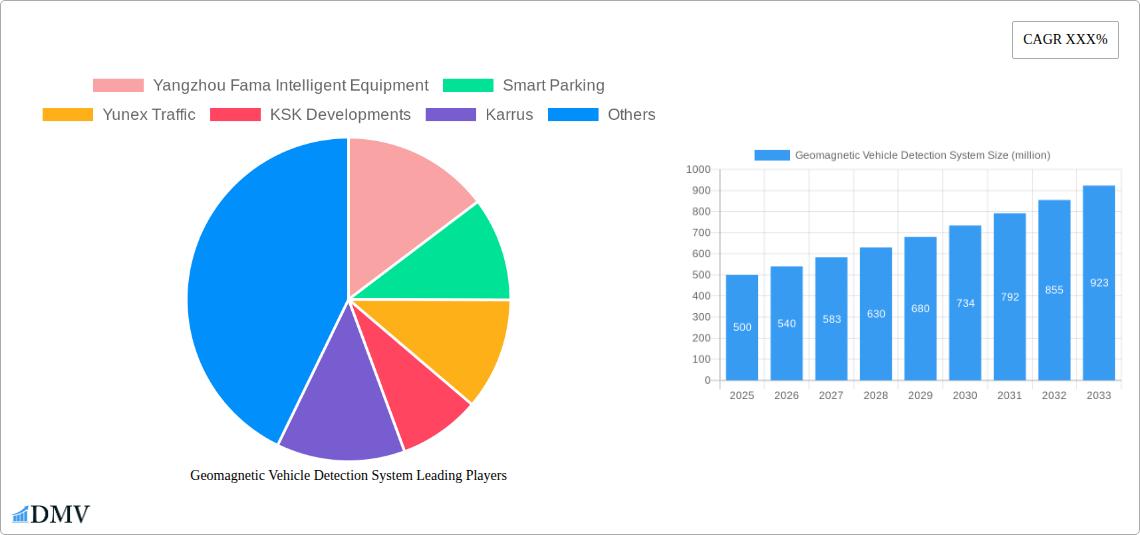
Geomagnetic Vehicle Detection System Market Size (In Million)
Market restraints include high initial investment costs for installation and the need for specialized technical expertise for implementation and maintenance. However, these challenges are being mitigated by the increasing availability of cost-effective solutions and the growing pool of skilled professionals. Segmentation within the market includes various system types (e.g., single-loop, multi-loop), application areas (e.g., parking garages, traffic intersections), and geographical regions. Key players such as Yangzhou Fama Intelligent Equipment, Smart Parking, Yunex Traffic, KSK Developments, Karrus, UAB Arevita, and Guangzhou COMA Electronics are actively contributing to market growth through continuous innovation and strategic partnerships. The market is expected to witness a shift toward more intelligent and integrated systems, incorporating technologies like AI and IoT for enhanced performance and data analytics. This integration will further expand the applications and market potential of geomagnetic vehicle detection systems across various sectors.
Geomagnetic Vehicle Detection System Company Market Share
Geomagnetic Vehicle Detection System Market Report: 2019-2033
This comprehensive report provides an in-depth analysis of the global Geomagnetic Vehicle Detection System market, projecting a market value exceeding $XX million by 2033. The study covers the period from 2019 to 2033, with 2025 serving as both the base and estimated year. This report is essential for stakeholders seeking to understand market trends, competitive landscapes, and future growth opportunities within this rapidly evolving sector.
Geomagnetic Vehicle Detection System Market Composition & Trends
This section delves into the competitive dynamics of the Geomagnetic Vehicle Detection System market, analyzing market concentration, innovation, regulation, and market player activities. The market is characterized by a moderately concentrated landscape, with key players like Yangzhou Fama Intelligent Equipment, Smart Parking, Yunex Traffic, KSK Developments, Karrus, UAB Arevita, and Guangzhou COMA Electronics vying for market share.
- Market Share Distribution (2025): While precise figures are proprietary to the full report, preliminary estimates suggest a leading player commanding approximately XX% market share, with the remaining share distributed among other key players and smaller niche companies.
- Innovation Catalysts: Advancements in sensor technology, particularly miniaturization and improved sensitivity, are driving innovation. The integration of AI and machine learning for enhanced data analysis and anomaly detection is another key catalyst.
- Regulatory Landscape: Government regulations promoting intelligent transportation systems (ITS) and smart city initiatives are fostering market growth, particularly in developed regions. However, varying regulatory frameworks across different countries create a complex and fragmented regulatory landscape.
- Substitute Products: Alternative vehicle detection technologies, such as inductive loop detectors and video image processing, present competitive pressure. However, the unique advantages of geomagnetic systems, such as their non-intrusive nature and ability to operate in diverse weather conditions, maintain their competitive edge.
- End-User Profiles: Major end-users include transportation authorities, parking management companies, and infrastructure developers. The increasing adoption of smart parking solutions is a key driver of demand.
- M&A Activities: The report analyzes several significant M&A activities in the sector, including deals with estimated values exceeding $XX million in recent years, demonstrating a consolidation trend within the market.
Geomagnetic Vehicle Detection System Industry Evolution
This section analyzes the historical and projected growth trajectories of the Geomagnetic Vehicle Detection System market, tracing its evolution from 2019 to 2033. The market witnessed substantial growth during the historical period (2019-2024), driven primarily by increased infrastructure development and the adoption of smart city initiatives. The CAGR during this period is estimated at approximately XX%. Technological advancements, such as the development of more robust and cost-effective sensors, have further fueled market expansion. Consumer demand, fueled by rising traffic congestion and the need for efficient parking management in urban areas, is expected to continue driving market growth in the forecast period (2025-2033). The projected CAGR for the forecast period is estimated at approximately XX%, indicating a sustained period of significant market growth. Adoption rates for geomagnetic systems are rapidly increasing, particularly in developed nations with advanced ITS infrastructure.
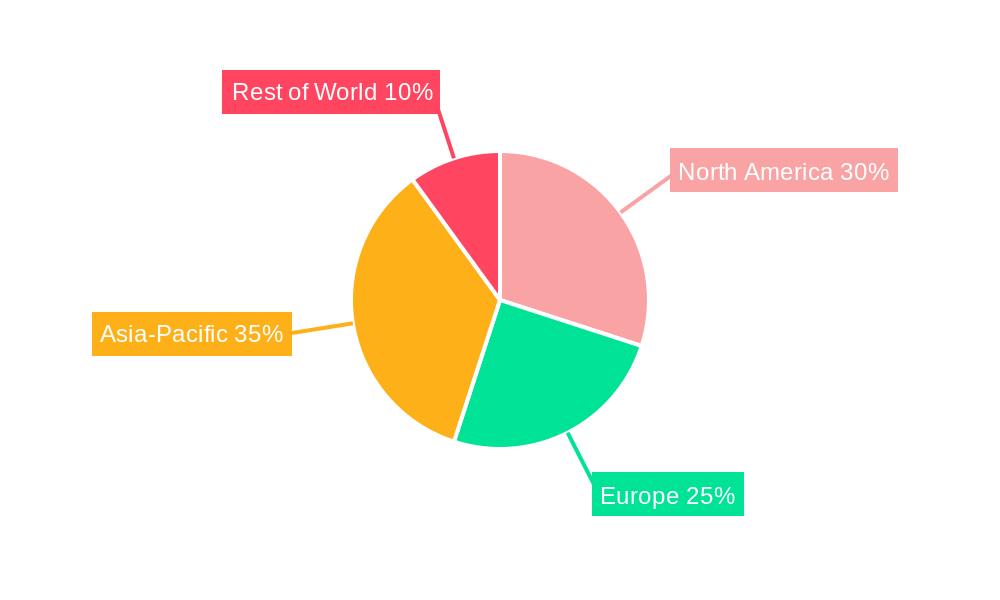
Leading Regions, Countries, or Segments in Geomagnetic Vehicle Detection System
The report identifies North America as a leading region in the Geomagnetic Vehicle Detection System market, accounting for approximately XX% of the global market share in 2025.
- Key Drivers for North America's Dominance:
- High level of investment in smart city infrastructure.
- Stringent environmental regulations pushing for efficient traffic management.
- Strong technological capabilities and innovation ecosystem.
- High adoption rates among parking management companies.
- Robust government support for smart transportation initiatives.
The dominance of North America stems from its early adoption of advanced transportation technologies, high investment in infrastructure development, and progressive regulatory environment. While other regions, like Europe and Asia-Pacific, show significant growth potential, North America maintains a strong lead due to the factors mentioned above. The European market, for example, is expected to experience considerable expansion in the coming years due to increasing government funding for smart cities and improving ITS infrastructure.
Geomagnetic Vehicle Detection System Product Innovations
Recent product innovations have focused on enhancing sensor accuracy, increasing operational lifespan, and integrating advanced data analytics capabilities. Miniaturization of sensors allows for seamless integration into various infrastructure elements, while improved algorithms enable more accurate vehicle classification and speed detection. The integration of wireless communication technologies facilitates real-time data transmission to central management systems, improving overall system efficiency and enabling remote monitoring. These advancements offer unique selling propositions, including enhanced accuracy, reduced maintenance costs, and improved data insights compared to older technologies.
Propelling Factors for Geomagnetic Vehicle Detection System Growth
The growth of the Geomagnetic Vehicle Detection System market is fueled by several key factors. Firstly, increasing urbanization and consequent traffic congestion create a strong need for efficient traffic and parking management solutions. Secondly, the growing adoption of smart city initiatives globally encourages investment in advanced ITS infrastructure, including geomagnetic vehicle detection systems. Lastly, technological advancements, such as the development of more reliable and cost-effective sensors and improved data analytics capabilities, are driving market growth.
Obstacles in the Geomagnetic Vehicle Detection System Market
Despite the strong growth potential, the market faces certain challenges. High initial investment costs for system implementation can be a barrier, particularly for smaller municipalities or parking operators with limited budgets. Supply chain disruptions, especially related to semiconductor shortages, can affect the availability and cost of components. Competition from alternative vehicle detection technologies, such as inductive loops and video detection, also poses a challenge. These factors, when combined, can impact market expansion and overall profitability within the sector.
Future Opportunities in Geomagnetic Vehicle Detection System
Emerging opportunities exist in expanding into new markets, particularly in developing economies undergoing rapid urbanization. The integration of geomagnetic systems with other smart city technologies, such as traffic signal optimization and autonomous vehicle systems, offers substantial growth potential. Furthermore, advancements in sensor technology, particularly the development of more energy-efficient and cost-effective sensors, will unlock new opportunities. Exploring new applications, such as monitoring pedestrian traffic flow and detecting security breaches, can further expand market reach.
Major Players in the Geomagnetic Vehicle Detection System Ecosystem
- Smart Parking
- Yunex Traffic
- KSK Developments
- Karrus
- UAB Arevita
- Guangzhou COMA Electronics
- Yangzhou Fama Intelligent Equipment
Key Developments in Geomagnetic Vehicle Detection System Industry
- 2022 Q4: Smart Parking announces the successful integration of its geomagnetic vehicle detection system with its latest parking guidance system.
- 2023 Q1: Yunex Traffic launches a new generation of high-precision geomagnetic sensors with improved weather resistance.
- 2023 Q3: Guangzhou COMA Electronics secures a major contract for the deployment of its geomagnetic vehicle detection systems in a smart city project in Asia.
(Further developments will be detailed in the full report)
Strategic Geomagnetic Vehicle Detection System Market Forecast
The Geomagnetic Vehicle Detection System market is poised for continued expansion throughout the forecast period (2025-2033), driven by ongoing urbanization, growing adoption of smart city technologies, and technological advancements. The increasing demand for efficient traffic and parking management solutions will fuel market growth. The focus on developing more sophisticated and cost-effective systems will further enhance market penetration across various applications and regions. The market is expected to witness significant growth, creating lucrative opportunities for both established players and new entrants.
Geomagnetic Vehicle Detection System Segmentation
-
1. Application
- 1.1. Indoor Parking
- 1.2. Outdoor Parking
-
2. Type
- 2.1. Surface-Mounted
- 2.2. Buried
Geomagnetic Vehicle Detection System Segmentation By Geography
-
1. North America
- 1.1. United States
- 1.2. Canada
- 1.3. Mexico
-
2. South America
- 2.1. Brazil
- 2.2. Argentina
- 2.3. Rest of South America
-
3. Europe
- 3.1. United Kingdom
- 3.2. Germany
- 3.3. France
- 3.4. Italy
- 3.5. Spain
- 3.6. Russia
- 3.7. Benelux
- 3.8. Nordics
- 3.9. Rest of Europe
-
4. Middle East & Africa
- 4.1. Turkey
- 4.2. Israel
- 4.3. GCC
- 4.4. North Africa
- 4.5. South Africa
- 4.6. Rest of Middle East & Africa
-
5. Asia Pacific
- 5.1. China
- 5.2. India
- 5.3. Japan
- 5.4. South Korea
- 5.5. ASEAN
- 5.6. Oceania
- 5.7. Rest of Asia Pacific
Geomagnetic Vehicle Detection System Regional Market Share
Geographic Coverage of Geomagnetic Vehicle Detection System
Geomagnetic Vehicle Detection System REPORT HIGHLIGHTS
| Aspects | Details |
|---|---|
| Study Period | 2020-2034 |
| Base Year | 2025 |
| Estimated Year | 2026 |
| Forecast Period | 2026-2034 |
| Historical Period | 2020-2025 |
| Growth Rate | CAGR of XXX% from 2020-2034 |
| Segmentation |
|
Table of Contents
- 1. Introduction
- 1.1. Research Scope
- 1.2. Market Segmentation
- 1.3. Research Methodology
- 1.4. Definitions and Assumptions
- 2. Executive Summary
- 2.1. Introduction
- 3. Market Dynamics
- 3.1. Introduction
- 3.2. Market Drivers
- 3.3. Market Restrains
- 3.4. Market Trends
- 4. Market Factor Analysis
- 4.1. Porters Five Forces
- 4.2. Supply/Value Chain
- 4.3. PESTEL analysis
- 4.4. Market Entropy
- 4.5. Patent/Trademark Analysis
- 5. Global Geomagnetic Vehicle Detection System Analysis, Insights and Forecast, 2020-2032
- 5.1. Market Analysis, Insights and Forecast - by Application
- 5.1.1. Indoor Parking
- 5.1.2. Outdoor Parking
- 5.2. Market Analysis, Insights and Forecast - by Type
- 5.2.1. Surface-Mounted
- 5.2.2. Buried
- 5.3. Market Analysis, Insights and Forecast - by Region
- 5.3.1. North America
- 5.3.2. South America
- 5.3.3. Europe
- 5.3.4. Middle East & Africa
- 5.3.5. Asia Pacific
- 5.1. Market Analysis, Insights and Forecast - by Application
- 6. North America Geomagnetic Vehicle Detection System Analysis, Insights and Forecast, 2020-2032
- 6.1. Market Analysis, Insights and Forecast - by Application
- 6.1.1. Indoor Parking
- 6.1.2. Outdoor Parking
- 6.2. Market Analysis, Insights and Forecast - by Type
- 6.2.1. Surface-Mounted
- 6.2.2. Buried
- 6.1. Market Analysis, Insights and Forecast - by Application
- 7. South America Geomagnetic Vehicle Detection System Analysis, Insights and Forecast, 2020-2032
- 7.1. Market Analysis, Insights and Forecast - by Application
- 7.1.1. Indoor Parking
- 7.1.2. Outdoor Parking
- 7.2. Market Analysis, Insights and Forecast - by Type
- 7.2.1. Surface-Mounted
- 7.2.2. Buried
- 7.1. Market Analysis, Insights and Forecast - by Application
- 8. Europe Geomagnetic Vehicle Detection System Analysis, Insights and Forecast, 2020-2032
- 8.1. Market Analysis, Insights and Forecast - by Application
- 8.1.1. Indoor Parking
- 8.1.2. Outdoor Parking
- 8.2. Market Analysis, Insights and Forecast - by Type
- 8.2.1. Surface-Mounted
- 8.2.2. Buried
- 8.1. Market Analysis, Insights and Forecast - by Application
- 9. Middle East & Africa Geomagnetic Vehicle Detection System Analysis, Insights and Forecast, 2020-2032
- 9.1. Market Analysis, Insights and Forecast - by Application
- 9.1.1. Indoor Parking
- 9.1.2. Outdoor Parking
- 9.2. Market Analysis, Insights and Forecast - by Type
- 9.2.1. Surface-Mounted
- 9.2.2. Buried
- 9.1. Market Analysis, Insights and Forecast - by Application
- 10. Asia Pacific Geomagnetic Vehicle Detection System Analysis, Insights and Forecast, 2020-2032
- 10.1. Market Analysis, Insights and Forecast - by Application
- 10.1.1. Indoor Parking
- 10.1.2. Outdoor Parking
- 10.2. Market Analysis, Insights and Forecast - by Type
- 10.2.1. Surface-Mounted
- 10.2.2. Buried
- 10.1. Market Analysis, Insights and Forecast - by Application
- 11. Competitive Analysis
- 11.1. Global Market Share Analysis 2025
- 11.2. Company Profiles
- 11.2.1 Yangzhou Fama Intelligent Equipment
- 11.2.1.1. Overview
- 11.2.1.2. Products
- 11.2.1.3. SWOT Analysis
- 11.2.1.4. Recent Developments
- 11.2.1.5. Financials (Based on Availability)
- 11.2.2 Smart Parking
- 11.2.2.1. Overview
- 11.2.2.2. Products
- 11.2.2.3. SWOT Analysis
- 11.2.2.4. Recent Developments
- 11.2.2.5. Financials (Based on Availability)
- 11.2.3 Yunex Traffic
- 11.2.3.1. Overview
- 11.2.3.2. Products
- 11.2.3.3. SWOT Analysis
- 11.2.3.4. Recent Developments
- 11.2.3.5. Financials (Based on Availability)
- 11.2.4 KSK Developments
- 11.2.4.1. Overview
- 11.2.4.2. Products
- 11.2.4.3. SWOT Analysis
- 11.2.4.4. Recent Developments
- 11.2.4.5. Financials (Based on Availability)
- 11.2.5 Karrus
- 11.2.5.1. Overview
- 11.2.5.2. Products
- 11.2.5.3. SWOT Analysis
- 11.2.5.4. Recent Developments
- 11.2.5.5. Financials (Based on Availability)
- 11.2.6 UAB Arevita
- 11.2.6.1. Overview
- 11.2.6.2. Products
- 11.2.6.3. SWOT Analysis
- 11.2.6.4. Recent Developments
- 11.2.6.5. Financials (Based on Availability)
- 11.2.7 Guangzhou COMA Electronics
- 11.2.7.1. Overview
- 11.2.7.2. Products
- 11.2.7.3. SWOT Analysis
- 11.2.7.4. Recent Developments
- 11.2.7.5. Financials (Based on Availability)
- 11.2.1 Yangzhou Fama Intelligent Equipment
List of Figures
- Figure 1: Global Geomagnetic Vehicle Detection System Revenue Breakdown (million, %) by Region 2025 & 2033
- Figure 2: Global Geomagnetic Vehicle Detection System Volume Breakdown (K, %) by Region 2025 & 2033
- Figure 3: North America Geomagnetic Vehicle Detection System Revenue (million), by Application 2025 & 2033
- Figure 4: North America Geomagnetic Vehicle Detection System Volume (K), by Application 2025 & 2033
- Figure 5: North America Geomagnetic Vehicle Detection System Revenue Share (%), by Application 2025 & 2033
- Figure 6: North America Geomagnetic Vehicle Detection System Volume Share (%), by Application 2025 & 2033
- Figure 7: North America Geomagnetic Vehicle Detection System Revenue (million), by Type 2025 & 2033
- Figure 8: North America Geomagnetic Vehicle Detection System Volume (K), by Type 2025 & 2033
- Figure 9: North America Geomagnetic Vehicle Detection System Revenue Share (%), by Type 2025 & 2033
- Figure 10: North America Geomagnetic Vehicle Detection System Volume Share (%), by Type 2025 & 2033
- Figure 11: North America Geomagnetic Vehicle Detection System Revenue (million), by Country 2025 & 2033
- Figure 12: North America Geomagnetic Vehicle Detection System Volume (K), by Country 2025 & 2033
- Figure 13: North America Geomagnetic Vehicle Detection System Revenue Share (%), by Country 2025 & 2033
- Figure 14: North America Geomagnetic Vehicle Detection System Volume Share (%), by Country 2025 & 2033
- Figure 15: South America Geomagnetic Vehicle Detection System Revenue (million), by Application 2025 & 2033
- Figure 16: South America Geomagnetic Vehicle Detection System Volume (K), by Application 2025 & 2033
- Figure 17: South America Geomagnetic Vehicle Detection System Revenue Share (%), by Application 2025 & 2033
- Figure 18: South America Geomagnetic Vehicle Detection System Volume Share (%), by Application 2025 & 2033
- Figure 19: South America Geomagnetic Vehicle Detection System Revenue (million), by Type 2025 & 2033
- Figure 20: South America Geomagnetic Vehicle Detection System Volume (K), by Type 2025 & 2033
- Figure 21: South America Geomagnetic Vehicle Detection System Revenue Share (%), by Type 2025 & 2033
- Figure 22: South America Geomagnetic Vehicle Detection System Volume Share (%), by Type 2025 & 2033
- Figure 23: South America Geomagnetic Vehicle Detection System Revenue (million), by Country 2025 & 2033
- Figure 24: South America Geomagnetic Vehicle Detection System Volume (K), by Country 2025 & 2033
- Figure 25: South America Geomagnetic Vehicle Detection System Revenue Share (%), by Country 2025 & 2033
- Figure 26: South America Geomagnetic Vehicle Detection System Volume Share (%), by Country 2025 & 2033
- Figure 27: Europe Geomagnetic Vehicle Detection System Revenue (million), by Application 2025 & 2033
- Figure 28: Europe Geomagnetic Vehicle Detection System Volume (K), by Application 2025 & 2033
- Figure 29: Europe Geomagnetic Vehicle Detection System Revenue Share (%), by Application 2025 & 2033
- Figure 30: Europe Geomagnetic Vehicle Detection System Volume Share (%), by Application 2025 & 2033
- Figure 31: Europe Geomagnetic Vehicle Detection System Revenue (million), by Type 2025 & 2033
- Figure 32: Europe Geomagnetic Vehicle Detection System Volume (K), by Type 2025 & 2033
- Figure 33: Europe Geomagnetic Vehicle Detection System Revenue Share (%), by Type 2025 & 2033
- Figure 34: Europe Geomagnetic Vehicle Detection System Volume Share (%), by Type 2025 & 2033
- Figure 35: Europe Geomagnetic Vehicle Detection System Revenue (million), by Country 2025 & 2033
- Figure 36: Europe Geomagnetic Vehicle Detection System Volume (K), by Country 2025 & 2033
- Figure 37: Europe Geomagnetic Vehicle Detection System Revenue Share (%), by Country 2025 & 2033
- Figure 38: Europe Geomagnetic Vehicle Detection System Volume Share (%), by Country 2025 & 2033
- Figure 39: Middle East & Africa Geomagnetic Vehicle Detection System Revenue (million), by Application 2025 & 2033
- Figure 40: Middle East & Africa Geomagnetic Vehicle Detection System Volume (K), by Application 2025 & 2033
- Figure 41: Middle East & Africa Geomagnetic Vehicle Detection System Revenue Share (%), by Application 2025 & 2033
- Figure 42: Middle East & Africa Geomagnetic Vehicle Detection System Volume Share (%), by Application 2025 & 2033
- Figure 43: Middle East & Africa Geomagnetic Vehicle Detection System Revenue (million), by Type 2025 & 2033
- Figure 44: Middle East & Africa Geomagnetic Vehicle Detection System Volume (K), by Type 2025 & 2033
- Figure 45: Middle East & Africa Geomagnetic Vehicle Detection System Revenue Share (%), by Type 2025 & 2033
- Figure 46: Middle East & Africa Geomagnetic Vehicle Detection System Volume Share (%), by Type 2025 & 2033
- Figure 47: Middle East & Africa Geomagnetic Vehicle Detection System Revenue (million), by Country 2025 & 2033
- Figure 48: Middle East & Africa Geomagnetic Vehicle Detection System Volume (K), by Country 2025 & 2033
- Figure 49: Middle East & Africa Geomagnetic Vehicle Detection System Revenue Share (%), by Country 2025 & 2033
- Figure 50: Middle East & Africa Geomagnetic Vehicle Detection System Volume Share (%), by Country 2025 & 2033
- Figure 51: Asia Pacific Geomagnetic Vehicle Detection System Revenue (million), by Application 2025 & 2033
- Figure 52: Asia Pacific Geomagnetic Vehicle Detection System Volume (K), by Application 2025 & 2033
- Figure 53: Asia Pacific Geomagnetic Vehicle Detection System Revenue Share (%), by Application 2025 & 2033
- Figure 54: Asia Pacific Geomagnetic Vehicle Detection System Volume Share (%), by Application 2025 & 2033
- Figure 55: Asia Pacific Geomagnetic Vehicle Detection System Revenue (million), by Type 2025 & 2033
- Figure 56: Asia Pacific Geomagnetic Vehicle Detection System Volume (K), by Type 2025 & 2033
- Figure 57: Asia Pacific Geomagnetic Vehicle Detection System Revenue Share (%), by Type 2025 & 2033
- Figure 58: Asia Pacific Geomagnetic Vehicle Detection System Volume Share (%), by Type 2025 & 2033
- Figure 59: Asia Pacific Geomagnetic Vehicle Detection System Revenue (million), by Country 2025 & 2033
- Figure 60: Asia Pacific Geomagnetic Vehicle Detection System Volume (K), by Country 2025 & 2033
- Figure 61: Asia Pacific Geomagnetic Vehicle Detection System Revenue Share (%), by Country 2025 & 2033
- Figure 62: Asia Pacific Geomagnetic Vehicle Detection System Volume Share (%), by Country 2025 & 2033
List of Tables
- Table 1: Global Geomagnetic Vehicle Detection System Revenue million Forecast, by Application 2020 & 2033
- Table 2: Global Geomagnetic Vehicle Detection System Volume K Forecast, by Application 2020 & 2033
- Table 3: Global Geomagnetic Vehicle Detection System Revenue million Forecast, by Type 2020 & 2033
- Table 4: Global Geomagnetic Vehicle Detection System Volume K Forecast, by Type 2020 & 2033
- Table 5: Global Geomagnetic Vehicle Detection System Revenue million Forecast, by Region 2020 & 2033
- Table 6: Global Geomagnetic Vehicle Detection System Volume K Forecast, by Region 2020 & 2033
- Table 7: Global Geomagnetic Vehicle Detection System Revenue million Forecast, by Application 2020 & 2033
- Table 8: Global Geomagnetic Vehicle Detection System Volume K Forecast, by Application 2020 & 2033
- Table 9: Global Geomagnetic Vehicle Detection System Revenue million Forecast, by Type 2020 & 2033
- Table 10: Global Geomagnetic Vehicle Detection System Volume K Forecast, by Type 2020 & 2033
- Table 11: Global Geomagnetic Vehicle Detection System Revenue million Forecast, by Country 2020 & 2033
- Table 12: Global Geomagnetic Vehicle Detection System Volume K Forecast, by Country 2020 & 2033
- Table 13: United States Geomagnetic Vehicle Detection System Revenue (million) Forecast, by Application 2020 & 2033
- Table 14: United States Geomagnetic Vehicle Detection System Volume (K) Forecast, by Application 2020 & 2033
- Table 15: Canada Geomagnetic Vehicle Detection System Revenue (million) Forecast, by Application 2020 & 2033
- Table 16: Canada Geomagnetic Vehicle Detection System Volume (K) Forecast, by Application 2020 & 2033
- Table 17: Mexico Geomagnetic Vehicle Detection System Revenue (million) Forecast, by Application 2020 & 2033
- Table 18: Mexico Geomagnetic Vehicle Detection System Volume (K) Forecast, by Application 2020 & 2033
- Table 19: Global Geomagnetic Vehicle Detection System Revenue million Forecast, by Application 2020 & 2033
- Table 20: Global Geomagnetic Vehicle Detection System Volume K Forecast, by Application 2020 & 2033
- Table 21: Global Geomagnetic Vehicle Detection System Revenue million Forecast, by Type 2020 & 2033
- Table 22: Global Geomagnetic Vehicle Detection System Volume K Forecast, by Type 2020 & 2033
- Table 23: Global Geomagnetic Vehicle Detection System Revenue million Forecast, by Country 2020 & 2033
- Table 24: Global Geomagnetic Vehicle Detection System Volume K Forecast, by Country 2020 & 2033
- Table 25: Brazil Geomagnetic Vehicle Detection System Revenue (million) Forecast, by Application 2020 & 2033
- Table 26: Brazil Geomagnetic Vehicle Detection System Volume (K) Forecast, by Application 2020 & 2033
- Table 27: Argentina Geomagnetic Vehicle Detection System Revenue (million) Forecast, by Application 2020 & 2033
- Table 28: Argentina Geomagnetic Vehicle Detection System Volume (K) Forecast, by Application 2020 & 2033
- Table 29: Rest of South America Geomagnetic Vehicle Detection System Revenue (million) Forecast, by Application 2020 & 2033
- Table 30: Rest of South America Geomagnetic Vehicle Detection System Volume (K) Forecast, by Application 2020 & 2033
- Table 31: Global Geomagnetic Vehicle Detection System Revenue million Forecast, by Application 2020 & 2033
- Table 32: Global Geomagnetic Vehicle Detection System Volume K Forecast, by Application 2020 & 2033
- Table 33: Global Geomagnetic Vehicle Detection System Revenue million Forecast, by Type 2020 & 2033
- Table 34: Global Geomagnetic Vehicle Detection System Volume K Forecast, by Type 2020 & 2033
- Table 35: Global Geomagnetic Vehicle Detection System Revenue million Forecast, by Country 2020 & 2033
- Table 36: Global Geomagnetic Vehicle Detection System Volume K Forecast, by Country 2020 & 2033
- Table 37: United Kingdom Geomagnetic Vehicle Detection System Revenue (million) Forecast, by Application 2020 & 2033
- Table 38: United Kingdom Geomagnetic Vehicle Detection System Volume (K) Forecast, by Application 2020 & 2033
- Table 39: Germany Geomagnetic Vehicle Detection System Revenue (million) Forecast, by Application 2020 & 2033
- Table 40: Germany Geomagnetic Vehicle Detection System Volume (K) Forecast, by Application 2020 & 2033
- Table 41: France Geomagnetic Vehicle Detection System Revenue (million) Forecast, by Application 2020 & 2033
- Table 42: France Geomagnetic Vehicle Detection System Volume (K) Forecast, by Application 2020 & 2033
- Table 43: Italy Geomagnetic Vehicle Detection System Revenue (million) Forecast, by Application 2020 & 2033
- Table 44: Italy Geomagnetic Vehicle Detection System Volume (K) Forecast, by Application 2020 & 2033
- Table 45: Spain Geomagnetic Vehicle Detection System Revenue (million) Forecast, by Application 2020 & 2033
- Table 46: Spain Geomagnetic Vehicle Detection System Volume (K) Forecast, by Application 2020 & 2033
- Table 47: Russia Geomagnetic Vehicle Detection System Revenue (million) Forecast, by Application 2020 & 2033
- Table 48: Russia Geomagnetic Vehicle Detection System Volume (K) Forecast, by Application 2020 & 2033
- Table 49: Benelux Geomagnetic Vehicle Detection System Revenue (million) Forecast, by Application 2020 & 2033
- Table 50: Benelux Geomagnetic Vehicle Detection System Volume (K) Forecast, by Application 2020 & 2033
- Table 51: Nordics Geomagnetic Vehicle Detection System Revenue (million) Forecast, by Application 2020 & 2033
- Table 52: Nordics Geomagnetic Vehicle Detection System Volume (K) Forecast, by Application 2020 & 2033
- Table 53: Rest of Europe Geomagnetic Vehicle Detection System Revenue (million) Forecast, by Application 2020 & 2033
- Table 54: Rest of Europe Geomagnetic Vehicle Detection System Volume (K) Forecast, by Application 2020 & 2033
- Table 55: Global Geomagnetic Vehicle Detection System Revenue million Forecast, by Application 2020 & 2033
- Table 56: Global Geomagnetic Vehicle Detection System Volume K Forecast, by Application 2020 & 2033
- Table 57: Global Geomagnetic Vehicle Detection System Revenue million Forecast, by Type 2020 & 2033
- Table 58: Global Geomagnetic Vehicle Detection System Volume K Forecast, by Type 2020 & 2033
- Table 59: Global Geomagnetic Vehicle Detection System Revenue million Forecast, by Country 2020 & 2033
- Table 60: Global Geomagnetic Vehicle Detection System Volume K Forecast, by Country 2020 & 2033
- Table 61: Turkey Geomagnetic Vehicle Detection System Revenue (million) Forecast, by Application 2020 & 2033
- Table 62: Turkey Geomagnetic Vehicle Detection System Volume (K) Forecast, by Application 2020 & 2033
- Table 63: Israel Geomagnetic Vehicle Detection System Revenue (million) Forecast, by Application 2020 & 2033
- Table 64: Israel Geomagnetic Vehicle Detection System Volume (K) Forecast, by Application 2020 & 2033
- Table 65: GCC Geomagnetic Vehicle Detection System Revenue (million) Forecast, by Application 2020 & 2033
- Table 66: GCC Geomagnetic Vehicle Detection System Volume (K) Forecast, by Application 2020 & 2033
- Table 67: North Africa Geomagnetic Vehicle Detection System Revenue (million) Forecast, by Application 2020 & 2033
- Table 68: North Africa Geomagnetic Vehicle Detection System Volume (K) Forecast, by Application 2020 & 2033
- Table 69: South Africa Geomagnetic Vehicle Detection System Revenue (million) Forecast, by Application 2020 & 2033
- Table 70: South Africa Geomagnetic Vehicle Detection System Volume (K) Forecast, by Application 2020 & 2033
- Table 71: Rest of Middle East & Africa Geomagnetic Vehicle Detection System Revenue (million) Forecast, by Application 2020 & 2033
- Table 72: Rest of Middle East & Africa Geomagnetic Vehicle Detection System Volume (K) Forecast, by Application 2020 & 2033
- Table 73: Global Geomagnetic Vehicle Detection System Revenue million Forecast, by Application 2020 & 2033
- Table 74: Global Geomagnetic Vehicle Detection System Volume K Forecast, by Application 2020 & 2033
- Table 75: Global Geomagnetic Vehicle Detection System Revenue million Forecast, by Type 2020 & 2033
- Table 76: Global Geomagnetic Vehicle Detection System Volume K Forecast, by Type 2020 & 2033
- Table 77: Global Geomagnetic Vehicle Detection System Revenue million Forecast, by Country 2020 & 2033
- Table 78: Global Geomagnetic Vehicle Detection System Volume K Forecast, by Country 2020 & 2033
- Table 79: China Geomagnetic Vehicle Detection System Revenue (million) Forecast, by Application 2020 & 2033
- Table 80: China Geomagnetic Vehicle Detection System Volume (K) Forecast, by Application 2020 & 2033
- Table 81: India Geomagnetic Vehicle Detection System Revenue (million) Forecast, by Application 2020 & 2033
- Table 82: India Geomagnetic Vehicle Detection System Volume (K) Forecast, by Application 2020 & 2033
- Table 83: Japan Geomagnetic Vehicle Detection System Revenue (million) Forecast, by Application 2020 & 2033
- Table 84: Japan Geomagnetic Vehicle Detection System Volume (K) Forecast, by Application 2020 & 2033
- Table 85: South Korea Geomagnetic Vehicle Detection System Revenue (million) Forecast, by Application 2020 & 2033
- Table 86: South Korea Geomagnetic Vehicle Detection System Volume (K) Forecast, by Application 2020 & 2033
- Table 87: ASEAN Geomagnetic Vehicle Detection System Revenue (million) Forecast, by Application 2020 & 2033
- Table 88: ASEAN Geomagnetic Vehicle Detection System Volume (K) Forecast, by Application 2020 & 2033
- Table 89: Oceania Geomagnetic Vehicle Detection System Revenue (million) Forecast, by Application 2020 & 2033
- Table 90: Oceania Geomagnetic Vehicle Detection System Volume (K) Forecast, by Application 2020 & 2033
- Table 91: Rest of Asia Pacific Geomagnetic Vehicle Detection System Revenue (million) Forecast, by Application 2020 & 2033
- Table 92: Rest of Asia Pacific Geomagnetic Vehicle Detection System Volume (K) Forecast, by Application 2020 & 2033
Frequently Asked Questions
1. What is the projected Compound Annual Growth Rate (CAGR) of the Geomagnetic Vehicle Detection System?
The projected CAGR is approximately XXX%.
2. Which companies are prominent players in the Geomagnetic Vehicle Detection System?
Key companies in the market include Yangzhou Fama Intelligent Equipment, Smart Parking, Yunex Traffic, KSK Developments, Karrus, UAB Arevita, Guangzhou COMA Electronics.
3. What are the main segments of the Geomagnetic Vehicle Detection System?
The market segments include Application, Type.
4. Can you provide details about the market size?
The market size is estimated to be USD XXX million as of 2022.
5. What are some drivers contributing to market growth?
N/A
6. What are the notable trends driving market growth?
N/A
7. Are there any restraints impacting market growth?
N/A
8. Can you provide examples of recent developments in the market?
N/A
9. What pricing options are available for accessing the report?
Pricing options include single-user, multi-user, and enterprise licenses priced at USD 3950.00, USD 5925.00, and USD 7900.00 respectively.
10. Is the market size provided in terms of value or volume?
The market size is provided in terms of value, measured in million and volume, measured in K.
11. Are there any specific market keywords associated with the report?
Yes, the market keyword associated with the report is "Geomagnetic Vehicle Detection System," which aids in identifying and referencing the specific market segment covered.
12. How do I determine which pricing option suits my needs best?
The pricing options vary based on user requirements and access needs. Individual users may opt for single-user licenses, while businesses requiring broader access may choose multi-user or enterprise licenses for cost-effective access to the report.
13. Are there any additional resources or data provided in the Geomagnetic Vehicle Detection System report?
While the report offers comprehensive insights, it's advisable to review the specific contents or supplementary materials provided to ascertain if additional resources or data are available.
14. How can I stay updated on further developments or reports in the Geomagnetic Vehicle Detection System?
To stay informed about further developments, trends, and reports in the Geomagnetic Vehicle Detection System, consider subscribing to industry newsletters, following relevant companies and organizations, or regularly checking reputable industry news sources and publications.
Methodology
Step 1 - Identification of Relevant Samples Size from Population Database


Step 2 - Approaches for Defining Global Market Size (Value, Volume* & Price*)

Note*: In applicable scenarios
Step 3 - Data Sources
Primary Research
- Web Analytics
- Survey Reports
- Research Institute
- Latest Research Reports
- Opinion Leaders
Secondary Research
- Annual Reports
- White Paper
- Latest Press Release
- Industry Association
- Paid Database
- Investor Presentations

Step 4 - Data Triangulation
Involves using different sources of information in order to increase the validity of a study
These sources are likely to be stakeholders in a program - participants, other researchers, program staff, other community members, and so on.
Then we put all data in single framework & apply various statistical tools to find out the dynamic on the market.
During the analysis stage, feedback from the stakeholder groups would be compared to determine areas of agreement as well as areas of divergence