

Key Insights
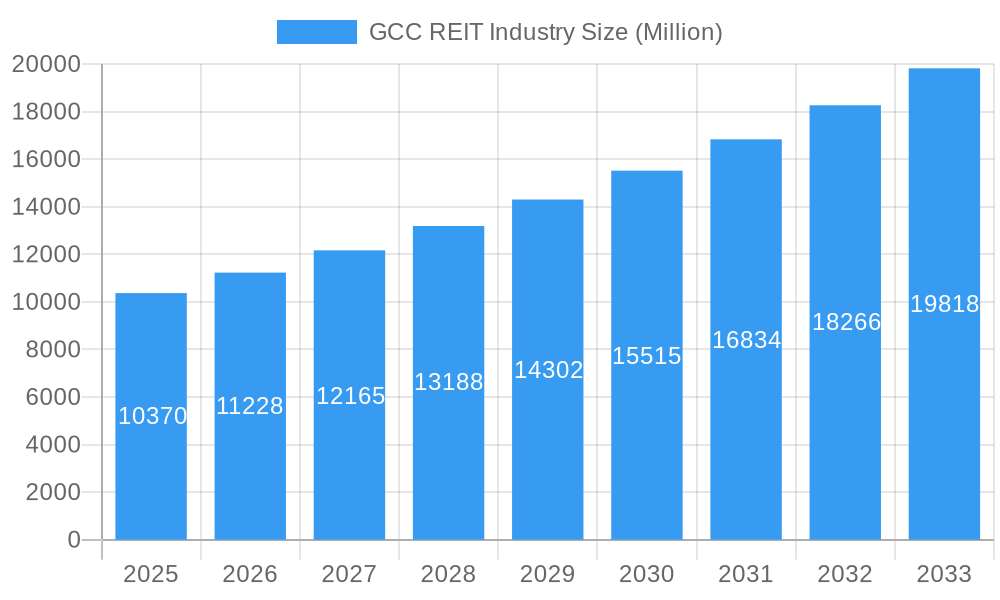
The GCC (Gulf Cooperation Council) REIT (Real Estate Investment Trust) industry exhibits robust growth potential, driven by factors such as increasing urbanization, a burgeoning middle class demanding high-quality residential and commercial spaces, and supportive government policies promoting real estate investment. The market, valued at $10.37 billion in 2025, is projected to experience a compound annual growth rate (CAGR) of 8.24% from 2025 to 2033. This expansion is fueled by the strong performance of both Equity REITs, benefiting from consistent rental income streams, and Mortgage REITs, capitalizing on attractive lending opportunities within the region’s dynamic real estate sector. The diversification of the GCC REIT market across various property types, including commercial, residential, industrial, healthcare, and hospitality, further contributes to its resilience and growth trajectory. Key players like Emaar Malls Group, Aldar Properties, and QREIF are strategically positioned to capitalize on this expansion, leveraging their expertise and established market presence. However, challenges such as potential regulatory changes and fluctuations in global economic conditions could influence the market's growth trajectory.
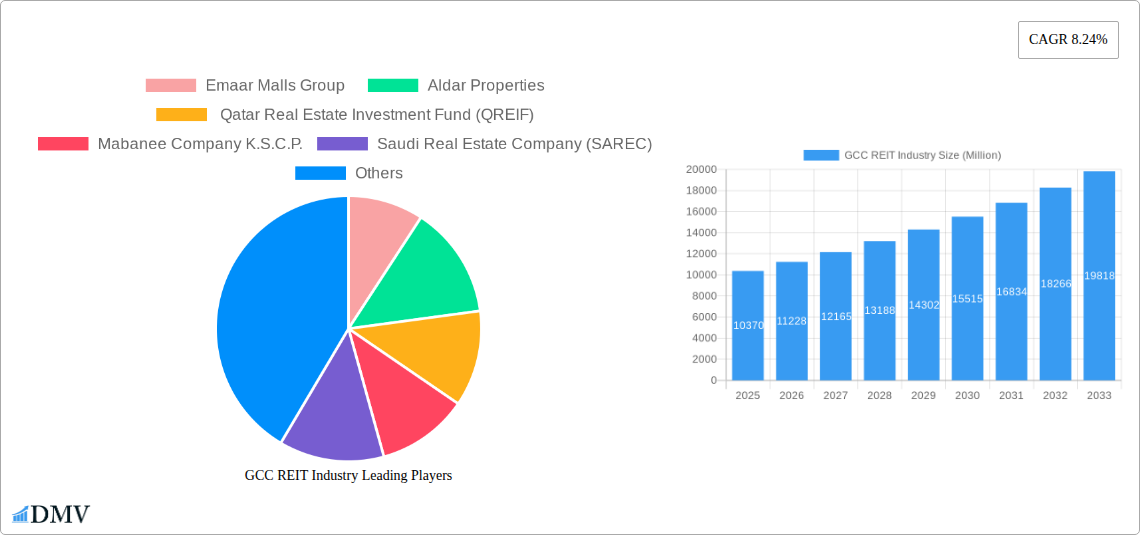
GCC REIT Industry Market Size (In Billion)
Despite the overall positive outlook, specific segments within the GCC REIT market may exhibit varying growth rates. For instance, the residential REIT segment is likely to experience substantial growth due to increased population and demand for housing. The industrial and logistics REIT sector is poised for expansion driven by the region's growing e-commerce sector and supply chain development. While the hospitality segment may experience more volatility, depending on tourism patterns and global events. Further analysis will be needed to determine the precise contribution of each segment to the overall market growth, requiring deeper market-specific data regarding investment flows, occupancy rates, and property values. The overall growth projection, however, signifies a compelling investment landscape for both domestic and international players seeking exposure to the dynamic GCC real estate market.
GCC REIT Industry Company Market Share
GCC REIT Industry: A Comprehensive Market Report (2019-2033)
This insightful report provides a detailed analysis of the GCC REIT industry, offering a comprehensive overview of its market composition, evolution, key players, and future prospects. The study period covers 2019-2033, with a base and estimated year of 2025. This in-depth analysis is crucial for stakeholders seeking to understand the dynamics of this rapidly evolving sector and capitalize on emerging opportunities. The report leverages extensive market research, incorporating financial data and strategic insights to offer a robust forecast for the period 2025-2033. Expect detailed breakdowns across property types (commercial, residential, industrial, healthcare, hospitality) and investment types (equity, mortgage REITs). The projected market value for 2025 is estimated at xx Million.
GCC REIT Industry Market Composition & Trends
This section evaluates the GCC REIT market's competitive landscape, focusing on market concentration, innovation, regulatory frameworks, substitute products, end-user profiles, and mergers & acquisitions (M&A) activity. The report analyzes market share distribution amongst key players, revealing the dominance of certain companies and highlighting emerging trends. M&A activity is analyzed through deal values and their impact on market consolidation. The analysis incorporates data from the historical period (2019-2024) to provide a solid foundation for future projections.
- Market Concentration: Emaar Malls Group, Aldar Properties, and other major players hold significant market share; the exact distribution is analyzed in the full report.
- Innovation Catalysts: Technological advancements like PropTech are driving efficiency and attracting new investment.
- Regulatory Landscape: The introduction of REIT regimes in Saudi Arabia (September 2022) and the DFM's inclusion of REITs (January 2021) significantly shaped the market.
- Substitute Products: Alternative investment options and their competitive impact are assessed.
- End-User Profiles: The report profiles institutional and individual investors, highlighting their preferences and investment strategies.
- M&A Activity: The report details completed and pending M&A transactions, including deal values (in Millions), and analyzes the motives and consequences of these activities. Total M&A deal value in the historical period is estimated at xx Million.
GCC REIT Industry Industry Evolution
This section delves into the historical and projected growth trajectories of the GCC REIT industry, examining technological advancements, evolving consumer preferences, and the resulting market shifts. The analysis covers the historical period (2019-2024) and projects growth rates for the forecast period (2025-2033). The report analyzes the impact of factors such as increasing urbanization, rising disposable incomes, and evolving investment preferences on the sector's growth and expansion. Specific data points, including compound annual growth rates (CAGR) and adoption metrics for new technologies, are provided.
Leading Regions, Countries, or Segments in GCC REIT Industry
This section identifies the dominant regions, countries, and segments within the GCC REIT market. It provides a detailed analysis of the factors driving the leadership of specific segments, including:
- By Property Type: The report identifies the leading property type (e.g., Commercial REITs, Residential REITs) based on market capitalization, rental yields, and growth projections.
- By Investment Type: The report assesses the prevalence of Equity REITs versus Mortgage REITs.
- Key Drivers: Detailed bullet points will explain the factors driving the dominance of the leading segments (e.g., strong government support for commercial real estate, high occupancy rates in specific regions).
The detailed analysis explains the dominance factors, including investment trends, regulatory support, market size, and growth potential.
GCC REIT Industry Product Innovations
This section explores recent product innovations, applications, and performance metrics within the GCC REIT industry. It highlights unique selling propositions (USPs) and technological advancements that have enhanced efficiency, risk management, and investor returns. The discussion includes the integration of PropTech solutions and their impact on the industry.
Propelling Factors for GCC REIT Industry Growth
Several factors are driving the growth of the GCC REIT industry. These include:
- Government Support: The introduction of REIT regulations in various GCC countries is stimulating market expansion.
- Economic Growth: Strong economic growth in the region is fostering higher demand for real estate.
- Technological Advancements: PropTech solutions are boosting efficiency and transparency within the sector.
- Increasing Urbanization: The ongoing urbanization in the GCC is creating a sustained demand for real estate.
Obstacles in the GCC REIT Industry Market
The GCC REIT industry faces certain challenges, including:
- Regulatory Hurdles: Navigating varying regulatory frameworks across different GCC countries can pose difficulties.
- Economic Volatility: Global economic uncertainty can impact investor sentiment and investment flows.
- Competitive Pressures: Competition from other asset classes and established real estate players exists.
- Supply Chain Disruptions: The impact of global supply chain issues on construction and development costs.
Future Opportunities in GCC REIT Industry
The GCC REIT industry presents several promising opportunities, including:
- Expansion into New Markets: Untapped potential exists in certain GCC countries or specific property types.
- Technological Advancements: Further adoption of PropTech solutions can unlock efficiency gains and new revenue streams.
- Infrastructure Development: Large-scale infrastructure projects create significant opportunities.
Major Players in the GCC REIT Industry Ecosystem
- Emaar Malls Group (Emaar Malls Group)
- Aldar Properties (Aldar Properties)
- Qatar Real Estate Investment Fund (QREIF)
- Mabanee Company K.S.C.P.
- Saudi Real Estate Company (SAREC)
- Mall of Oman
- National Real Estate Company (NREC)
Key Developments in GCC REIT Industry Industry
- November 2016: Riyad REIT, the first REIT, listed in Saudi Arabia.
- January 2021: Dubai Financial Market (DFM) begins trading in REITs.
- September 2022: Saudi Arabia introduces a REIT regime.
- July 2022: 17 additional REITs listed in Saudi Arabia following Riyad REIT's listing.
Strategic GCC REIT Industry Market Forecast
The GCC REIT industry is poised for robust growth in the coming years, fueled by supportive government policies, increasing urbanization, and the adoption of technological advancements. The forecast period (2025-2033) anticipates significant market expansion across various segments, presenting considerable investment opportunities. The report provides detailed projections considering various factors impacting industry growth and development. The projected market value for 2033 is estimated at xx Million.
GCC REIT Industry Segmentation
- 1. Production Analysis
- 2. Consumption Analysis
- 3. Import Market Analysis (Value & Volume)
- 4. Export Market Analysis (Value & Volume)
- 5. Price Trend Analysis
GCC REIT Industry Segmentation By Geography
-
1. North America
- 1.1. United States
- 1.2. Canada
- 1.3. Mexico
-
2. South America
- 2.1. Brazil
- 2.2. Argentina
- 2.3. Rest of South America
-
3. Europe
- 3.1. United Kingdom
- 3.2. Germany
- 3.3. France
- 3.4. Italy
- 3.5. Spain
- 3.6. Russia
- 3.7. Benelux
- 3.8. Nordics
- 3.9. Rest of Europe
-
4. Middle East & Africa
- 4.1. Turkey
- 4.2. Israel
- 4.3. GCC
- 4.4. North Africa
- 4.5. South Africa
- 4.6. Rest of Middle East & Africa
-
5. Asia Pacific
- 5.1. China
- 5.2. India
- 5.3. Japan
- 5.4. South Korea
- 5.5. ASEAN
- 5.6. Oceania
- 5.7. Rest of Asia Pacific
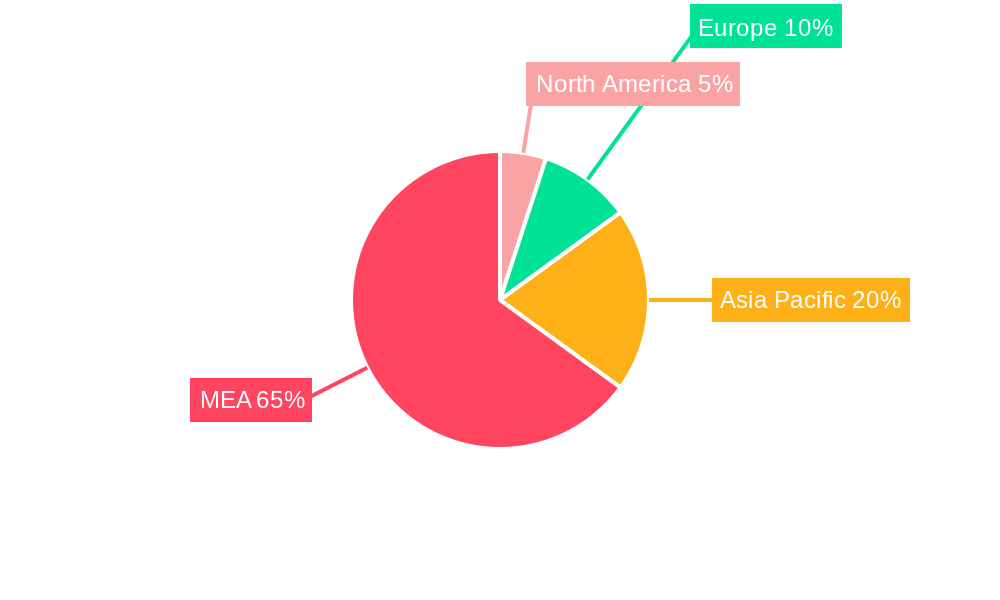
GCC REIT Industry Regional Market Share
Geographic Coverage of GCC REIT Industry
GCC REIT Industry REPORT HIGHLIGHTS
| Aspects | Details |
|---|---|
| Study Period | 2020-2034 |
| Base Year | 2025 |
| Estimated Year | 2026 |
| Forecast Period | 2026-2034 |
| Historical Period | 2020-2025 |
| Growth Rate | CAGR of 8.24% from 2020-2034 |
| Segmentation |
|
Table of Contents
- 1. Introduction
- 1.1. Research Scope
- 1.2. Market Segmentation
- 1.3. Research Objective
- 1.4. Definitions and Assumptions
- 2. Executive Summary
- 2.1. Market Snapshot
- 3. Market Dynamics
- 3.1. Market Drivers
- 3.2. Market Restrains
- 3.3. Market Trends
- 3.4. Market Opportunities
- 4. Market Factor Analysis
- 4.1. Porters Five Forces
- 4.1.1. Bargaining Power of Suppliers
- 4.1.2. Bargaining Power of Buyers
- 4.1.3. Threat of New Entrants
- 4.1.4. Threat of Substitutes
- 4.1.5. Competitive Rivalry
- 4.2. PESTEL analysis
- 4.3. BCG Analysis
- 4.3.1. Stars (High Growth, High Market Share)
- 4.3.2. Cash Cows (Low Growth, High Market Share)
- 4.3.3. Question Mark (High Growth, Low Market Share)
- 4.3.4. Dogs (Low Growth, Low Market Share)
- 4.4. Ansoff Matrix Analysis
- 4.5. Supply Chain Analysis
- 4.6. Regulatory Landscape
- 4.7. Current Market Potential and Opportunity Assessment (TAM–SAM–SOM Framework)
- 4.8. DMV Analyst Note
- 4.1. Porters Five Forces
- 5. Market Analysis, Insights and Forecast 2021-2033
- 5.1. Market Analysis, Insights and Forecast - by Production Analysis
- 5.2. Market Analysis, Insights and Forecast - by Consumption Analysis
- 5.3. Market Analysis, Insights and Forecast - by Import Market Analysis (Value & Volume)
- 5.4. Market Analysis, Insights and Forecast - by Export Market Analysis (Value & Volume)
- 5.5. Market Analysis, Insights and Forecast - by Price Trend Analysis
- 5.6. Market Analysis, Insights and Forecast - by Region
- 5.6.1. North America
- 5.6.2. South America
- 5.6.3. Europe
- 5.6.4. Middle East & Africa
- 5.6.5. Asia Pacific
- 6. Global GCC REIT Industry Analysis, Insights and Forecast, 2021-2033
- 6.1. Market Analysis, Insights and Forecast - by Production Analysis
- 6.2. Market Analysis, Insights and Forecast - by Consumption Analysis
- 6.3. Market Analysis, Insights and Forecast - by Import Market Analysis (Value & Volume)
- 6.4. Market Analysis, Insights and Forecast - by Export Market Analysis (Value & Volume)
- 6.5. Market Analysis, Insights and Forecast - by Price Trend Analysis
- 7. North America GCC REIT Industry Analysis, Insights and Forecast, 2020-2032
- 7.1. Market Analysis, Insights and Forecast - by Production Analysis
- 7.2. Market Analysis, Insights and Forecast - by Consumption Analysis
- 7.3. Market Analysis, Insights and Forecast - by Import Market Analysis (Value & Volume)
- 7.4. Market Analysis, Insights and Forecast - by Export Market Analysis (Value & Volume)
- 7.5. Market Analysis, Insights and Forecast - by Price Trend Analysis
- 8. South America GCC REIT Industry Analysis, Insights and Forecast, 2020-2032
- 8.1. Market Analysis, Insights and Forecast - by Production Analysis
- 8.2. Market Analysis, Insights and Forecast - by Consumption Analysis
- 8.3. Market Analysis, Insights and Forecast - by Import Market Analysis (Value & Volume)
- 8.4. Market Analysis, Insights and Forecast - by Export Market Analysis (Value & Volume)
- 8.5. Market Analysis, Insights and Forecast - by Price Trend Analysis
- 9. Europe GCC REIT Industry Analysis, Insights and Forecast, 2020-2032
- 9.1. Market Analysis, Insights and Forecast - by Production Analysis
- 9.2. Market Analysis, Insights and Forecast - by Consumption Analysis
- 9.3. Market Analysis, Insights and Forecast - by Import Market Analysis (Value & Volume)
- 9.4. Market Analysis, Insights and Forecast - by Export Market Analysis (Value & Volume)
- 9.5. Market Analysis, Insights and Forecast - by Price Trend Analysis
- 10. Middle East & Africa GCC REIT Industry Analysis, Insights and Forecast, 2020-2032
- 10.1. Market Analysis, Insights and Forecast - by Production Analysis
- 10.2. Market Analysis, Insights and Forecast - by Consumption Analysis
- 10.3. Market Analysis, Insights and Forecast - by Import Market Analysis (Value & Volume)
- 10.4. Market Analysis, Insights and Forecast - by Export Market Analysis (Value & Volume)
- 10.5. Market Analysis, Insights and Forecast - by Price Trend Analysis
- 11. Asia Pacific GCC REIT Industry Analysis, Insights and Forecast, 2020-2032
- 11.1. Market Analysis, Insights and Forecast - by Production Analysis
- 11.2. Market Analysis, Insights and Forecast - by Consumption Analysis
- 11.3. Market Analysis, Insights and Forecast - by Import Market Analysis (Value & Volume)
- 11.4. Market Analysis, Insights and Forecast - by Export Market Analysis (Value & Volume)
- 11.5. Market Analysis, Insights and Forecast - by Price Trend Analysis
- 12. Competitive Analysis
- 12.1. Company Profiles
- 12.1.1 Emaar Malls Group
- 12.1.1.1. Company Overview
- 12.1.1.2. Products
- 12.1.1.3. Company Financials
- 12.1.1.4. SWOT Analysis
- 12.1.2 Aldar Properties
- 12.1.2.1. Company Overview
- 12.1.2.2. Products
- 12.1.2.3. Company Financials
- 12.1.2.4. SWOT Analysis
- 12.1.3 Qatar Real Estate Investment Fund (QREIF)
- 12.1.3.1. Company Overview
- 12.1.3.2. Products
- 12.1.3.3. Company Financials
- 12.1.3.4. SWOT Analysis
- 12.1.4 Mabanee Company K.S.C.P.
- 12.1.4.1. Company Overview
- 12.1.4.2. Products
- 12.1.4.3. Company Financials
- 12.1.4.4. SWOT Analysis
- 12.1.5 Saudi Real Estate Company (SAREC)
- 12.1.5.1. Company Overview
- 12.1.5.2. Products
- 12.1.5.3. Company Financials
- 12.1.5.4. SWOT Analysis
- 12.1.6 Mall of Oman
- 12.1.6.1. Company Overview
- 12.1.6.2. Products
- 12.1.6.3. Company Financials
- 12.1.6.4. SWOT Analysis
- 12.1.7 National Real Estate Company (NREC)
- 12.1.7.1. Company Overview
- 12.1.7.2. Products
- 12.1.7.3. Company Financials
- 12.1.7.4. SWOT Analysis
- 12.1.1 Emaar Malls Group
- 12.2. Market Entropy
- 12.2.1 Company's Key Areas Served
- 12.2.2 Recent Developments
- 12.3. Company Market Share Analysis 2025
- 12.3.1 Top 5 Companies Market Share Analysis
- 12.3.2 Top 3 Companies Market Share Analysis
- 12.4. List of Potential Customers
- 13. Research Methodology
List of Figures
- Figure 1: Global GCC REIT Industry Revenue Breakdown (Million, %) by Region 2025 & 2033
- Figure 2: North America GCC REIT Industry Revenue (Million), by Production Analysis 2025 & 2033
- Figure 3: North America GCC REIT Industry Revenue Share (%), by Production Analysis 2025 & 2033
- Figure 4: North America GCC REIT Industry Revenue (Million), by Consumption Analysis 2025 & 2033
- Figure 5: North America GCC REIT Industry Revenue Share (%), by Consumption Analysis 2025 & 2033
- Figure 6: North America GCC REIT Industry Revenue (Million), by Import Market Analysis (Value & Volume) 2025 & 2033
- Figure 7: North America GCC REIT Industry Revenue Share (%), by Import Market Analysis (Value & Volume) 2025 & 2033
- Figure 8: North America GCC REIT Industry Revenue (Million), by Export Market Analysis (Value & Volume) 2025 & 2033
- Figure 9: North America GCC REIT Industry Revenue Share (%), by Export Market Analysis (Value & Volume) 2025 & 2033
- Figure 10: North America GCC REIT Industry Revenue (Million), by Price Trend Analysis 2025 & 2033
- Figure 11: North America GCC REIT Industry Revenue Share (%), by Price Trend Analysis 2025 & 2033
- Figure 12: North America GCC REIT Industry Revenue (Million), by Country 2025 & 2033
- Figure 13: North America GCC REIT Industry Revenue Share (%), by Country 2025 & 2033
- Figure 14: South America GCC REIT Industry Revenue (Million), by Production Analysis 2025 & 2033
- Figure 15: South America GCC REIT Industry Revenue Share (%), by Production Analysis 2025 & 2033
- Figure 16: South America GCC REIT Industry Revenue (Million), by Consumption Analysis 2025 & 2033
- Figure 17: South America GCC REIT Industry Revenue Share (%), by Consumption Analysis 2025 & 2033
- Figure 18: South America GCC REIT Industry Revenue (Million), by Import Market Analysis (Value & Volume) 2025 & 2033
- Figure 19: South America GCC REIT Industry Revenue Share (%), by Import Market Analysis (Value & Volume) 2025 & 2033
- Figure 20: South America GCC REIT Industry Revenue (Million), by Export Market Analysis (Value & Volume) 2025 & 2033
- Figure 21: South America GCC REIT Industry Revenue Share (%), by Export Market Analysis (Value & Volume) 2025 & 2033
- Figure 22: South America GCC REIT Industry Revenue (Million), by Price Trend Analysis 2025 & 2033
- Figure 23: South America GCC REIT Industry Revenue Share (%), by Price Trend Analysis 2025 & 2033
- Figure 24: South America GCC REIT Industry Revenue (Million), by Country 2025 & 2033
- Figure 25: South America GCC REIT Industry Revenue Share (%), by Country 2025 & 2033
- Figure 26: Europe GCC REIT Industry Revenue (Million), by Production Analysis 2025 & 2033
- Figure 27: Europe GCC REIT Industry Revenue Share (%), by Production Analysis 2025 & 2033
- Figure 28: Europe GCC REIT Industry Revenue (Million), by Consumption Analysis 2025 & 2033
- Figure 29: Europe GCC REIT Industry Revenue Share (%), by Consumption Analysis 2025 & 2033
- Figure 30: Europe GCC REIT Industry Revenue (Million), by Import Market Analysis (Value & Volume) 2025 & 2033
- Figure 31: Europe GCC REIT Industry Revenue Share (%), by Import Market Analysis (Value & Volume) 2025 & 2033
- Figure 32: Europe GCC REIT Industry Revenue (Million), by Export Market Analysis (Value & Volume) 2025 & 2033
- Figure 33: Europe GCC REIT Industry Revenue Share (%), by Export Market Analysis (Value & Volume) 2025 & 2033
- Figure 34: Europe GCC REIT Industry Revenue (Million), by Price Trend Analysis 2025 & 2033
- Figure 35: Europe GCC REIT Industry Revenue Share (%), by Price Trend Analysis 2025 & 2033
- Figure 36: Europe GCC REIT Industry Revenue (Million), by Country 2025 & 2033
- Figure 37: Europe GCC REIT Industry Revenue Share (%), by Country 2025 & 2033
- Figure 38: Middle East & Africa GCC REIT Industry Revenue (Million), by Production Analysis 2025 & 2033
- Figure 39: Middle East & Africa GCC REIT Industry Revenue Share (%), by Production Analysis 2025 & 2033
- Figure 40: Middle East & Africa GCC REIT Industry Revenue (Million), by Consumption Analysis 2025 & 2033
- Figure 41: Middle East & Africa GCC REIT Industry Revenue Share (%), by Consumption Analysis 2025 & 2033
- Figure 42: Middle East & Africa GCC REIT Industry Revenue (Million), by Import Market Analysis (Value & Volume) 2025 & 2033
- Figure 43: Middle East & Africa GCC REIT Industry Revenue Share (%), by Import Market Analysis (Value & Volume) 2025 & 2033
- Figure 44: Middle East & Africa GCC REIT Industry Revenue (Million), by Export Market Analysis (Value & Volume) 2025 & 2033
- Figure 45: Middle East & Africa GCC REIT Industry Revenue Share (%), by Export Market Analysis (Value & Volume) 2025 & 2033
- Figure 46: Middle East & Africa GCC REIT Industry Revenue (Million), by Price Trend Analysis 2025 & 2033
- Figure 47: Middle East & Africa GCC REIT Industry Revenue Share (%), by Price Trend Analysis 2025 & 2033
- Figure 48: Middle East & Africa GCC REIT Industry Revenue (Million), by Country 2025 & 2033
- Figure 49: Middle East & Africa GCC REIT Industry Revenue Share (%), by Country 2025 & 2033
- Figure 50: Asia Pacific GCC REIT Industry Revenue (Million), by Production Analysis 2025 & 2033
- Figure 51: Asia Pacific GCC REIT Industry Revenue Share (%), by Production Analysis 2025 & 2033
- Figure 52: Asia Pacific GCC REIT Industry Revenue (Million), by Consumption Analysis 2025 & 2033
- Figure 53: Asia Pacific GCC REIT Industry Revenue Share (%), by Consumption Analysis 2025 & 2033
- Figure 54: Asia Pacific GCC REIT Industry Revenue (Million), by Import Market Analysis (Value & Volume) 2025 & 2033
- Figure 55: Asia Pacific GCC REIT Industry Revenue Share (%), by Import Market Analysis (Value & Volume) 2025 & 2033
- Figure 56: Asia Pacific GCC REIT Industry Revenue (Million), by Export Market Analysis (Value & Volume) 2025 & 2033
- Figure 57: Asia Pacific GCC REIT Industry Revenue Share (%), by Export Market Analysis (Value & Volume) 2025 & 2033
- Figure 58: Asia Pacific GCC REIT Industry Revenue (Million), by Price Trend Analysis 2025 & 2033
- Figure 59: Asia Pacific GCC REIT Industry Revenue Share (%), by Price Trend Analysis 2025 & 2033
- Figure 60: Asia Pacific GCC REIT Industry Revenue (Million), by Country 2025 & 2033
- Figure 61: Asia Pacific GCC REIT Industry Revenue Share (%), by Country 2025 & 2033
List of Tables
- Table 1: Global GCC REIT Industry Revenue Million Forecast, by Production Analysis 2020 & 2033
- Table 2: Global GCC REIT Industry Revenue Million Forecast, by Consumption Analysis 2020 & 2033
- Table 3: Global GCC REIT Industry Revenue Million Forecast, by Import Market Analysis (Value & Volume) 2020 & 2033
- Table 4: Global GCC REIT Industry Revenue Million Forecast, by Export Market Analysis (Value & Volume) 2020 & 2033
- Table 5: Global GCC REIT Industry Revenue Million Forecast, by Price Trend Analysis 2020 & 2033
- Table 6: Global GCC REIT Industry Revenue Million Forecast, by Region 2020 & 2033
- Table 7: Global GCC REIT Industry Revenue Million Forecast, by Production Analysis 2020 & 2033
- Table 8: Global GCC REIT Industry Revenue Million Forecast, by Consumption Analysis 2020 & 2033
- Table 9: Global GCC REIT Industry Revenue Million Forecast, by Import Market Analysis (Value & Volume) 2020 & 2033
- Table 10: Global GCC REIT Industry Revenue Million Forecast, by Export Market Analysis (Value & Volume) 2020 & 2033
- Table 11: Global GCC REIT Industry Revenue Million Forecast, by Price Trend Analysis 2020 & 2033
- Table 12: Global GCC REIT Industry Revenue Million Forecast, by Country 2020 & 2033
- Table 13: United States GCC REIT Industry Revenue (Million) Forecast, by Application 2020 & 2033
- Table 14: Canada GCC REIT Industry Revenue (Million) Forecast, by Application 2020 & 2033
- Table 15: Mexico GCC REIT Industry Revenue (Million) Forecast, by Application 2020 & 2033
- Table 16: Global GCC REIT Industry Revenue Million Forecast, by Production Analysis 2020 & 2033
- Table 17: Global GCC REIT Industry Revenue Million Forecast, by Consumption Analysis 2020 & 2033
- Table 18: Global GCC REIT Industry Revenue Million Forecast, by Import Market Analysis (Value & Volume) 2020 & 2033
- Table 19: Global GCC REIT Industry Revenue Million Forecast, by Export Market Analysis (Value & Volume) 2020 & 2033
- Table 20: Global GCC REIT Industry Revenue Million Forecast, by Price Trend Analysis 2020 & 2033
- Table 21: Global GCC REIT Industry Revenue Million Forecast, by Country 2020 & 2033
- Table 22: Brazil GCC REIT Industry Revenue (Million) Forecast, by Application 2020 & 2033
- Table 23: Argentina GCC REIT Industry Revenue (Million) Forecast, by Application 2020 & 2033
- Table 24: Rest of South America GCC REIT Industry Revenue (Million) Forecast, by Application 2020 & 2033
- Table 25: Global GCC REIT Industry Revenue Million Forecast, by Production Analysis 2020 & 2033
- Table 26: Global GCC REIT Industry Revenue Million Forecast, by Consumption Analysis 2020 & 2033
- Table 27: Global GCC REIT Industry Revenue Million Forecast, by Import Market Analysis (Value & Volume) 2020 & 2033
- Table 28: Global GCC REIT Industry Revenue Million Forecast, by Export Market Analysis (Value & Volume) 2020 & 2033
- Table 29: Global GCC REIT Industry Revenue Million Forecast, by Price Trend Analysis 2020 & 2033
- Table 30: Global GCC REIT Industry Revenue Million Forecast, by Country 2020 & 2033
- Table 31: United Kingdom GCC REIT Industry Revenue (Million) Forecast, by Application 2020 & 2033
- Table 32: Germany GCC REIT Industry Revenue (Million) Forecast, by Application 2020 & 2033
- Table 33: France GCC REIT Industry Revenue (Million) Forecast, by Application 2020 & 2033
- Table 34: Italy GCC REIT Industry Revenue (Million) Forecast, by Application 2020 & 2033
- Table 35: Spain GCC REIT Industry Revenue (Million) Forecast, by Application 2020 & 2033
- Table 36: Russia GCC REIT Industry Revenue (Million) Forecast, by Application 2020 & 2033
- Table 37: Benelux GCC REIT Industry Revenue (Million) Forecast, by Application 2020 & 2033
- Table 38: Nordics GCC REIT Industry Revenue (Million) Forecast, by Application 2020 & 2033
- Table 39: Rest of Europe GCC REIT Industry Revenue (Million) Forecast, by Application 2020 & 2033
- Table 40: Global GCC REIT Industry Revenue Million Forecast, by Production Analysis 2020 & 2033
- Table 41: Global GCC REIT Industry Revenue Million Forecast, by Consumption Analysis 2020 & 2033
- Table 42: Global GCC REIT Industry Revenue Million Forecast, by Import Market Analysis (Value & Volume) 2020 & 2033
- Table 43: Global GCC REIT Industry Revenue Million Forecast, by Export Market Analysis (Value & Volume) 2020 & 2033
- Table 44: Global GCC REIT Industry Revenue Million Forecast, by Price Trend Analysis 2020 & 2033
- Table 45: Global GCC REIT Industry Revenue Million Forecast, by Country 2020 & 2033
- Table 46: Turkey GCC REIT Industry Revenue (Million) Forecast, by Application 2020 & 2033
- Table 47: Israel GCC REIT Industry Revenue (Million) Forecast, by Application 2020 & 2033
- Table 48: GCC GCC REIT Industry Revenue (Million) Forecast, by Application 2020 & 2033
- Table 49: North Africa GCC REIT Industry Revenue (Million) Forecast, by Application 2020 & 2033
- Table 50: South Africa GCC REIT Industry Revenue (Million) Forecast, by Application 2020 & 2033
- Table 51: Rest of Middle East & Africa GCC REIT Industry Revenue (Million) Forecast, by Application 2020 & 2033
- Table 52: Global GCC REIT Industry Revenue Million Forecast, by Production Analysis 2020 & 2033
- Table 53: Global GCC REIT Industry Revenue Million Forecast, by Consumption Analysis 2020 & 2033
- Table 54: Global GCC REIT Industry Revenue Million Forecast, by Import Market Analysis (Value & Volume) 2020 & 2033
- Table 55: Global GCC REIT Industry Revenue Million Forecast, by Export Market Analysis (Value & Volume) 2020 & 2033
- Table 56: Global GCC REIT Industry Revenue Million Forecast, by Price Trend Analysis 2020 & 2033
- Table 57: Global GCC REIT Industry Revenue Million Forecast, by Country 2020 & 2033
- Table 58: China GCC REIT Industry Revenue (Million) Forecast, by Application 2020 & 2033
- Table 59: India GCC REIT Industry Revenue (Million) Forecast, by Application 2020 & 2033
- Table 60: Japan GCC REIT Industry Revenue (Million) Forecast, by Application 2020 & 2033
- Table 61: South Korea GCC REIT Industry Revenue (Million) Forecast, by Application 2020 & 2033
- Table 62: ASEAN GCC REIT Industry Revenue (Million) Forecast, by Application 2020 & 2033
- Table 63: Oceania GCC REIT Industry Revenue (Million) Forecast, by Application 2020 & 2033
- Table 64: Rest of Asia Pacific GCC REIT Industry Revenue (Million) Forecast, by Application 2020 & 2033
Frequently Asked Questions
1. What is the projected Compound Annual Growth Rate (CAGR) of the GCC REIT Industry?
The projected CAGR is approximately 8.24%.
2. Which companies are prominent players in the GCC REIT Industry?
Key companies in the market include Emaar Malls Group , Aldar Properties , Qatar Real Estate Investment Fund (QREIF) , Mabanee Company K.S.C.P., Saudi Real Estate Company (SAREC) , Mall of Oman , National Real Estate Company (NREC) .
3. What are the main segments of the GCC REIT Industry?
The market segments include Production Analysis, Consumption Analysis, Import Market Analysis (Value & Volume), Export Market Analysis (Value & Volume), Price Trend Analysis.
4. Can you provide details about the market size?
The market size is estimated to be USD 10.37 Million as of 2022.
5. What are some drivers contributing to market growth?
Fund Inflows is Driving the ETF Market.
6. What are the notable trends driving market growth?
Growing Asset Allocation to Real Estate by Large Investors in The Region.
7. Are there any restraints impacting market growth?
Underlying Fluctuations and Risks are Restraining the Market.
8. Can you provide examples of recent developments in the market?
In September 2022, Saudi Arabia introduced a real estate investment trust (REIT) regime. In November 2016, Riyad REIT was the first REIT to be listed in Saudi Arabia (and only the second REIT to be listed in the Middle East), which was followed by another 17 REITs up to July 2022, with a number of them also increasing their capital to acquire additional assets.
9. What pricing options are available for accessing the report?
Pricing options include single-user, multi-user, and enterprise licenses priced at USD 3800, USD 4500, and USD 5800 respectively.
10. Is the market size provided in terms of value or volume?
The market size is provided in terms of value, measured in Million.
11. Are there any specific market keywords associated with the report?
Yes, the market keyword associated with the report is "GCC REIT Industry," which aids in identifying and referencing the specific market segment covered.
12. How do I determine which pricing option suits my needs best?
The pricing options vary based on user requirements and access needs. Individual users may opt for single-user licenses, while businesses requiring broader access may choose multi-user or enterprise licenses for cost-effective access to the report.
13. Are there any additional resources or data provided in the GCC REIT Industry report?
While the report offers comprehensive insights, it's advisable to review the specific contents or supplementary materials provided to ascertain if additional resources or data are available.
14. How can I stay updated on further developments or reports in the GCC REIT Industry?
To stay informed about further developments, trends, and reports in the GCC REIT Industry, consider subscribing to industry newsletters, following relevant companies and organizations, or regularly checking reputable industry news sources and publications.
Methodology
Step 1 - Identification of Relevant Samples Size from Population Database


Step 2 - Approaches for Defining Global Market Size (Value, Volume* & Price*)

Note*: In applicable scenarios
Step 3 - Data Sources
Primary Research
- Web Analytics
- Survey Reports
- Research Institute
- Latest Research Reports
- Opinion Leaders
Secondary Research
- Annual Reports
- White Paper
- Latest Press Release
- Industry Association
- Paid Database
- Investor Presentations

Step 4 - Data Triangulation
Involves using different sources of information in order to increase the validity of a study
These sources are likely to be stakeholders in a program - participants, other researchers, program staff, other community members, and so on.
Then we put all data in single framework & apply various statistical tools to find out the dynamic on the market.
During the analysis stage, feedback from the stakeholder groups would be compared to determine areas of agreement as well as areas of divergence