

Key Insights
The global galvanized cable tray market, valued at approximately $4.172 billion in 2025, is projected to experience robust growth, driven by the expanding construction and infrastructure sectors worldwide. The increasing demand for reliable and efficient electrical power distribution systems in commercial, industrial, and residential buildings fuels market expansion. Furthermore, the inherent advantages of galvanized steel, such as its corrosion resistance, durability, and cost-effectiveness, contribute significantly to its widespread adoption. Stringent safety regulations regarding electrical installations in several regions also mandate the use of robust and compliant cable management systems, bolstering market demand. Technological advancements in cable tray design, encompassing lighter, more modular systems, are streamlining installation processes and lowering overall project costs. This trend, coupled with the growing adoption of prefabricated and modular construction techniques, is positively impacting market dynamics. Competitive pressures are shaping the market landscape, with established players such as Legrand and Eaton competing with regional manufacturers to offer a wide array of products catering to diverse needs and budgets.
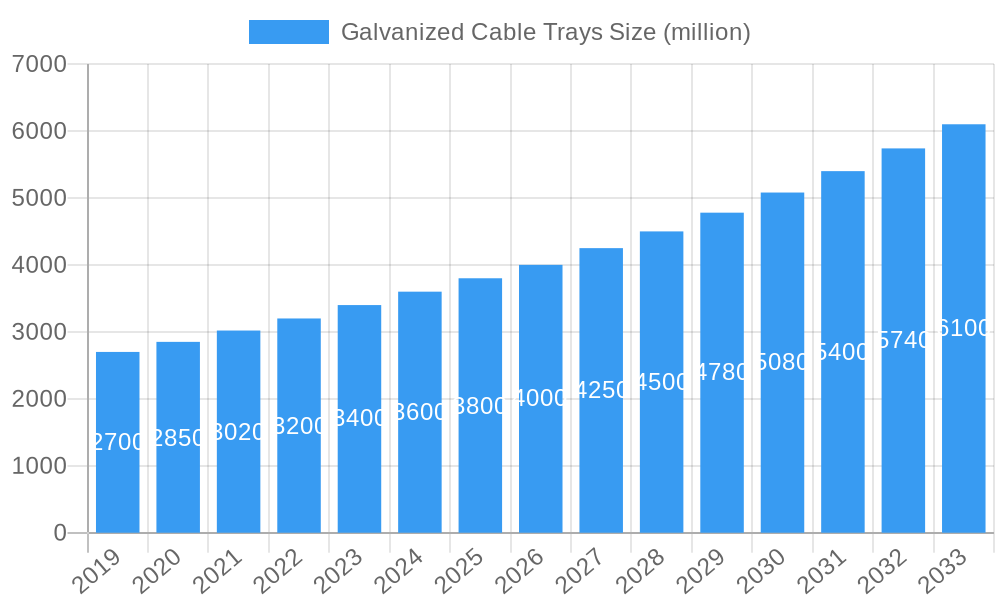
Galvanized Cable Trays Market Size (In Billion)
However, the market faces certain restraints. Fluctuations in raw material prices, particularly steel, can impact production costs and profitability. Additionally, the increasing adoption of alternative cable management solutions, like trenching and wireways, in specific applications presents a challenge. Nevertheless, the long-term outlook for the galvanized cable tray market remains positive, driven by sustained growth in infrastructure development, particularly in emerging economies. The consistent need for reliable and safe electrical infrastructure will continue to be a key driver. Market segmentation analysis suggests that the industrial sector is the largest consumer, while regional growth is expected to be significantly higher in the Asia-Pacific region given its rapid industrialization. A more detailed segmental breakdown, while not provided, would reveal further opportunities within this dynamic market.
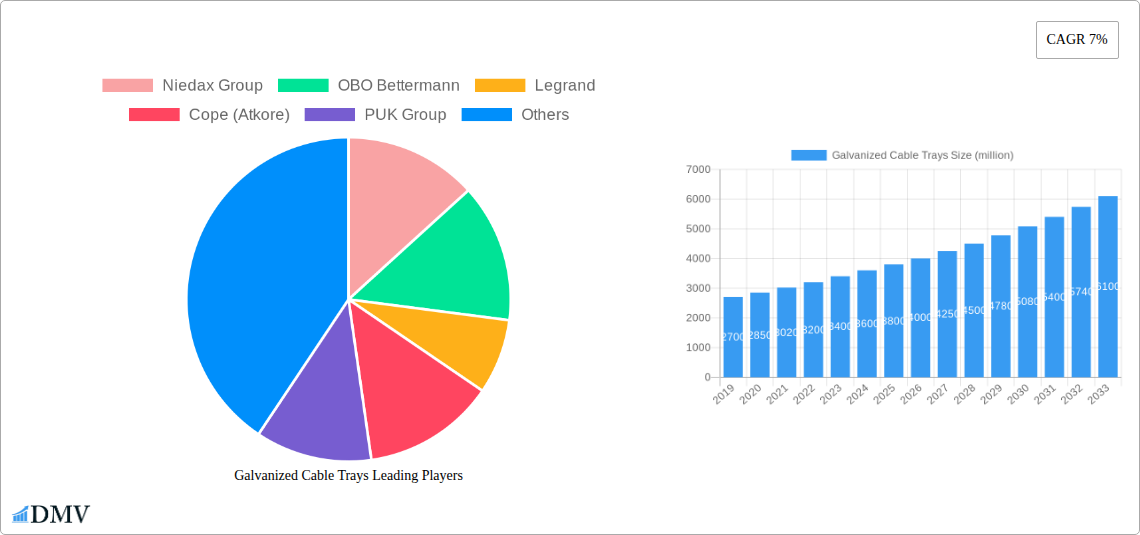
Galvanized Cable Trays Company Market Share
Galvanized Cable Trays Market Report: A Comprehensive Analysis of a Multi-Billion Dollar Industry (2019-2033)
This insightful report delivers a comprehensive analysis of the global galvanized cable trays market, projecting a market value exceeding $XX billion by 2033. It provides a detailed examination of market dynamics, competitive landscapes, and future growth prospects, offering invaluable insights for stakeholders across the value chain. The study period covers 2019-2033, with a base year of 2025 and a forecast period of 2025-2033.
Galvanized Cable Trays Market Composition & Trends
This section delves into the intricate structure of the galvanized cable trays market, evaluating its concentration, innovation drivers, regulatory frameworks, and competitive dynamics. We analyze the market share distribution among key players, including Niedax Group, OBO Bettermann, Legrand, Cope (Atkore), PUK Group, and others, revealing a market dominated by a few major players and several regional contenders. The report assesses the impact of mergers and acquisitions (M&A) activities, with estimated M&A deal values exceeding $XX billion in the historical period (2019-2024). Innovation is examined through the lens of material advancements, design improvements, and the incorporation of smart technologies. Regulatory influences, encompassing safety standards and environmental regulations, are thoroughly explored. Finally, we analyze the competitive landscape, considering substitute products and their market penetration.
- Market Share Distribution: Niedax Group holds an estimated xx% market share, followed by Legrand at xx%, OBO Bettermann at xx%, and Cope (Atkore) at xx%. The remaining market share is distributed amongst other players, with a significant portion attributed to regional players.
- M&A Activity (2019-2024): Total estimated deal value: $XX billion, with the largest deal involving [mention largest deal if data available, otherwise use "a key player acquisition"] for $XX billion.
- Key Innovation Catalysts: Demand for enhanced fire safety features, lightweight designs, and increased cable capacity are major drivers of innovation.
- Regulatory Landscape: Compliance with international safety standards (e.g., IEC, UL) significantly impacts market trends.
- Substitute Products: PVC conduits and other cable management systems present a competitive challenge.
Galvanized Cable Trays Industry Evolution
This section charts the transformative journey of the galvanized cable trays industry, analyzing its growth trajectory, technological leaps, and evolving customer demands. The report meticulously traces the industry's growth rate, revealing a CAGR of xx% during the historical period (2019-2024) and projecting a CAGR of xx% during the forecast period (2025-2033). This growth is spurred by the expanding adoption of galvanized cable trays across diverse sectors, including construction, infrastructure, and industrial automation. The rise of smart buildings and the growing demand for efficient energy distribution solutions are also pivotal factors influencing the market's trajectory. Technological progress encompasses advancements in materials science, leading to improved corrosion resistance and durability, as well as streamlined manufacturing processes.
Leading Regions, Countries, or Segments in Galvanized Cable Trays
This section identifies the dominant regions, countries, and segments within the galvanized cable trays market. Analysis shows that [mention dominant region, e.g., North America] currently holds the largest market share, driven by robust construction activity and a high density of industrial facilities. [Mention dominant country within the region, and secondary regions].
Key Drivers for Dominance in [Dominant Region]:
- Significant investments in infrastructure projects.
- Stringent building codes promoting the use of safe and reliable cable management systems.
- A well-established network of manufacturers and distributors.
In-depth Analysis of Dominance Factors: The strong presence of major players, coupled with government initiatives encouraging infrastructure development, fuels market growth in [Dominant Region]. In contrast, [Secondary Region] demonstrates significant growth potential driven by factors such as [mention specific reasons, e.g., rapid industrialization].
Galvanized Cable Trays Product Innovations
Recent product innovations include the development of lightweight, high-capacity trays incorporating advanced coatings for enhanced corrosion protection. The integration of smart sensors for real-time cable monitoring and predictive maintenance is also gaining traction. These innovations offer improved safety, efficiency, and reduced maintenance costs, making them highly appealing to end-users. Key selling points include improved durability, ease of installation, and cost-effectiveness.
Propelling Factors for Galvanized Cable Trays Growth
Several factors fuel the growth of the galvanized cable trays market. The surge in infrastructure development globally, coupled with the increasing demand for reliable and efficient power distribution across various sectors (industrial, commercial, and residential), is a primary driver. Additionally, stringent safety regulations, mandating robust cable management systems, propel adoption. Technological advancements, such as lighter and more durable materials, further enhance market growth.
Obstacles in the Galvanized Cable Trays Market
Despite the promising outlook, challenges remain. Fluctuations in raw material prices (e.g., steel and zinc) directly impact manufacturing costs and profitability. Supply chain disruptions, particularly affecting zinc supply, can constrain production. Furthermore, intense competition among established players and emerging manufacturers creates a dynamic and challenging market landscape. These factors collectively contribute to potential market volatility.
Future Opportunities in Galvanized Cable Trays
Emerging opportunities include the expanding adoption of galvanized cable trays in renewable energy projects (solar, wind) and data centers. The rising demand for sustainable and environmentally friendly cable management solutions also presents significant growth potential. Furthermore, integration with smart building technologies and the Internet of Things (IoT) offers new avenues for market expansion.
Major Players in the Galvanized Cable Trays Ecosystem
- Niedax Group
- OBO Bettermann
- Legrand
- Cope (Atkore)
- PUK Group
- Oglaend (Hilti)
- Unitech (IKK)
- HUAPENG
- BAKS
- ABB Installation Products
- Unistrut (Atkore)
- DKC Group
- Daqo Group
- Storskogen
- Cooper B-Line (Eaton)
- Pemsa Cable Management
- Basor Electric, S.A.
- Korvest
- Marco Cable Management (Atkore)
- Yaming
- Wanqi Group
- IEK Group
- ASD-Electric
- Hebei Longxin
- Poleoduto
- Indiana Group
- ESZ Company
- TAIF
Key Developments in Galvanized Cable Trays Industry
- 2022 Q3: Legrand announced the launch of a new line of lightweight galvanized cable trays incorporating advanced coating technology.
- 2021 Q4: A significant merger between [mention a merger if data available, otherwise state "two key players" ] reshaped the competitive landscape.
- 2020 Q1: New safety regulations in [mention region] impacted the market, driving the adoption of enhanced safety features in cable trays.
- [Add further developments as available, including dates and impacts]
Strategic Galvanized Cable Trays Market Forecast
The galvanized cable trays market is poised for continued growth, driven by sustained investments in infrastructure, technological advancements, and expanding industrial automation. The forecast period (2025-2033) anticipates robust growth, primarily fueled by the increasing adoption of advanced features and the expanding application across diverse sectors. The integration of smart technologies and sustainable solutions further strengthens the long-term outlook. The market is expected to reach $XX billion by 2033.
Galvanized Cable Trays Segmentation
-
1. Application
- 1.1. undefined
-
2. Type
- 2.1. undefined
Galvanized Cable Trays Segmentation By Geography
- 1. undefined
- 2. undefined
- 3. undefined
- 4. undefined
- 5. undefined
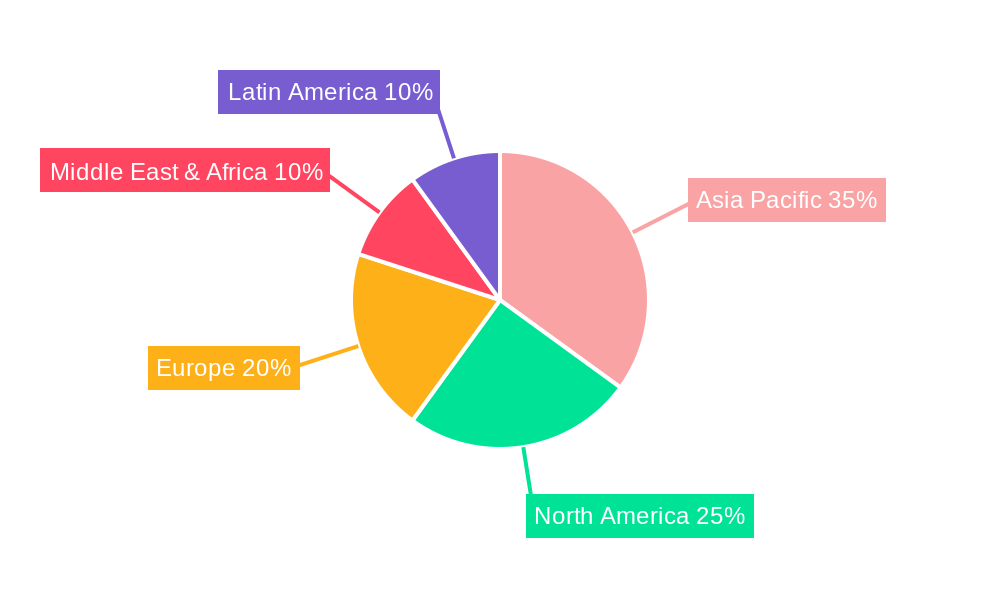
Galvanized Cable Trays Regional Market Share
Geographic Coverage of Galvanized Cable Trays
Galvanized Cable Trays REPORT HIGHLIGHTS
| Aspects | Details |
|---|---|
| Study Period | 2020-2034 |
| Base Year | 2025 |
| Estimated Year | 2026 |
| Forecast Period | 2026-2034 |
| Historical Period | 2020-2025 |
| Growth Rate | CAGR of 7% from 2020-2034 |
| Segmentation |
|
Table of Contents
- 1. Introduction
- 1.1. Research Scope
- 1.2. Market Segmentation
- 1.3. Research Methodology
- 1.4. Definitions and Assumptions
- 2. Executive Summary
- 2.1. Introduction
- 3. Market Dynamics
- 3.1. Introduction
- 3.2. Market Drivers
- 3.3. Market Restrains
- 3.4. Market Trends
- 4. Market Factor Analysis
- 4.1. Porters Five Forces
- 4.2. Supply/Value Chain
- 4.3. PESTEL analysis
- 4.4. Market Entropy
- 4.5. Patent/Trademark Analysis
- 5. Global Galvanized Cable Trays Analysis, Insights and Forecast, 2020-2032
- 5.1. Market Analysis, Insights and Forecast - by Application
- 5.1.1.
- 5.2. Market Analysis, Insights and Forecast - by Type
- 5.2.1.
- 5.3. Market Analysis, Insights and Forecast - by Region
- 5.3.1.
- 5.3.2.
- 5.3.3.
- 5.3.4.
- 5.3.5.
- 5.1. Market Analysis, Insights and Forecast - by Application
- 6. undefined Galvanized Cable Trays Analysis, Insights and Forecast, 2020-2032
- 6.1. Market Analysis, Insights and Forecast - by Application
- 6.1.1.
- 6.2. Market Analysis, Insights and Forecast - by Type
- 6.2.1.
- 6.1. Market Analysis, Insights and Forecast - by Application
- 7. undefined Galvanized Cable Trays Analysis, Insights and Forecast, 2020-2032
- 7.1. Market Analysis, Insights and Forecast - by Application
- 7.1.1.
- 7.2. Market Analysis, Insights and Forecast - by Type
- 7.2.1.
- 7.1. Market Analysis, Insights and Forecast - by Application
- 8. undefined Galvanized Cable Trays Analysis, Insights and Forecast, 2020-2032
- 8.1. Market Analysis, Insights and Forecast - by Application
- 8.1.1.
- 8.2. Market Analysis, Insights and Forecast - by Type
- 8.2.1.
- 8.1. Market Analysis, Insights and Forecast - by Application
- 9. undefined Galvanized Cable Trays Analysis, Insights and Forecast, 2020-2032
- 9.1. Market Analysis, Insights and Forecast - by Application
- 9.1.1.
- 9.2. Market Analysis, Insights and Forecast - by Type
- 9.2.1.
- 9.1. Market Analysis, Insights and Forecast - by Application
- 10. undefined Galvanized Cable Trays Analysis, Insights and Forecast, 2020-2032
- 10.1. Market Analysis, Insights and Forecast - by Application
- 10.1.1.
- 10.2. Market Analysis, Insights and Forecast - by Type
- 10.2.1.
- 10.1. Market Analysis, Insights and Forecast - by Application
- 11. Competitive Analysis
- 11.1. Global Market Share Analysis 2025
- 11.2. Company Profiles
- 11.2.1 Niedax Group
- 11.2.1.1. Overview
- 11.2.1.2. Products
- 11.2.1.3. SWOT Analysis
- 11.2.1.4. Recent Developments
- 11.2.1.5. Financials (Based on Availability)
- 11.2.2 OBO Bettermann
- 11.2.2.1. Overview
- 11.2.2.2. Products
- 11.2.2.3. SWOT Analysis
- 11.2.2.4. Recent Developments
- 11.2.2.5. Financials (Based on Availability)
- 11.2.3 Legrand
- 11.2.3.1. Overview
- 11.2.3.2. Products
- 11.2.3.3. SWOT Analysis
- 11.2.3.4. Recent Developments
- 11.2.3.5. Financials (Based on Availability)
- 11.2.4 Cope (Atkore)
- 11.2.4.1. Overview
- 11.2.4.2. Products
- 11.2.4.3. SWOT Analysis
- 11.2.4.4. Recent Developments
- 11.2.4.5. Financials (Based on Availability)
- 11.2.5 PUK Group
- 11.2.5.1. Overview
- 11.2.5.2. Products
- 11.2.5.3. SWOT Analysis
- 11.2.5.4. Recent Developments
- 11.2.5.5. Financials (Based on Availability)
- 11.2.6 Oglaend (Hilti)
- 11.2.6.1. Overview
- 11.2.6.2. Products
- 11.2.6.3. SWOT Analysis
- 11.2.6.4. Recent Developments
- 11.2.6.5. Financials (Based on Availability)
- 11.2.7 Unitech (IKK)
- 11.2.7.1. Overview
- 11.2.7.2. Products
- 11.2.7.3. SWOT Analysis
- 11.2.7.4. Recent Developments
- 11.2.7.5. Financials (Based on Availability)
- 11.2.8 HUAPENG
- 11.2.8.1. Overview
- 11.2.8.2. Products
- 11.2.8.3. SWOT Analysis
- 11.2.8.4. Recent Developments
- 11.2.8.5. Financials (Based on Availability)
- 11.2.9 BAKS
- 11.2.9.1. Overview
- 11.2.9.2. Products
- 11.2.9.3. SWOT Analysis
- 11.2.9.4. Recent Developments
- 11.2.9.5. Financials (Based on Availability)
- 11.2.10 ABB Installation Products
- 11.2.10.1. Overview
- 11.2.10.2. Products
- 11.2.10.3. SWOT Analysis
- 11.2.10.4. Recent Developments
- 11.2.10.5. Financials (Based on Availability)
- 11.2.11 Unistrut (Atkore)
- 11.2.11.1. Overview
- 11.2.11.2. Products
- 11.2.11.3. SWOT Analysis
- 11.2.11.4. Recent Developments
- 11.2.11.5. Financials (Based on Availability)
- 11.2.12 DKC Group
- 11.2.12.1. Overview
- 11.2.12.2. Products
- 11.2.12.3. SWOT Analysis
- 11.2.12.4. Recent Developments
- 11.2.12.5. Financials (Based on Availability)
- 11.2.13 Daqo Group
- 11.2.13.1. Overview
- 11.2.13.2. Products
- 11.2.13.3. SWOT Analysis
- 11.2.13.4. Recent Developments
- 11.2.13.5. Financials (Based on Availability)
- 11.2.14 Storskogen
- 11.2.14.1. Overview
- 11.2.14.2. Products
- 11.2.14.3. SWOT Analysis
- 11.2.14.4. Recent Developments
- 11.2.14.5. Financials (Based on Availability)
- 11.2.15 Cooper B-Line (Eaton)
- 11.2.15.1. Overview
- 11.2.15.2. Products
- 11.2.15.3. SWOT Analysis
- 11.2.15.4. Recent Developments
- 11.2.15.5. Financials (Based on Availability)
- 11.2.16 Pemsa Cable Management
- 11.2.16.1. Overview
- 11.2.16.2. Products
- 11.2.16.3. SWOT Analysis
- 11.2.16.4. Recent Developments
- 11.2.16.5. Financials (Based on Availability)
- 11.2.17 Basor Electric S.A.
- 11.2.17.1. Overview
- 11.2.17.2. Products
- 11.2.17.3. SWOT Analysis
- 11.2.17.4. Recent Developments
- 11.2.17.5. Financials (Based on Availability)
- 11.2.18 Korvest
- 11.2.18.1. Overview
- 11.2.18.2. Products
- 11.2.18.3. SWOT Analysis
- 11.2.18.4. Recent Developments
- 11.2.18.5. Financials (Based on Availability)
- 11.2.19 Marco Cable Management (Atkore)
- 11.2.19.1. Overview
- 11.2.19.2. Products
- 11.2.19.3. SWOT Analysis
- 11.2.19.4. Recent Developments
- 11.2.19.5. Financials (Based on Availability)
- 11.2.20 Yaming
- 11.2.20.1. Overview
- 11.2.20.2. Products
- 11.2.20.3. SWOT Analysis
- 11.2.20.4. Recent Developments
- 11.2.20.5. Financials (Based on Availability)
- 11.2.21 Wanqi Group
- 11.2.21.1. Overview
- 11.2.21.2. Products
- 11.2.21.3. SWOT Analysis
- 11.2.21.4. Recent Developments
- 11.2.21.5. Financials (Based on Availability)
- 11.2.22 IEK Group
- 11.2.22.1. Overview
- 11.2.22.2. Products
- 11.2.22.3. SWOT Analysis
- 11.2.22.4. Recent Developments
- 11.2.22.5. Financials (Based on Availability)
- 11.2.23 ASD-Electric
- 11.2.23.1. Overview
- 11.2.23.2. Products
- 11.2.23.3. SWOT Analysis
- 11.2.23.4. Recent Developments
- 11.2.23.5. Financials (Based on Availability)
- 11.2.24 Hebei Longxin
- 11.2.24.1. Overview
- 11.2.24.2. Products
- 11.2.24.3. SWOT Analysis
- 11.2.24.4. Recent Developments
- 11.2.24.5. Financials (Based on Availability)
- 11.2.25 Poleoduto
- 11.2.25.1. Overview
- 11.2.25.2. Products
- 11.2.25.3. SWOT Analysis
- 11.2.25.4. Recent Developments
- 11.2.25.5. Financials (Based on Availability)
- 11.2.26 Indiana Group
- 11.2.26.1. Overview
- 11.2.26.2. Products
- 11.2.26.3. SWOT Analysis
- 11.2.26.4. Recent Developments
- 11.2.26.5. Financials (Based on Availability)
- 11.2.27 ESZ Company
- 11.2.27.1. Overview
- 11.2.27.2. Products
- 11.2.27.3. SWOT Analysis
- 11.2.27.4. Recent Developments
- 11.2.27.5. Financials (Based on Availability)
- 11.2.28 TAIF
- 11.2.28.1. Overview
- 11.2.28.2. Products
- 11.2.28.3. SWOT Analysis
- 11.2.28.4. Recent Developments
- 11.2.28.5. Financials (Based on Availability)
- 11.2.1 Niedax Group
List of Figures
- Figure 1: Global Galvanized Cable Trays Revenue Breakdown (million, %) by Region 2025 & 2033
- Figure 2: undefined Galvanized Cable Trays Revenue (million), by Application 2025 & 2033
- Figure 3: undefined Galvanized Cable Trays Revenue Share (%), by Application 2025 & 2033
- Figure 4: undefined Galvanized Cable Trays Revenue (million), by Type 2025 & 2033
- Figure 5: undefined Galvanized Cable Trays Revenue Share (%), by Type 2025 & 2033
- Figure 6: undefined Galvanized Cable Trays Revenue (million), by Country 2025 & 2033
- Figure 7: undefined Galvanized Cable Trays Revenue Share (%), by Country 2025 & 2033
- Figure 8: undefined Galvanized Cable Trays Revenue (million), by Application 2025 & 2033
- Figure 9: undefined Galvanized Cable Trays Revenue Share (%), by Application 2025 & 2033
- Figure 10: undefined Galvanized Cable Trays Revenue (million), by Type 2025 & 2033
- Figure 11: undefined Galvanized Cable Trays Revenue Share (%), by Type 2025 & 2033
- Figure 12: undefined Galvanized Cable Trays Revenue (million), by Country 2025 & 2033
- Figure 13: undefined Galvanized Cable Trays Revenue Share (%), by Country 2025 & 2033
- Figure 14: undefined Galvanized Cable Trays Revenue (million), by Application 2025 & 2033
- Figure 15: undefined Galvanized Cable Trays Revenue Share (%), by Application 2025 & 2033
- Figure 16: undefined Galvanized Cable Trays Revenue (million), by Type 2025 & 2033
- Figure 17: undefined Galvanized Cable Trays Revenue Share (%), by Type 2025 & 2033
- Figure 18: undefined Galvanized Cable Trays Revenue (million), by Country 2025 & 2033
- Figure 19: undefined Galvanized Cable Trays Revenue Share (%), by Country 2025 & 2033
- Figure 20: undefined Galvanized Cable Trays Revenue (million), by Application 2025 & 2033
- Figure 21: undefined Galvanized Cable Trays Revenue Share (%), by Application 2025 & 2033
- Figure 22: undefined Galvanized Cable Trays Revenue (million), by Type 2025 & 2033
- Figure 23: undefined Galvanized Cable Trays Revenue Share (%), by Type 2025 & 2033
- Figure 24: undefined Galvanized Cable Trays Revenue (million), by Country 2025 & 2033
- Figure 25: undefined Galvanized Cable Trays Revenue Share (%), by Country 2025 & 2033
- Figure 26: undefined Galvanized Cable Trays Revenue (million), by Application 2025 & 2033
- Figure 27: undefined Galvanized Cable Trays Revenue Share (%), by Application 2025 & 2033
- Figure 28: undefined Galvanized Cable Trays Revenue (million), by Type 2025 & 2033
- Figure 29: undefined Galvanized Cable Trays Revenue Share (%), by Type 2025 & 2033
- Figure 30: undefined Galvanized Cable Trays Revenue (million), by Country 2025 & 2033
- Figure 31: undefined Galvanized Cable Trays Revenue Share (%), by Country 2025 & 2033
List of Tables
- Table 1: Global Galvanized Cable Trays Revenue million Forecast, by Application 2020 & 2033
- Table 2: Global Galvanized Cable Trays Revenue million Forecast, by Type 2020 & 2033
- Table 3: Global Galvanized Cable Trays Revenue million Forecast, by Region 2020 & 2033
- Table 4: Global Galvanized Cable Trays Revenue million Forecast, by Application 2020 & 2033
- Table 5: Global Galvanized Cable Trays Revenue million Forecast, by Type 2020 & 2033
- Table 6: Global Galvanized Cable Trays Revenue million Forecast, by Country 2020 & 2033
- Table 7: Global Galvanized Cable Trays Revenue million Forecast, by Application 2020 & 2033
- Table 8: Global Galvanized Cable Trays Revenue million Forecast, by Type 2020 & 2033
- Table 9: Global Galvanized Cable Trays Revenue million Forecast, by Country 2020 & 2033
- Table 10: Global Galvanized Cable Trays Revenue million Forecast, by Application 2020 & 2033
- Table 11: Global Galvanized Cable Trays Revenue million Forecast, by Type 2020 & 2033
- Table 12: Global Galvanized Cable Trays Revenue million Forecast, by Country 2020 & 2033
- Table 13: Global Galvanized Cable Trays Revenue million Forecast, by Application 2020 & 2033
- Table 14: Global Galvanized Cable Trays Revenue million Forecast, by Type 2020 & 2033
- Table 15: Global Galvanized Cable Trays Revenue million Forecast, by Country 2020 & 2033
- Table 16: Global Galvanized Cable Trays Revenue million Forecast, by Application 2020 & 2033
- Table 17: Global Galvanized Cable Trays Revenue million Forecast, by Type 2020 & 2033
- Table 18: Global Galvanized Cable Trays Revenue million Forecast, by Country 2020 & 2033
Frequently Asked Questions
1. What is the projected Compound Annual Growth Rate (CAGR) of the Galvanized Cable Trays?
The projected CAGR is approximately 7%.
2. Which companies are prominent players in the Galvanized Cable Trays?
Key companies in the market include Niedax Group, OBO Bettermann, Legrand, Cope (Atkore), PUK Group, Oglaend (Hilti), Unitech (IKK), HUAPENG, BAKS, ABB Installation Products, Unistrut (Atkore), DKC Group, Daqo Group, Storskogen, Cooper B-Line (Eaton), Pemsa Cable Management, Basor Electric, S.A., Korvest, Marco Cable Management (Atkore), Yaming, Wanqi Group, IEK Group, ASD-Electric, Hebei Longxin, Poleoduto, Indiana Group, ESZ Company, TAIF.
3. What are the main segments of the Galvanized Cable Trays?
The market segments include Application, Type.
4. Can you provide details about the market size?
The market size is estimated to be USD 4172 million as of 2022.
5. What are some drivers contributing to market growth?
N/A
6. What are the notable trends driving market growth?
N/A
7. Are there any restraints impacting market growth?
N/A
8. Can you provide examples of recent developments in the market?
N/A
9. What pricing options are available for accessing the report?
Pricing options include single-user, multi-user, and enterprise licenses priced at USD 2900.00, USD 4350.00, and USD 5800.00 respectively.
10. Is the market size provided in terms of value or volume?
The market size is provided in terms of value, measured in million.
11. Are there any specific market keywords associated with the report?
Yes, the market keyword associated with the report is "Galvanized Cable Trays," which aids in identifying and referencing the specific market segment covered.
12. How do I determine which pricing option suits my needs best?
The pricing options vary based on user requirements and access needs. Individual users may opt for single-user licenses, while businesses requiring broader access may choose multi-user or enterprise licenses for cost-effective access to the report.
13. Are there any additional resources or data provided in the Galvanized Cable Trays report?
While the report offers comprehensive insights, it's advisable to review the specific contents or supplementary materials provided to ascertain if additional resources or data are available.
14. How can I stay updated on further developments or reports in the Galvanized Cable Trays?
To stay informed about further developments, trends, and reports in the Galvanized Cable Trays, consider subscribing to industry newsletters, following relevant companies and organizations, or regularly checking reputable industry news sources and publications.
Methodology
Step 1 - Identification of Relevant Samples Size from Population Database


Step 2 - Approaches for Defining Global Market Size (Value, Volume* & Price*)

Note*: In applicable scenarios
Step 3 - Data Sources
Primary Research
- Web Analytics
- Survey Reports
- Research Institute
- Latest Research Reports
- Opinion Leaders
Secondary Research
- Annual Reports
- White Paper
- Latest Press Release
- Industry Association
- Paid Database
- Investor Presentations

Step 4 - Data Triangulation
Involves using different sources of information in order to increase the validity of a study
These sources are likely to be stakeholders in a program - participants, other researchers, program staff, other community members, and so on.
Then we put all data in single framework & apply various statistical tools to find out the dynamic on the market.
During the analysis stage, feedback from the stakeholder groups would be compared to determine areas of agreement as well as areas of divergence