

Key Insights
The Global EV DC Energy Meter market is projected to achieve a size of $4.6 billion by 2024, exhibiting a Compound Annual Growth Rate (CAGR) of 10.8% between 2024 and 2033. This substantial growth is propelled by the rapid proliferation of electric vehicles (EVs) across all categories—Battery Electric Vehicles (BEVs), Hybrid Electric Vehicles (HEVs), Plug-in Hybrid Electric Vehicles (PHEVs), and Fuel Cell Electric Vehicles (FCEVs). The escalating requirement for accurate energy measurement and management solutions for EV charging infrastructure and in-vehicle systems is a key growth catalyst. Supportive government initiatives and incentives globally are further accelerating EV adoption and, consequently, the demand for advanced DC energy metering. The increasing focus on grid stability, the integration of renewable energy sources into EV charging ecosystems, and the imperative for precise DC energy flow monitoring are critical market drivers. Furthermore, the transition to smart grids and the demand for granular energy consumption data for billing, diagnostics, and optimization are fueling this market's expansion.
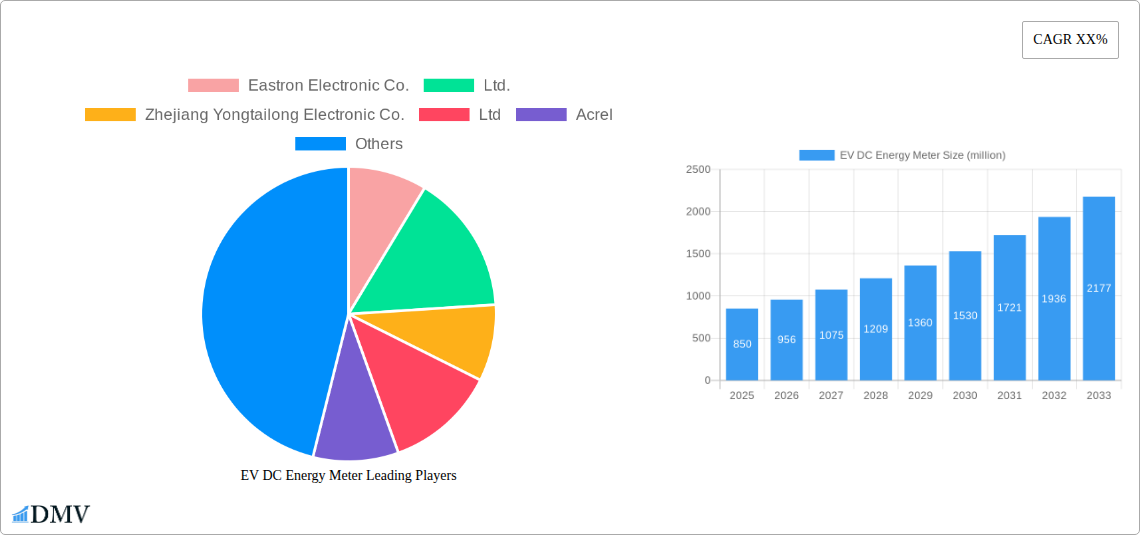
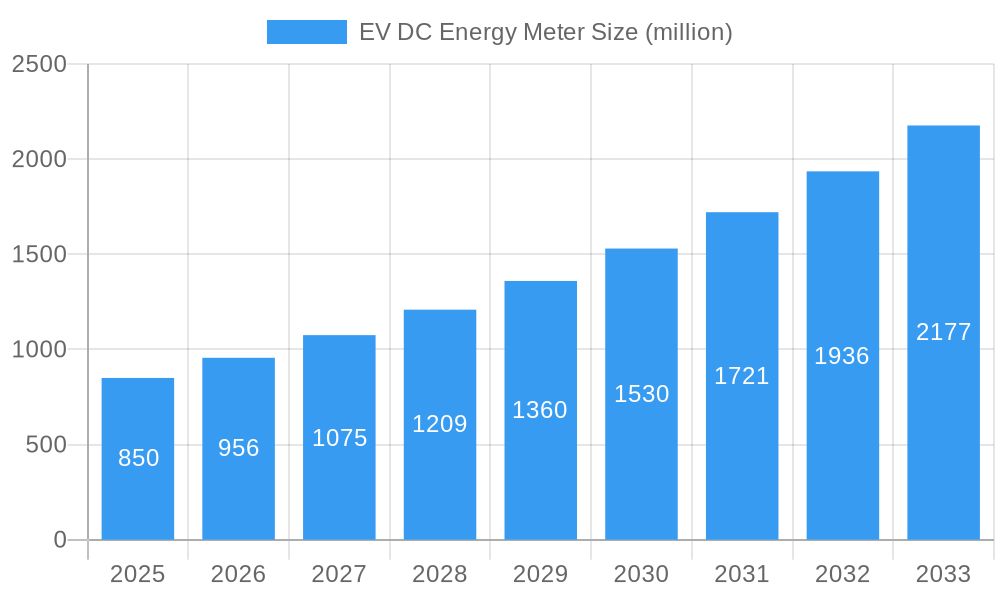
EV DC Energy Meter Market Size (In Billion)
The EV DC Energy Meter market is segmented into Digital, Analog, and Smart Energy Meters. Smart Energy Meters are anticipated to dominate the market share, owing to their advanced communication, data analytics, and remote monitoring capabilities. Leading companies such as Eastron Electronic Co., Ltd., Zhejiang Yongtailong Electronic Co., Ltd., Acrel, and Ivy Metering are prioritizing research and development to introduce innovative solutions tailored to the evolving EV industry. Geographically, the Asia Pacific region, spearheaded by China's leading role in EV manufacturing and adoption, is expected to command the largest market share. Europe and North America, with their strong electrification commitments, will follow. Potential market restraints include the initial high investment cost for certain smart metering technologies and the ongoing need for standardization in charging protocols, which may present short-term growth challenges. However, these are expected to be mitigated by economies of scale and continuous technological advancements.
EV DC Energy Meter Company Market Share
EV DC Energy Meter Market: Comprehensive Analysis and Future Outlook (2019-2033)
This in-depth report provides a definitive analysis of the global EV DC Energy Meter market, offering critical insights for stakeholders navigating the rapidly evolving electric vehicle charging infrastructure. Covering a study period from 2019 to 2033, with a base year of 2025 and a forecast period extending to 2033, this report delves into market composition, industry evolution, regional dominance, product innovations, growth drivers, obstacles, and future opportunities. We meticulously analyze market share distribution, M&A activities, technological advancements, and the competitive landscape, featuring key players and their significant developments. With an estimated market size of several million dollars and projected growth rates, this report is an indispensable resource for understanding and capitalizing on the burgeoning EV DC energy metering sector.
EV DC Energy Meter Market Composition & Trends
The EV DC Energy Meter market exhibits a dynamic composition characterized by increasing technological sophistication and a growing emphasis on smart metering solutions. Market concentration is influenced by a few key players, yet there's significant room for innovation from emerging companies. Innovation catalysts include the urgent need for accurate energy consumption tracking in electric vehicles (BEV, HEV, PHEV, FCEV), the development of advanced communication protocols, and enhanced data analytics capabilities. Regulatory landscapes worldwide are becoming more stringent, mandating precise billing and energy management, thus driving demand for high-accuracy DC energy meters. Substitute products, such as AC energy meters for certain charging scenarios or less sophisticated measurement devices, are gradually being phased out as charging infrastructure demands higher precision for DC power delivery. End-user profiles span a wide range, from individual EV owners and fleet operators to charging station manufacturers and utility companies, all seeking reliable and transparent energy measurement solutions. Mergers and acquisitions (M&A) activities, with reported deal values in the multi-million dollar range, are becoming more prevalent as larger companies seek to integrate advanced metering technologies and expand their market reach. The current market share distribution indicates a strong presence of digital and smart energy meters, with analog meters seeing a decline. The overall market sentiment is positive, driven by the exponential growth in EV adoption and the accompanying need for robust charging infrastructure. The market is projected to reach several million dollars in value by the forecast year of 2025, with a projected CAGR of xx% during the forecast period.
EV DC Energy Meter Industry Evolution
The EV DC Energy Meter industry has undergone a profound evolution, mirroring the transformative shift towards electric mobility. From its nascent stages, the industry has witnessed a dramatic surge in market growth trajectories, driven by the increasing global adoption of electric vehicles. Technological advancements have been at the forefront of this evolution, with a consistent push towards greater accuracy, enhanced connectivity, and robust data management capabilities. Early iterations of DC energy meters were simpler in design, focusing on basic energy counting. However, the demands of modern EV charging infrastructure, encompassing fast charging and complex billing models, have necessitated the development of sophisticated smart energy meters. These devices now integrate advanced digital processing, enabling real-time monitoring, remote diagnostics, and seamless communication with charging management systems and the grid. Consumer demands have also played a pivotal role, with a growing expectation for transparent billing, precise energy usage insights, and a seamless charging experience. This has pushed manufacturers to develop meters that not only measure energy but also provide valuable data analytics for both consumers and charging station operators. The digital energy meter segment has seen significant adoption due to its superior accuracy and functionality compared to older analog energy meter technologies. The market size for EV DC Energy Meters was estimated to be in the millions during the historical period of 2019-2024, with significant year-on-year growth observed. Projections for the base year 2025 indicate a market value in the tens of millions, with the forecast period (2025-2033) anticipating a compound annual growth rate (CAGR) of approximately xx%, reaching hundreds of millions by the end of the forecast horizon. This sustained growth is underpinned by the ongoing expansion of EV fleets and the continuous development of charging infrastructure worldwide. The industry's trajectory is marked by a clear shift towards intelligent, connected, and highly accurate DC energy metering solutions that are integral to the efficient and reliable operation of the electric vehicle ecosystem.
Leading Regions, Countries, or Segments in EV DC Energy Meter
The EV DC Energy Meter market's dominance is currently concentrated in regions and segments that are at the vanguard of electric vehicle adoption and charging infrastructure development. North America and Europe are spearheading this charge, driven by strong government incentives, ambitious EV sales targets, and substantial investments in charging networks. Within these regions, countries like the United States, Germany, and China are particularly prominent due to their large EV markets and advanced technological ecosystems.
- Application Dominance: The BEV (Battery Electric Vehicle) segment is the primary driver for EV DC Energy Meter demand. As BEVs constitute the largest and fastest-growing segment of the EV market, the need for accurate DC energy measurement at charging points for these vehicles is paramount. PHEV (Plug-in Hybrid Electric Vehicle) adoption also contributes significantly, although to a lesser extent than BEVs.
- Type Dominance: The Smart Energy Meter segment is experiencing unparalleled growth and is poised to dominate the market. These meters offer advanced features such as real-time data transmission, remote management, bidirectional communication, and integration with smart grid technologies, making them indispensable for modern charging solutions. Digital Energy Meters are also a strong contender, offering superior accuracy and features over traditional analog meters. The Analog Energy Meter segment is witnessing a decline in relevance as technological advancements render them obsolete for the complex requirements of EV charging.
Key Drivers for Dominance in Leading Regions:
- Regulatory Support and Incentives: Governments in North America and Europe are actively promoting EV adoption through subsidies, tax credits, and mandates for charging infrastructure, creating a fertile ground for DC energy meter deployment.
- Investment Trends: Significant private and public investments are being channeled into building out robust and widespread EV charging networks, directly fueling the demand for reliable energy metering solutions.
- Technological Adoption: The early and rapid adoption of advanced EV technologies, including smart charging capabilities and V2G (Vehicle-to-Grid) integration, necessitates the use of sophisticated smart DC energy meters.
- Consumer Demand: Increasing consumer awareness and demand for electric vehicles, coupled with a desire for convenient and cost-effective charging, further propels the market in these leading regions.
The Asian market, particularly China, is also a critical player, showcasing rapid growth in EV sales and charging infrastructure expansion, contributing significantly to the global market's trajectory. The interplay of these factors ensures that regions and segments at the forefront of EV innovation will continue to lead the EV DC Energy Meter market in the foreseeable future.
EV DC Energy Meter Product Innovations
Recent product innovations in the EV DC Energy Meter market are primarily focused on enhancing accuracy, connectivity, and intelligence. Manufacturers are developing meters with higher precision ratings (e.g., ±0.5% or better) essential for precise billing and grid load management. Integration of advanced communication modules supporting protocols like Modbus, RS485, and increasingly, wireless technologies (Wi-Fi, LoRaWAN, cellular) enables seamless data exchange with charging stations and management platforms. Unique selling propositions include meters with built-in surge protection, wider operating temperature ranges for outdoor deployment, and tamper-proof designs. Technological advancements are also leading to meters that can monitor power quality parameters beyond simple energy consumption, such as voltage, current, frequency, and harmonic distortion, providing a more comprehensive view of charging performance and grid impact. Some innovative solutions are also incorporating edge computing capabilities for local data processing, reducing reliance on constant cloud connectivity.
Propelling Factors for EV DC Energy Meter Growth
The global EV DC Energy Meter market is propelled by a confluence of technological, economic, and regulatory factors. The exponential growth in electric vehicle sales worldwide is the primary catalyst, directly increasing the demand for charging infrastructure and, consequently, energy meters. Advancements in battery technology and charging speeds necessitate more precise and efficient DC energy measurement. Economically, the declining cost of EVs and the increasing availability of charging solutions make electric mobility more accessible. Government policies and initiatives, including subsidies for EV purchases, mandates for charging station installation, and grid modernization efforts, play a crucial role by creating a supportive ecosystem. Furthermore, the growing emphasis on renewable energy integration and smart grid technologies further boosts the demand for intelligent energy meters that can facilitate bidirectional power flow and demand-side management.
Obstacles in the EV DC Energy Meter Market
Despite robust growth, the EV DC Energy Meter market faces several obstacles. Regulatory fragmentation across different regions can create challenges in standardization and interoperability, slowing down widespread adoption. Supply chain disruptions, particularly for specialized electronic components, can lead to increased lead times and costs, impacting production volumes. Intense competition from both established players and new entrants can put pressure on profit margins. Furthermore, the initial cost of advanced smart DC energy meters can be a barrier for some smaller charging infrastructure operators, especially in emerging markets. The need for skilled labor for installation and maintenance also presents a challenge.
Future Opportunities in EV DC Energy Meter
Emerging opportunities in the EV DC Energy Meter market are diverse and promising. The expansion of public and private charging infrastructure, including ultra-fast charging stations and fleet charging depots, presents significant growth potential. The integration of V2G (Vehicle-to-Grid) technology opens up new avenues for energy management and revenue generation, requiring sophisticated metering capabilities. The development of smart city initiatives and the increasing adoption of IoT (Internet of Things) in the energy sector create opportunities for connected and data-rich energy metering solutions. Furthermore, the growing demand for home charging solutions and the need for accurate energy monitoring for residential users present a substantial untapped market. The development of more cost-effective and feature-rich meters tailored for different market segments will also drive future growth.
Major Players in the EV DC Energy Meter Ecosystem
- Eastron Electronic Co.,Ltd.
- Zhejiang Yongtailong Electronic Co.,Ltd
- Acrel
- Ivy Metering
Key Developments in EV DC Energy Meter Industry
- 2023/Q4: Launch of next-generation smart DC energy meters with enhanced cybersecurity features and support for emerging charging standards.
- 2023/Q3: Several M&A activities reported in the sector, with companies acquiring specialized technology providers to bolster their smart metering portfolios.
- 2023/Q2: Increased focus on developing bidirectional energy metering solutions to support V2G (Vehicle-to-Grid) applications.
- 2023/Q1: Introduction of advanced diagnostic tools for remote monitoring and predictive maintenance of DC energy meters in charging stations.
- 2022/Q4: Significant investment in R&D for ultra-high precision DC energy meters (±0.2% accuracy) to meet stringent grid requirements.
- 2022/Q3: Expansion of product lines to cater to diverse charging power levels, from Level 1 to ultra-fast DC chargers.
- 2022/Q2: Strategic partnerships formed between meter manufacturers and charging infrastructure providers to offer integrated solutions.
Strategic EV DC Energy Meter Market Forecast
The strategic forecast for the EV DC Energy Meter market is exceptionally strong, fueled by the unabated global transition to electric mobility and the subsequent expansion of charging infrastructure. Growth catalysts include increasingly stringent government regulations mandating accurate energy measurement for EVs, coupled with substantial investments in smart grid development. The continuous technological evolution, leading to more sophisticated and feature-rich smart energy meters, will further drive adoption across various applications, from BEVs to large-scale commercial charging stations. Emerging opportunities in V2G technology and the broader IoT ecosystem present significant untapped market potential. The market is projected to witness consistent expansion, driven by innovation, supportive policies, and the fundamental shift towards sustainable transportation solutions.
EV DC Energy Meter Segmentation
-
1. Application
- 1.1. BEV
- 1.2. HEV
- 1.3. PHEV
- 1.4. FCEV
-
2. Types
- 2.1. Digital Energy Meter
- 2.2. Analog Energy Meter
- 2.3. Smart Energy Meter
EV DC Energy Meter Segmentation By Geography
-
1. North America
- 1.1. United States
- 1.2. Canada
- 1.3. Mexico
-
2. South America
- 2.1. Brazil
- 2.2. Argentina
- 2.3. Rest of South America
-
3. Europe
- 3.1. United Kingdom
- 3.2. Germany
- 3.3. France
- 3.4. Italy
- 3.5. Spain
- 3.6. Russia
- 3.7. Benelux
- 3.8. Nordics
- 3.9. Rest of Europe
-
4. Middle East & Africa
- 4.1. Turkey
- 4.2. Israel
- 4.3. GCC
- 4.4. North Africa
- 4.5. South Africa
- 4.6. Rest of Middle East & Africa
-
5. Asia Pacific
- 5.1. China
- 5.2. India
- 5.3. Japan
- 5.4. South Korea
- 5.5. ASEAN
- 5.6. Oceania
- 5.7. Rest of Asia Pacific
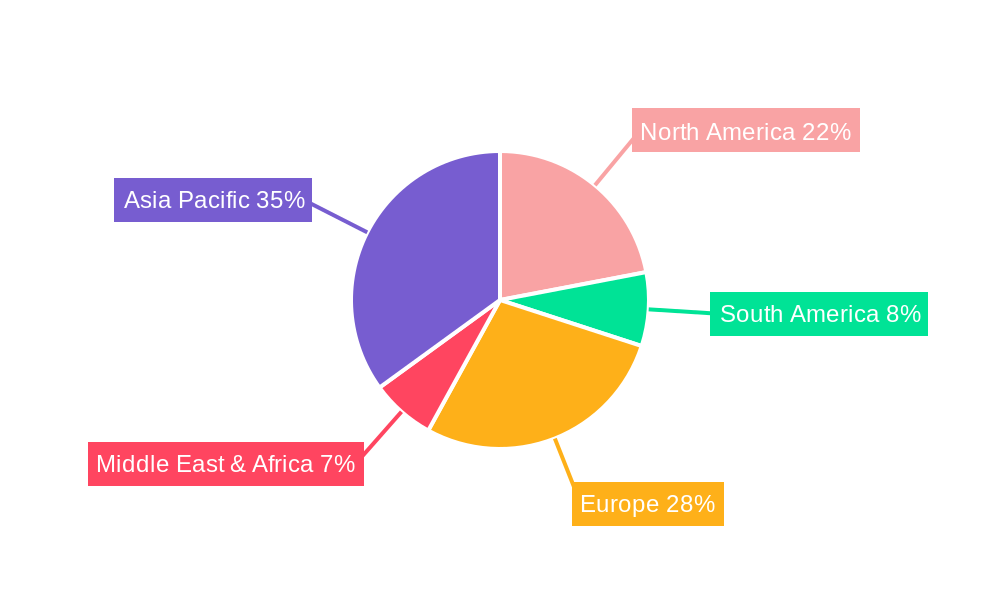
EV DC Energy Meter Regional Market Share
Geographic Coverage of EV DC Energy Meter
EV DC Energy Meter REPORT HIGHLIGHTS
| Aspects | Details |
|---|---|
| Study Period | 2020-2034 |
| Base Year | 2025 |
| Estimated Year | 2026 |
| Forecast Period | 2026-2034 |
| Historical Period | 2020-2025 |
| Growth Rate | CAGR of 10.8% from 2020-2034 |
| Segmentation |
|
Table of Contents
- 1. Introduction
- 1.1. Research Scope
- 1.2. Market Segmentation
- 1.3. Research Methodology
- 1.4. Definitions and Assumptions
- 2. Executive Summary
- 2.1. Introduction
- 3. Market Dynamics
- 3.1. Introduction
- 3.2. Market Drivers
- 3.3. Market Restrains
- 3.4. Market Trends
- 4. Market Factor Analysis
- 4.1. Porters Five Forces
- 4.2. Supply/Value Chain
- 4.3. PESTEL analysis
- 4.4. Market Entropy
- 4.5. Patent/Trademark Analysis
- 5. Global EV DC Energy Meter Analysis, Insights and Forecast, 2020-2032
- 5.1. Market Analysis, Insights and Forecast - by Application
- 5.1.1. BEV
- 5.1.2. HEV
- 5.1.3. PHEV
- 5.1.4. FCEV
- 5.2. Market Analysis, Insights and Forecast - by Types
- 5.2.1. Digital Energy Meter
- 5.2.2. Analog Energy Meter
- 5.2.3. Smart Energy Meter
- 5.3. Market Analysis, Insights and Forecast - by Region
- 5.3.1. North America
- 5.3.2. South America
- 5.3.3. Europe
- 5.3.4. Middle East & Africa
- 5.3.5. Asia Pacific
- 5.1. Market Analysis, Insights and Forecast - by Application
- 6. North America EV DC Energy Meter Analysis, Insights and Forecast, 2020-2032
- 6.1. Market Analysis, Insights and Forecast - by Application
- 6.1.1. BEV
- 6.1.2. HEV
- 6.1.3. PHEV
- 6.1.4. FCEV
- 6.2. Market Analysis, Insights and Forecast - by Types
- 6.2.1. Digital Energy Meter
- 6.2.2. Analog Energy Meter
- 6.2.3. Smart Energy Meter
- 6.1. Market Analysis, Insights and Forecast - by Application
- 7. South America EV DC Energy Meter Analysis, Insights and Forecast, 2020-2032
- 7.1. Market Analysis, Insights and Forecast - by Application
- 7.1.1. BEV
- 7.1.2. HEV
- 7.1.3. PHEV
- 7.1.4. FCEV
- 7.2. Market Analysis, Insights and Forecast - by Types
- 7.2.1. Digital Energy Meter
- 7.2.2. Analog Energy Meter
- 7.2.3. Smart Energy Meter
- 7.1. Market Analysis, Insights and Forecast - by Application
- 8. Europe EV DC Energy Meter Analysis, Insights and Forecast, 2020-2032
- 8.1. Market Analysis, Insights and Forecast - by Application
- 8.1.1. BEV
- 8.1.2. HEV
- 8.1.3. PHEV
- 8.1.4. FCEV
- 8.2. Market Analysis, Insights and Forecast - by Types
- 8.2.1. Digital Energy Meter
- 8.2.2. Analog Energy Meter
- 8.2.3. Smart Energy Meter
- 8.1. Market Analysis, Insights and Forecast - by Application
- 9. Middle East & Africa EV DC Energy Meter Analysis, Insights and Forecast, 2020-2032
- 9.1. Market Analysis, Insights and Forecast - by Application
- 9.1.1. BEV
- 9.1.2. HEV
- 9.1.3. PHEV
- 9.1.4. FCEV
- 9.2. Market Analysis, Insights and Forecast - by Types
- 9.2.1. Digital Energy Meter
- 9.2.2. Analog Energy Meter
- 9.2.3. Smart Energy Meter
- 9.1. Market Analysis, Insights and Forecast - by Application
- 10. Asia Pacific EV DC Energy Meter Analysis, Insights and Forecast, 2020-2032
- 10.1. Market Analysis, Insights and Forecast - by Application
- 10.1.1. BEV
- 10.1.2. HEV
- 10.1.3. PHEV
- 10.1.4. FCEV
- 10.2. Market Analysis, Insights and Forecast - by Types
- 10.2.1. Digital Energy Meter
- 10.2.2. Analog Energy Meter
- 10.2.3. Smart Energy Meter
- 10.1. Market Analysis, Insights and Forecast - by Application
- 11. Competitive Analysis
- 11.1. Global Market Share Analysis 2025
- 11.2. Company Profiles
- 11.2.1 Eastron Electronic Co.
- 11.2.1.1. Overview
- 11.2.1.2. Products
- 11.2.1.3. SWOT Analysis
- 11.2.1.4. Recent Developments
- 11.2.1.5. Financials (Based on Availability)
- 11.2.2 Ltd.
- 11.2.2.1. Overview
- 11.2.2.2. Products
- 11.2.2.3. SWOT Analysis
- 11.2.2.4. Recent Developments
- 11.2.2.5. Financials (Based on Availability)
- 11.2.3 Zhejiang Yongtailong Electronic Co.
- 11.2.3.1. Overview
- 11.2.3.2. Products
- 11.2.3.3. SWOT Analysis
- 11.2.3.4. Recent Developments
- 11.2.3.5. Financials (Based on Availability)
- 11.2.4 Ltd
- 11.2.4.1. Overview
- 11.2.4.2. Products
- 11.2.4.3. SWOT Analysis
- 11.2.4.4. Recent Developments
- 11.2.4.5. Financials (Based on Availability)
- 11.2.5 Acrel
- 11.2.5.1. Overview
- 11.2.5.2. Products
- 11.2.5.3. SWOT Analysis
- 11.2.5.4. Recent Developments
- 11.2.5.5. Financials (Based on Availability)
- 11.2.6 Ivy Metering
- 11.2.6.1. Overview
- 11.2.6.2. Products
- 11.2.6.3. SWOT Analysis
- 11.2.6.4. Recent Developments
- 11.2.6.5. Financials (Based on Availability)
- 11.2.1 Eastron Electronic Co.
List of Figures
- Figure 1: Global EV DC Energy Meter Revenue Breakdown (billion, %) by Region 2025 & 2033
- Figure 2: Global EV DC Energy Meter Volume Breakdown (K, %) by Region 2025 & 2033
- Figure 3: North America EV DC Energy Meter Revenue (billion), by Application 2025 & 2033
- Figure 4: North America EV DC Energy Meter Volume (K), by Application 2025 & 2033
- Figure 5: North America EV DC Energy Meter Revenue Share (%), by Application 2025 & 2033
- Figure 6: North America EV DC Energy Meter Volume Share (%), by Application 2025 & 2033
- Figure 7: North America EV DC Energy Meter Revenue (billion), by Types 2025 & 2033
- Figure 8: North America EV DC Energy Meter Volume (K), by Types 2025 & 2033
- Figure 9: North America EV DC Energy Meter Revenue Share (%), by Types 2025 & 2033
- Figure 10: North America EV DC Energy Meter Volume Share (%), by Types 2025 & 2033
- Figure 11: North America EV DC Energy Meter Revenue (billion), by Country 2025 & 2033
- Figure 12: North America EV DC Energy Meter Volume (K), by Country 2025 & 2033
- Figure 13: North America EV DC Energy Meter Revenue Share (%), by Country 2025 & 2033
- Figure 14: North America EV DC Energy Meter Volume Share (%), by Country 2025 & 2033
- Figure 15: South America EV DC Energy Meter Revenue (billion), by Application 2025 & 2033
- Figure 16: South America EV DC Energy Meter Volume (K), by Application 2025 & 2033
- Figure 17: South America EV DC Energy Meter Revenue Share (%), by Application 2025 & 2033
- Figure 18: South America EV DC Energy Meter Volume Share (%), by Application 2025 & 2033
- Figure 19: South America EV DC Energy Meter Revenue (billion), by Types 2025 & 2033
- Figure 20: South America EV DC Energy Meter Volume (K), by Types 2025 & 2033
- Figure 21: South America EV DC Energy Meter Revenue Share (%), by Types 2025 & 2033
- Figure 22: South America EV DC Energy Meter Volume Share (%), by Types 2025 & 2033
- Figure 23: South America EV DC Energy Meter Revenue (billion), by Country 2025 & 2033
- Figure 24: South America EV DC Energy Meter Volume (K), by Country 2025 & 2033
- Figure 25: South America EV DC Energy Meter Revenue Share (%), by Country 2025 & 2033
- Figure 26: South America EV DC Energy Meter Volume Share (%), by Country 2025 & 2033
- Figure 27: Europe EV DC Energy Meter Revenue (billion), by Application 2025 & 2033
- Figure 28: Europe EV DC Energy Meter Volume (K), by Application 2025 & 2033
- Figure 29: Europe EV DC Energy Meter Revenue Share (%), by Application 2025 & 2033
- Figure 30: Europe EV DC Energy Meter Volume Share (%), by Application 2025 & 2033
- Figure 31: Europe EV DC Energy Meter Revenue (billion), by Types 2025 & 2033
- Figure 32: Europe EV DC Energy Meter Volume (K), by Types 2025 & 2033
- Figure 33: Europe EV DC Energy Meter Revenue Share (%), by Types 2025 & 2033
- Figure 34: Europe EV DC Energy Meter Volume Share (%), by Types 2025 & 2033
- Figure 35: Europe EV DC Energy Meter Revenue (billion), by Country 2025 & 2033
- Figure 36: Europe EV DC Energy Meter Volume (K), by Country 2025 & 2033
- Figure 37: Europe EV DC Energy Meter Revenue Share (%), by Country 2025 & 2033
- Figure 38: Europe EV DC Energy Meter Volume Share (%), by Country 2025 & 2033
- Figure 39: Middle East & Africa EV DC Energy Meter Revenue (billion), by Application 2025 & 2033
- Figure 40: Middle East & Africa EV DC Energy Meter Volume (K), by Application 2025 & 2033
- Figure 41: Middle East & Africa EV DC Energy Meter Revenue Share (%), by Application 2025 & 2033
- Figure 42: Middle East & Africa EV DC Energy Meter Volume Share (%), by Application 2025 & 2033
- Figure 43: Middle East & Africa EV DC Energy Meter Revenue (billion), by Types 2025 & 2033
- Figure 44: Middle East & Africa EV DC Energy Meter Volume (K), by Types 2025 & 2033
- Figure 45: Middle East & Africa EV DC Energy Meter Revenue Share (%), by Types 2025 & 2033
- Figure 46: Middle East & Africa EV DC Energy Meter Volume Share (%), by Types 2025 & 2033
- Figure 47: Middle East & Africa EV DC Energy Meter Revenue (billion), by Country 2025 & 2033
- Figure 48: Middle East & Africa EV DC Energy Meter Volume (K), by Country 2025 & 2033
- Figure 49: Middle East & Africa EV DC Energy Meter Revenue Share (%), by Country 2025 & 2033
- Figure 50: Middle East & Africa EV DC Energy Meter Volume Share (%), by Country 2025 & 2033
- Figure 51: Asia Pacific EV DC Energy Meter Revenue (billion), by Application 2025 & 2033
- Figure 52: Asia Pacific EV DC Energy Meter Volume (K), by Application 2025 & 2033
- Figure 53: Asia Pacific EV DC Energy Meter Revenue Share (%), by Application 2025 & 2033
- Figure 54: Asia Pacific EV DC Energy Meter Volume Share (%), by Application 2025 & 2033
- Figure 55: Asia Pacific EV DC Energy Meter Revenue (billion), by Types 2025 & 2033
- Figure 56: Asia Pacific EV DC Energy Meter Volume (K), by Types 2025 & 2033
- Figure 57: Asia Pacific EV DC Energy Meter Revenue Share (%), by Types 2025 & 2033
- Figure 58: Asia Pacific EV DC Energy Meter Volume Share (%), by Types 2025 & 2033
- Figure 59: Asia Pacific EV DC Energy Meter Revenue (billion), by Country 2025 & 2033
- Figure 60: Asia Pacific EV DC Energy Meter Volume (K), by Country 2025 & 2033
- Figure 61: Asia Pacific EV DC Energy Meter Revenue Share (%), by Country 2025 & 2033
- Figure 62: Asia Pacific EV DC Energy Meter Volume Share (%), by Country 2025 & 2033
List of Tables
- Table 1: Global EV DC Energy Meter Revenue billion Forecast, by Application 2020 & 2033
- Table 2: Global EV DC Energy Meter Volume K Forecast, by Application 2020 & 2033
- Table 3: Global EV DC Energy Meter Revenue billion Forecast, by Types 2020 & 2033
- Table 4: Global EV DC Energy Meter Volume K Forecast, by Types 2020 & 2033
- Table 5: Global EV DC Energy Meter Revenue billion Forecast, by Region 2020 & 2033
- Table 6: Global EV DC Energy Meter Volume K Forecast, by Region 2020 & 2033
- Table 7: Global EV DC Energy Meter Revenue billion Forecast, by Application 2020 & 2033
- Table 8: Global EV DC Energy Meter Volume K Forecast, by Application 2020 & 2033
- Table 9: Global EV DC Energy Meter Revenue billion Forecast, by Types 2020 & 2033
- Table 10: Global EV DC Energy Meter Volume K Forecast, by Types 2020 & 2033
- Table 11: Global EV DC Energy Meter Revenue billion Forecast, by Country 2020 & 2033
- Table 12: Global EV DC Energy Meter Volume K Forecast, by Country 2020 & 2033
- Table 13: United States EV DC Energy Meter Revenue (billion) Forecast, by Application 2020 & 2033
- Table 14: United States EV DC Energy Meter Volume (K) Forecast, by Application 2020 & 2033
- Table 15: Canada EV DC Energy Meter Revenue (billion) Forecast, by Application 2020 & 2033
- Table 16: Canada EV DC Energy Meter Volume (K) Forecast, by Application 2020 & 2033
- Table 17: Mexico EV DC Energy Meter Revenue (billion) Forecast, by Application 2020 & 2033
- Table 18: Mexico EV DC Energy Meter Volume (K) Forecast, by Application 2020 & 2033
- Table 19: Global EV DC Energy Meter Revenue billion Forecast, by Application 2020 & 2033
- Table 20: Global EV DC Energy Meter Volume K Forecast, by Application 2020 & 2033
- Table 21: Global EV DC Energy Meter Revenue billion Forecast, by Types 2020 & 2033
- Table 22: Global EV DC Energy Meter Volume K Forecast, by Types 2020 & 2033
- Table 23: Global EV DC Energy Meter Revenue billion Forecast, by Country 2020 & 2033
- Table 24: Global EV DC Energy Meter Volume K Forecast, by Country 2020 & 2033
- Table 25: Brazil EV DC Energy Meter Revenue (billion) Forecast, by Application 2020 & 2033
- Table 26: Brazil EV DC Energy Meter Volume (K) Forecast, by Application 2020 & 2033
- Table 27: Argentina EV DC Energy Meter Revenue (billion) Forecast, by Application 2020 & 2033
- Table 28: Argentina EV DC Energy Meter Volume (K) Forecast, by Application 2020 & 2033
- Table 29: Rest of South America EV DC Energy Meter Revenue (billion) Forecast, by Application 2020 & 2033
- Table 30: Rest of South America EV DC Energy Meter Volume (K) Forecast, by Application 2020 & 2033
- Table 31: Global EV DC Energy Meter Revenue billion Forecast, by Application 2020 & 2033
- Table 32: Global EV DC Energy Meter Volume K Forecast, by Application 2020 & 2033
- Table 33: Global EV DC Energy Meter Revenue billion Forecast, by Types 2020 & 2033
- Table 34: Global EV DC Energy Meter Volume K Forecast, by Types 2020 & 2033
- Table 35: Global EV DC Energy Meter Revenue billion Forecast, by Country 2020 & 2033
- Table 36: Global EV DC Energy Meter Volume K Forecast, by Country 2020 & 2033
- Table 37: United Kingdom EV DC Energy Meter Revenue (billion) Forecast, by Application 2020 & 2033
- Table 38: United Kingdom EV DC Energy Meter Volume (K) Forecast, by Application 2020 & 2033
- Table 39: Germany EV DC Energy Meter Revenue (billion) Forecast, by Application 2020 & 2033
- Table 40: Germany EV DC Energy Meter Volume (K) Forecast, by Application 2020 & 2033
- Table 41: France EV DC Energy Meter Revenue (billion) Forecast, by Application 2020 & 2033
- Table 42: France EV DC Energy Meter Volume (K) Forecast, by Application 2020 & 2033
- Table 43: Italy EV DC Energy Meter Revenue (billion) Forecast, by Application 2020 & 2033
- Table 44: Italy EV DC Energy Meter Volume (K) Forecast, by Application 2020 & 2033
- Table 45: Spain EV DC Energy Meter Revenue (billion) Forecast, by Application 2020 & 2033
- Table 46: Spain EV DC Energy Meter Volume (K) Forecast, by Application 2020 & 2033
- Table 47: Russia EV DC Energy Meter Revenue (billion) Forecast, by Application 2020 & 2033
- Table 48: Russia EV DC Energy Meter Volume (K) Forecast, by Application 2020 & 2033
- Table 49: Benelux EV DC Energy Meter Revenue (billion) Forecast, by Application 2020 & 2033
- Table 50: Benelux EV DC Energy Meter Volume (K) Forecast, by Application 2020 & 2033
- Table 51: Nordics EV DC Energy Meter Revenue (billion) Forecast, by Application 2020 & 2033
- Table 52: Nordics EV DC Energy Meter Volume (K) Forecast, by Application 2020 & 2033
- Table 53: Rest of Europe EV DC Energy Meter Revenue (billion) Forecast, by Application 2020 & 2033
- Table 54: Rest of Europe EV DC Energy Meter Volume (K) Forecast, by Application 2020 & 2033
- Table 55: Global EV DC Energy Meter Revenue billion Forecast, by Application 2020 & 2033
- Table 56: Global EV DC Energy Meter Volume K Forecast, by Application 2020 & 2033
- Table 57: Global EV DC Energy Meter Revenue billion Forecast, by Types 2020 & 2033
- Table 58: Global EV DC Energy Meter Volume K Forecast, by Types 2020 & 2033
- Table 59: Global EV DC Energy Meter Revenue billion Forecast, by Country 2020 & 2033
- Table 60: Global EV DC Energy Meter Volume K Forecast, by Country 2020 & 2033
- Table 61: Turkey EV DC Energy Meter Revenue (billion) Forecast, by Application 2020 & 2033
- Table 62: Turkey EV DC Energy Meter Volume (K) Forecast, by Application 2020 & 2033
- Table 63: Israel EV DC Energy Meter Revenue (billion) Forecast, by Application 2020 & 2033
- Table 64: Israel EV DC Energy Meter Volume (K) Forecast, by Application 2020 & 2033
- Table 65: GCC EV DC Energy Meter Revenue (billion) Forecast, by Application 2020 & 2033
- Table 66: GCC EV DC Energy Meter Volume (K) Forecast, by Application 2020 & 2033
- Table 67: North Africa EV DC Energy Meter Revenue (billion) Forecast, by Application 2020 & 2033
- Table 68: North Africa EV DC Energy Meter Volume (K) Forecast, by Application 2020 & 2033
- Table 69: South Africa EV DC Energy Meter Revenue (billion) Forecast, by Application 2020 & 2033
- Table 70: South Africa EV DC Energy Meter Volume (K) Forecast, by Application 2020 & 2033
- Table 71: Rest of Middle East & Africa EV DC Energy Meter Revenue (billion) Forecast, by Application 2020 & 2033
- Table 72: Rest of Middle East & Africa EV DC Energy Meter Volume (K) Forecast, by Application 2020 & 2033
- Table 73: Global EV DC Energy Meter Revenue billion Forecast, by Application 2020 & 2033
- Table 74: Global EV DC Energy Meter Volume K Forecast, by Application 2020 & 2033
- Table 75: Global EV DC Energy Meter Revenue billion Forecast, by Types 2020 & 2033
- Table 76: Global EV DC Energy Meter Volume K Forecast, by Types 2020 & 2033
- Table 77: Global EV DC Energy Meter Revenue billion Forecast, by Country 2020 & 2033
- Table 78: Global EV DC Energy Meter Volume K Forecast, by Country 2020 & 2033
- Table 79: China EV DC Energy Meter Revenue (billion) Forecast, by Application 2020 & 2033
- Table 80: China EV DC Energy Meter Volume (K) Forecast, by Application 2020 & 2033
- Table 81: India EV DC Energy Meter Revenue (billion) Forecast, by Application 2020 & 2033
- Table 82: India EV DC Energy Meter Volume (K) Forecast, by Application 2020 & 2033
- Table 83: Japan EV DC Energy Meter Revenue (billion) Forecast, by Application 2020 & 2033
- Table 84: Japan EV DC Energy Meter Volume (K) Forecast, by Application 2020 & 2033
- Table 85: South Korea EV DC Energy Meter Revenue (billion) Forecast, by Application 2020 & 2033
- Table 86: South Korea EV DC Energy Meter Volume (K) Forecast, by Application 2020 & 2033
- Table 87: ASEAN EV DC Energy Meter Revenue (billion) Forecast, by Application 2020 & 2033
- Table 88: ASEAN EV DC Energy Meter Volume (K) Forecast, by Application 2020 & 2033
- Table 89: Oceania EV DC Energy Meter Revenue (billion) Forecast, by Application 2020 & 2033
- Table 90: Oceania EV DC Energy Meter Volume (K) Forecast, by Application 2020 & 2033
- Table 91: Rest of Asia Pacific EV DC Energy Meter Revenue (billion) Forecast, by Application 2020 & 2033
- Table 92: Rest of Asia Pacific EV DC Energy Meter Volume (K) Forecast, by Application 2020 & 2033
Frequently Asked Questions
1. What is the projected Compound Annual Growth Rate (CAGR) of the EV DC Energy Meter?
The projected CAGR is approximately 10.8%.
2. Which companies are prominent players in the EV DC Energy Meter?
Key companies in the market include Eastron Electronic Co., Ltd., Zhejiang Yongtailong Electronic Co., Ltd, Acrel, Ivy Metering.
3. What are the main segments of the EV DC Energy Meter?
The market segments include Application, Types.
4. Can you provide details about the market size?
The market size is estimated to be USD 4.6 billion as of 2022.
5. What are some drivers contributing to market growth?
N/A
6. What are the notable trends driving market growth?
N/A
7. Are there any restraints impacting market growth?
N/A
8. Can you provide examples of recent developments in the market?
N/A
9. What pricing options are available for accessing the report?
Pricing options include single-user, multi-user, and enterprise licenses priced at USD 4350.00, USD 6525.00, and USD 8700.00 respectively.
10. Is the market size provided in terms of value or volume?
The market size is provided in terms of value, measured in billion and volume, measured in K.
11. Are there any specific market keywords associated with the report?
Yes, the market keyword associated with the report is "EV DC Energy Meter," which aids in identifying and referencing the specific market segment covered.
12. How do I determine which pricing option suits my needs best?
The pricing options vary based on user requirements and access needs. Individual users may opt for single-user licenses, while businesses requiring broader access may choose multi-user or enterprise licenses for cost-effective access to the report.
13. Are there any additional resources or data provided in the EV DC Energy Meter report?
While the report offers comprehensive insights, it's advisable to review the specific contents or supplementary materials provided to ascertain if additional resources or data are available.
14. How can I stay updated on further developments or reports in the EV DC Energy Meter?
To stay informed about further developments, trends, and reports in the EV DC Energy Meter, consider subscribing to industry newsletters, following relevant companies and organizations, or regularly checking reputable industry news sources and publications.
Methodology
Step 1 - Identification of Relevant Samples Size from Population Database


Step 2 - Approaches for Defining Global Market Size (Value, Volume* & Price*)

Note*: In applicable scenarios
Step 3 - Data Sources
Primary Research
- Web Analytics
- Survey Reports
- Research Institute
- Latest Research Reports
- Opinion Leaders
Secondary Research
- Annual Reports
- White Paper
- Latest Press Release
- Industry Association
- Paid Database
- Investor Presentations

Step 4 - Data Triangulation
Involves using different sources of information in order to increase the validity of a study
These sources are likely to be stakeholders in a program - participants, other researchers, program staff, other community members, and so on.
Then we put all data in single framework & apply various statistical tools to find out the dynamic on the market.
During the analysis stage, feedback from the stakeholder groups would be compared to determine areas of agreement as well as areas of divergence