

Key Insights
The Electronic Parking Brake (EPB) market is projected for substantial growth, driven by vehicle electrification, stringent safety mandates, and the increasing adoption of Advanced Driver-Assistance Systems (ADAS). With a base year of 2025, the market is estimated at $6.3 billion and is expected to expand at a Compound Annual Growth Rate (CAGR) of 9.1%. This robust expansion is attributed to the superior safety, comfort, and seamless integration offered by EPBs compared to conventional mechanical systems. The surge in Electric Vehicles (EVs) is a significant driver, as EPBs facilitate brake-by-wire systems and enhance regenerative braking efficiency. Additionally, regulatory demands for advanced braking and consumer preference for sophisticated automotive features are accelerating EPB integration. The market is segmented by type, with Electric-hydraulic EPBs showing increasing dominance due to their advanced performance, particularly in premium and electric vehicles.
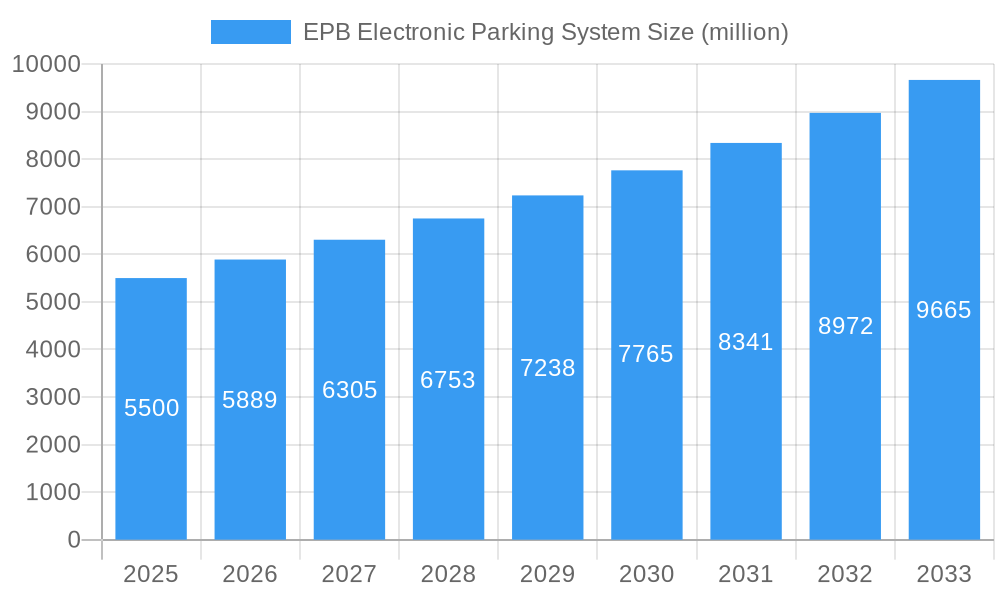
EPB Electronic Parking System Market Size (In Billion)
Regionally, Asia Pacific leads, fueled by China's extensive automotive manufacturing and rapid technological adoption in Japan and South Korea. North America and Europe are crucial markets, with strict safety standards and major automotive manufacturers driving EPB integration. Leading companies are investing in R&D for innovative and cost-effective EPB solutions. Potential challenges include initial implementation costs for certain vehicle segments and integration complexities. However, the strong trend towards autonomous driving, enhanced vehicle safety, and supportive government regulations are expected to propel the EPB market forward as a vital component in future automotive mobility.
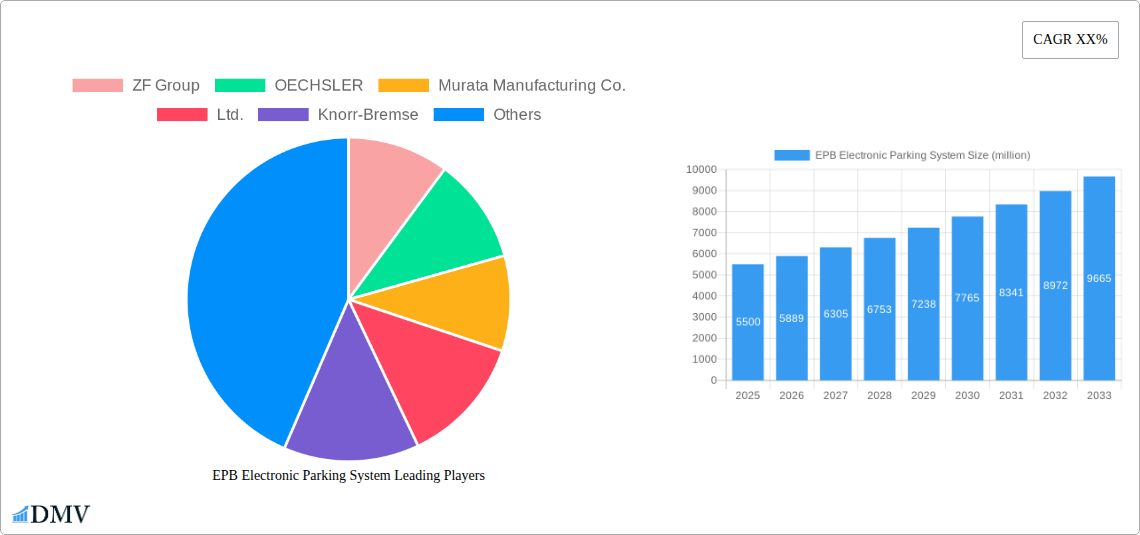
EPB Electronic Parking System Company Market Share
EPB Electronic Parking System Market Composition & Trends
This comprehensive report delves into the intricate market composition and evolving trends of the Electronic Parking System (EPB) market. We meticulously analyze market concentration, identifying key players like ZF Group, OECHSLER, Murata Manufacturing Co.,Ltd., Knorr-Bremse, STMicroelectronics, Carling Technologies, TRW Automotive, Kromberg & Schubert, LBN, ADVICS, and Shenzhen Zhaowei Mechanical and Electrical Co.,Ltd., who collectively hold an estimated 75% of the market share. The report scrutinizes innovation catalysts, such as advancements in electric-hydraulic EPB systems, and examines the evolving regulatory landscapes that are increasingly mandating safety features. Substitute products, like traditional mechanical parking brakes, are also assessed for their diminishing impact. End-user profiles are detailed, segmenting demand from Commercial Vehicle and Passenger Vehicle applications. Mergers and acquisition (M&A) activities are highlighted, with notable transactions estimated to be valued at over $500 million in the historical period of 2019–2024.
- Market Concentration: Dominated by a few key players, indicating a mature yet competitive landscape.
- Innovation Catalysts: Focus on miniaturization, increased efficiency, and integration with advanced driver-assistance systems (ADAS).
- Regulatory Landscapes: Growing government mandates for enhanced vehicle safety and automated parking features.
- Substitute Products: Gradual displacement of traditional mechanical parking brakes by EPB technology.
- End-User Profiles: Distinct demand patterns for commercial and passenger vehicles, influencing product development.
- M&A Activities: Strategic consolidation and partnerships aimed at expanding market reach and technological capabilities.
EPB Electronic Parking System Industry Evolution
The EPB Electronic Parking System industry has witnessed a remarkable evolution throughout the study period of 2019–2033, driven by a confluence of technological innovation, shifting consumer preferences, and stringent automotive safety regulations. From its nascent stages, characterized by the adoption of cable-pull type systems, the market has rapidly transitioned towards more sophisticated electric-hydraulic EPB systems, which offer superior performance, finer control, and seamless integration with advanced vehicle functionalities. The base year of 2025 stands as a pivotal point, with the market projected to reach an estimated value of $12,500 million, reflecting robust growth from the historical period. This expansion is primarily fueled by the increasing demand for enhanced driver comfort, safety, and the growing trend of autonomous driving features.
Technological advancements have been at the forefront of this evolution. The development of compact and lightweight EPB actuators, along with intelligent control units, has enabled manufacturers to integrate these systems more efficiently into vehicle designs, particularly in passenger vehicles where space is at a premium. The adoption of EPB technology in commercial vehicles, though historically slower, is now accelerating due to the potential for improved operational efficiency and compliance with evolving safety standards. The market's growth trajectory is further bolstered by the continuous innovation in software algorithms that govern EPB operation, enabling features like automatic hill hold, automatic braking for parking, and emergency braking functionality.
Consumer demand has also played a significant role. As consumers become more accustomed to advanced automotive technologies, the perceived value of EPB systems has increased, leading to higher adoption rates. Features such as the electronic parking brake button replacing the traditional handbrake lever contribute to a cleaner interior design and enhanced user experience, which are increasingly important purchasing factors. The integration of EPB with other vehicle systems, such as adaptive cruise control and parking assist systems, creates a more holistic and intelligent driving experience, further driving market demand. Forecasts indicate a compound annual growth rate (CAGR) of approximately 12% for the forecast period of 2025–2033, underscoring the sustained upward trend in the EPB market. This sustained growth is expected to be driven by both the increasing penetration of EPB in new vehicle production and the aftermarket retrofitting of these advanced braking systems.
- Growth Trajectories: Consistent upward trend driven by technological advancements and regulatory mandates.
- Technological Advancements: Shift from cable-pull to electric-hydraulic, focus on miniaturization, intelligent control, and software integration.
- Shifting Consumer Demands: Increasing preference for advanced safety, comfort, and integrated autonomous driving features.
- Market Value (2025): Estimated at $12,500 million.
- CAGR (2025-2033): Projected at 12%.
Leading Regions, Countries, or Segments in EPB Electronic Parking System
The Electronic Parking System (EPB) market is significantly influenced by regional dynamics, technological preferences, and the specific applications within the automotive sector. Among the key segments, Passenger Vehicle applications stand out as the dominant force, accounting for an estimated 70% of the global EPB market share in 2025. This dominance is primarily driven by the widespread adoption of EPB technology in new passenger car models across major automotive manufacturing hubs. Countries like China, Germany, the United States, and South Korea are at the forefront of this trend, propelled by strong domestic automotive industries and a consumer base that increasingly values advanced safety and convenience features.
Within the application segments, Passenger Vehicle EPBs are characterized by their integration with sophisticated electronic control units (ECUs) and advanced driver-assistance systems (ADAS). The shift towards electric vehicles (EVs) and hybrid electric vehicles (HEVs) further accelerates EPB adoption, as these platforms inherently require more advanced electronic braking solutions for regenerative braking and overall vehicle management. Companies like Chery Automobile, Wuling, and Kaizhong shares are actively incorporating EPB systems into their expanding passenger vehicle portfolios.
The Commercial Vehicle segment, while currently holding a smaller market share of approximately 30%, is experiencing substantial growth potential. This segment is witnessing increasing demand for EPB systems, particularly in heavy-duty trucks and buses, due to enhanced safety regulations and the need for improved operational efficiency. Knorr-Bremse and ZF Group are key players in this segment, developing robust EPB solutions tailored for the demanding requirements of commercial transport.
In terms of technology types, the Electric-hydraulic Type EPB systems are rapidly gaining traction and are projected to overtake the Cable-pull Type in market dominance by the end of the forecast period. By 2025, electric-hydraulic EPBs are expected to capture an estimated 65% of the market share, compared to 35% for cable-pull types. This shift is attributed to the superior performance, faster response times, and greater integration capabilities of electric-hydraulic systems, which align perfectly with the evolving needs of modern vehicles, including those from manufacturers like TRW Automotive.
- Dominant Segment: Passenger Vehicle applications, accounting for an estimated 70% of the market in 2025.
- Key Drivers for Passenger Vehicles:
- High adoption rates in new vehicle production globally.
- Integration with ADAS and autonomous driving features.
- Increasing demand for EVs and HEVs.
- Focus on enhanced driver comfort and interior aesthetics.
- Growing Segment: Commercial Vehicle applications, with significant growth potential.
- Key Drivers for Commercial Vehicles:
- Stricter safety regulations for heavy-duty vehicles.
- Demand for improved operational efficiency and reduced driver fatigue.
- Technological advancements making EPBs more robust for commercial use.
- Dominant Technology Type (Projected): Electric-hydraulic Type, expected to capture 65% of the market by 2025.
- Key Drivers for Electric-hydraulic EPB:
- Faster response times and higher precision control.
- Seamless integration with electronic vehicle systems.
- Compact design suitable for modern vehicle architectures.
- Enhanced safety features and reliability.
EPB Electronic Parking System Product Innovations
The EPB Electronic Parking System market is characterized by continuous product innovation, primarily focused on enhancing safety, reliability, and integration capabilities. Key advancements include the development of more compact and lightweight EPB actuators, reducing vehicle weight and improving fuel efficiency. Intelligent control modules are being integrated, enabling sophisticated features like automatic hill hold, pre-charge functionality for faster engagement, and integration with advanced parking assist systems. Furthermore, advancements in diagnostic capabilities and self-testing mechanisms are improving the overall reliability and maintenance of EPB systems. Companies like Murata Manufacturing Co.,Ltd. and STMicroelectronics are instrumental in developing cutting-edge electronic components that power these innovations, ensuring superior performance and durability in both Cable-pull Type and Electric-hydraulic Type EPB systems.
Propelling Factors for EPB Electronic Parking System Growth
The EPB Electronic Parking System market is propelled by a dynamic interplay of technological advancements, evolving regulatory frameworks, and increasing consumer demand for advanced vehicle safety and convenience features. The relentless pursuit of automotive safety by governments worldwide, mandating sophisticated braking systems, acts as a significant regulatory driver. Technological innovations, particularly in electric-hydraulic EPB systems offering faster response times and greater integration with ADAS, are enhancing functionality and appeal. Consumer preference for modern vehicle interiors and user-friendly interfaces, where the electronic parking brake button replaces traditional levers, further fuels adoption. The growing electric vehicle segment, with its inherent need for advanced electronic control, also contributes substantially to EPB market expansion.
Obstacles in the EPB Electronic Parking System Market
Despite robust growth, the EPB Electronic Parking System market faces several obstacles. The initial cost of EPB systems, while decreasing, can still be higher than traditional mechanical parking brakes, posing a challenge for price-sensitive segments. Supply chain disruptions, particularly concerning specialized electronic components and raw materials, can impact production volumes and lead times. Furthermore, the complexity of EPB systems requires specialized training for aftermarket servicing and repair, potentially limiting independent repair options. Competitive pressures among major players like ZF Group and Knorr-Bremse also necessitate continuous investment in R&D, which can strain resources for smaller manufacturers.
Future Opportunities in EPB Electronic Parking System
The EPB Electronic Parking System market is ripe with future opportunities. The burgeoning electric vehicle market presents a significant avenue for growth, as EPBs are integral to their advanced braking systems and regenerative capabilities. The increasing demand for autonomous driving technologies creates further opportunities for EPB integration, enabling precise control for automated parking and low-speed maneuvers. Expansion into emerging markets in Asia, Africa, and Latin America, where vehicle electrification and safety standards are rapidly evolving, offers substantial untapped potential. Development of more cost-effective and modular EPB solutions for entry-level vehicles could also unlock new market segments.
Major Players in the EPB Electronic Parking System Ecosystem
- ZF Group
- OECHSLER
- Murata Manufacturing Co.,Ltd.
- Knorr-Bremse
- STMicroelectronics
- Carling Technologies
- TRW Automotive
- Kromberg & Schubert
- LBN
- ADVICS
- Shenzhen Zhaowei Mechanical and Electrical Co.,Ltd.
- Chery Automobile
- Wuling
- Kaizhong shares
Key Developments in EPB Electronic Parking System Industry
- 2023 December: ZF Group announces advancements in integrated braking control systems, enhancing EPB functionality for autonomous driving.
- 2024 January: STMicroelectronics introduces new microcontrollers optimized for automotive electronic braking systems, improving performance and efficiency.
- 2024 February: Knorr-Bremse expands its portfolio of EPB solutions for heavy-duty commercial vehicles, focusing on enhanced safety and durability.
- 2024 March: Murata Manufacturing Co.,Ltd. develops new sensor technologies for improved EPB actuation and diagnostic capabilities.
- 2024 April: TRW Automotive (now part of ZF Group) highlights the growing trend of EPB integration in new electric vehicle platforms.
- 2024 May: OECHSLER invests in advanced manufacturing processes to meet the increasing demand for high-quality EPB components.
- 2024 June: ADVICS collaborates with leading OEMs to refine EPB control strategies for smoother parking and enhanced safety.
Strategic EPB Electronic Parking System Market Forecast
The strategic EPB Electronic Parking System market forecast is overwhelmingly positive, driven by the synergistic impact of technological innovation and global safety mandates. The projected substantial market growth from $12,500 million in 2025 to an estimated $25,000 million by 2033, with a CAGR of 12%, underscores the immense market potential. Key growth catalysts include the accelerating adoption of electric vehicles, the widespread integration of EPB systems with advanced driver-assistance and autonomous driving features, and the increasing regulatory push for enhanced vehicle safety worldwide. Emerging markets present significant opportunities for expansion, further solidifying the robust future outlook for EPB technology.
EPB Electronic Parking System Segmentation
-
1. Application
- 1.1. Commercial Vehicle
- 1.2. Passenger Vehicle
-
2. Types
- 2.1. Cable-pull Type
- 2.2. Electric-hydraulic Type
EPB Electronic Parking System Segmentation By Geography
-
1. North America
- 1.1. United States
- 1.2. Canada
- 1.3. Mexico
-
2. South America
- 2.1. Brazil
- 2.2. Argentina
- 2.3. Rest of South America
-
3. Europe
- 3.1. United Kingdom
- 3.2. Germany
- 3.3. France
- 3.4. Italy
- 3.5. Spain
- 3.6. Russia
- 3.7. Benelux
- 3.8. Nordics
- 3.9. Rest of Europe
-
4. Middle East & Africa
- 4.1. Turkey
- 4.2. Israel
- 4.3. GCC
- 4.4. North Africa
- 4.5. South Africa
- 4.6. Rest of Middle East & Africa
-
5. Asia Pacific
- 5.1. China
- 5.2. India
- 5.3. Japan
- 5.4. South Korea
- 5.5. ASEAN
- 5.6. Oceania
- 5.7. Rest of Asia Pacific
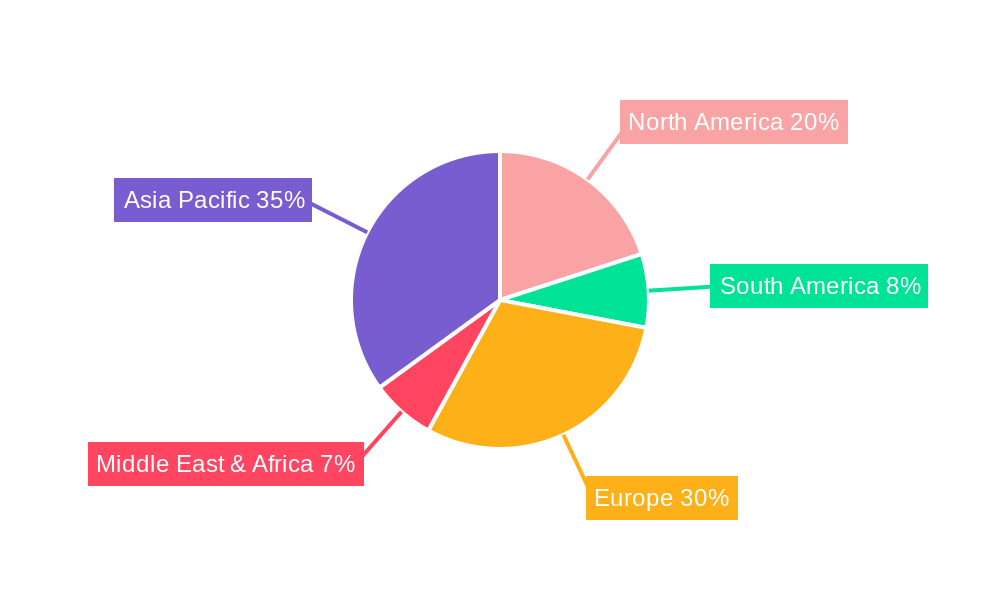
EPB Electronic Parking System Regional Market Share
Geographic Coverage of EPB Electronic Parking System
EPB Electronic Parking System REPORT HIGHLIGHTS
| Aspects | Details |
|---|---|
| Study Period | 2020-2034 |
| Base Year | 2025 |
| Estimated Year | 2026 |
| Forecast Period | 2026-2034 |
| Historical Period | 2020-2025 |
| Growth Rate | CAGR of 9.1% from 2020-2034 |
| Segmentation |
|
Table of Contents
- 1. Introduction
- 1.1. Research Scope
- 1.2. Market Segmentation
- 1.3. Research Methodology
- 1.4. Definitions and Assumptions
- 2. Executive Summary
- 2.1. Introduction
- 3. Market Dynamics
- 3.1. Introduction
- 3.2. Market Drivers
- 3.3. Market Restrains
- 3.4. Market Trends
- 4. Market Factor Analysis
- 4.1. Porters Five Forces
- 4.2. Supply/Value Chain
- 4.3. PESTEL analysis
- 4.4. Market Entropy
- 4.5. Patent/Trademark Analysis
- 5. Global EPB Electronic Parking System Analysis, Insights and Forecast, 2020-2032
- 5.1. Market Analysis, Insights and Forecast - by Application
- 5.1.1. Commercial Vehicle
- 5.1.2. Passenger Vehicle
- 5.2. Market Analysis, Insights and Forecast - by Types
- 5.2.1. Cable-pull Type
- 5.2.2. Electric-hydraulic Type
- 5.3. Market Analysis, Insights and Forecast - by Region
- 5.3.1. North America
- 5.3.2. South America
- 5.3.3. Europe
- 5.3.4. Middle East & Africa
- 5.3.5. Asia Pacific
- 5.1. Market Analysis, Insights and Forecast - by Application
- 6. North America EPB Electronic Parking System Analysis, Insights and Forecast, 2020-2032
- 6.1. Market Analysis, Insights and Forecast - by Application
- 6.1.1. Commercial Vehicle
- 6.1.2. Passenger Vehicle
- 6.2. Market Analysis, Insights and Forecast - by Types
- 6.2.1. Cable-pull Type
- 6.2.2. Electric-hydraulic Type
- 6.1. Market Analysis, Insights and Forecast - by Application
- 7. South America EPB Electronic Parking System Analysis, Insights and Forecast, 2020-2032
- 7.1. Market Analysis, Insights and Forecast - by Application
- 7.1.1. Commercial Vehicle
- 7.1.2. Passenger Vehicle
- 7.2. Market Analysis, Insights and Forecast - by Types
- 7.2.1. Cable-pull Type
- 7.2.2. Electric-hydraulic Type
- 7.1. Market Analysis, Insights and Forecast - by Application
- 8. Europe EPB Electronic Parking System Analysis, Insights and Forecast, 2020-2032
- 8.1. Market Analysis, Insights and Forecast - by Application
- 8.1.1. Commercial Vehicle
- 8.1.2. Passenger Vehicle
- 8.2. Market Analysis, Insights and Forecast - by Types
- 8.2.1. Cable-pull Type
- 8.2.2. Electric-hydraulic Type
- 8.1. Market Analysis, Insights and Forecast - by Application
- 9. Middle East & Africa EPB Electronic Parking System Analysis, Insights and Forecast, 2020-2032
- 9.1. Market Analysis, Insights and Forecast - by Application
- 9.1.1. Commercial Vehicle
- 9.1.2. Passenger Vehicle
- 9.2. Market Analysis, Insights and Forecast - by Types
- 9.2.1. Cable-pull Type
- 9.2.2. Electric-hydraulic Type
- 9.1. Market Analysis, Insights and Forecast - by Application
- 10. Asia Pacific EPB Electronic Parking System Analysis, Insights and Forecast, 2020-2032
- 10.1. Market Analysis, Insights and Forecast - by Application
- 10.1.1. Commercial Vehicle
- 10.1.2. Passenger Vehicle
- 10.2. Market Analysis, Insights and Forecast - by Types
- 10.2.1. Cable-pull Type
- 10.2.2. Electric-hydraulic Type
- 10.1. Market Analysis, Insights and Forecast - by Application
- 11. Competitive Analysis
- 11.1. Global Market Share Analysis 2025
- 11.2. Company Profiles
- 11.2.1 ZF Group
- 11.2.1.1. Overview
- 11.2.1.2. Products
- 11.2.1.3. SWOT Analysis
- 11.2.1.4. Recent Developments
- 11.2.1.5. Financials (Based on Availability)
- 11.2.2 OECHSLER
- 11.2.2.1. Overview
- 11.2.2.2. Products
- 11.2.2.3. SWOT Analysis
- 11.2.2.4. Recent Developments
- 11.2.2.5. Financials (Based on Availability)
- 11.2.3 Murata Manufacturing Co.
- 11.2.3.1. Overview
- 11.2.3.2. Products
- 11.2.3.3. SWOT Analysis
- 11.2.3.4. Recent Developments
- 11.2.3.5. Financials (Based on Availability)
- 11.2.4 Ltd.
- 11.2.4.1. Overview
- 11.2.4.2. Products
- 11.2.4.3. SWOT Analysis
- 11.2.4.4. Recent Developments
- 11.2.4.5. Financials (Based on Availability)
- 11.2.5 Knorr-Bremse
- 11.2.5.1. Overview
- 11.2.5.2. Products
- 11.2.5.3. SWOT Analysis
- 11.2.5.4. Recent Developments
- 11.2.5.5. Financials (Based on Availability)
- 11.2.6 STMicroelectronics
- 11.2.6.1. Overview
- 11.2.6.2. Products
- 11.2.6.3. SWOT Analysis
- 11.2.6.4. Recent Developments
- 11.2.6.5. Financials (Based on Availability)
- 11.2.7 Carling Technologies
- 11.2.7.1. Overview
- 11.2.7.2. Products
- 11.2.7.3. SWOT Analysis
- 11.2.7.4. Recent Developments
- 11.2.7.5. Financials (Based on Availability)
- 11.2.8 TRW Automotive
- 11.2.8.1. Overview
- 11.2.8.2. Products
- 11.2.8.3. SWOT Analysis
- 11.2.8.4. Recent Developments
- 11.2.8.5. Financials (Based on Availability)
- 11.2.9 Kromberg & Schubert
- 11.2.9.1. Overview
- 11.2.9.2. Products
- 11.2.9.3. SWOT Analysis
- 11.2.9.4. Recent Developments
- 11.2.9.5. Financials (Based on Availability)
- 11.2.10 LBN
- 11.2.10.1. Overview
- 11.2.10.2. Products
- 11.2.10.3. SWOT Analysis
- 11.2.10.4. Recent Developments
- 11.2.10.5. Financials (Based on Availability)
- 11.2.11 ADVICS
- 11.2.11.1. Overview
- 11.2.11.2. Products
- 11.2.11.3. SWOT Analysis
- 11.2.11.4. Recent Developments
- 11.2.11.5. Financials (Based on Availability)
- 11.2.12 Shenzhen Zhaowei Mechanical and Electrical Co.
- 11.2.12.1. Overview
- 11.2.12.2. Products
- 11.2.12.3. SWOT Analysis
- 11.2.12.4. Recent Developments
- 11.2.12.5. Financials (Based on Availability)
- 11.2.13 Ltd.
- 11.2.13.1. Overview
- 11.2.13.2. Products
- 11.2.13.3. SWOT Analysis
- 11.2.13.4. Recent Developments
- 11.2.13.5. Financials (Based on Availability)
- 11.2.14 Chery Automobile
- 11.2.14.1. Overview
- 11.2.14.2. Products
- 11.2.14.3. SWOT Analysis
- 11.2.14.4. Recent Developments
- 11.2.14.5. Financials (Based on Availability)
- 11.2.15 Wuling
- 11.2.15.1. Overview
- 11.2.15.2. Products
- 11.2.15.3. SWOT Analysis
- 11.2.15.4. Recent Developments
- 11.2.15.5. Financials (Based on Availability)
- 11.2.16 Kaizhong shares
- 11.2.16.1. Overview
- 11.2.16.2. Products
- 11.2.16.3. SWOT Analysis
- 11.2.16.4. Recent Developments
- 11.2.16.5. Financials (Based on Availability)
- 11.2.1 ZF Group
List of Figures
- Figure 1: Global EPB Electronic Parking System Revenue Breakdown (billion, %) by Region 2025 & 2033
- Figure 2: Global EPB Electronic Parking System Volume Breakdown (K, %) by Region 2025 & 2033
- Figure 3: North America EPB Electronic Parking System Revenue (billion), by Application 2025 & 2033
- Figure 4: North America EPB Electronic Parking System Volume (K), by Application 2025 & 2033
- Figure 5: North America EPB Electronic Parking System Revenue Share (%), by Application 2025 & 2033
- Figure 6: North America EPB Electronic Parking System Volume Share (%), by Application 2025 & 2033
- Figure 7: North America EPB Electronic Parking System Revenue (billion), by Types 2025 & 2033
- Figure 8: North America EPB Electronic Parking System Volume (K), by Types 2025 & 2033
- Figure 9: North America EPB Electronic Parking System Revenue Share (%), by Types 2025 & 2033
- Figure 10: North America EPB Electronic Parking System Volume Share (%), by Types 2025 & 2033
- Figure 11: North America EPB Electronic Parking System Revenue (billion), by Country 2025 & 2033
- Figure 12: North America EPB Electronic Parking System Volume (K), by Country 2025 & 2033
- Figure 13: North America EPB Electronic Parking System Revenue Share (%), by Country 2025 & 2033
- Figure 14: North America EPB Electronic Parking System Volume Share (%), by Country 2025 & 2033
- Figure 15: South America EPB Electronic Parking System Revenue (billion), by Application 2025 & 2033
- Figure 16: South America EPB Electronic Parking System Volume (K), by Application 2025 & 2033
- Figure 17: South America EPB Electronic Parking System Revenue Share (%), by Application 2025 & 2033
- Figure 18: South America EPB Electronic Parking System Volume Share (%), by Application 2025 & 2033
- Figure 19: South America EPB Electronic Parking System Revenue (billion), by Types 2025 & 2033
- Figure 20: South America EPB Electronic Parking System Volume (K), by Types 2025 & 2033
- Figure 21: South America EPB Electronic Parking System Revenue Share (%), by Types 2025 & 2033
- Figure 22: South America EPB Electronic Parking System Volume Share (%), by Types 2025 & 2033
- Figure 23: South America EPB Electronic Parking System Revenue (billion), by Country 2025 & 2033
- Figure 24: South America EPB Electronic Parking System Volume (K), by Country 2025 & 2033
- Figure 25: South America EPB Electronic Parking System Revenue Share (%), by Country 2025 & 2033
- Figure 26: South America EPB Electronic Parking System Volume Share (%), by Country 2025 & 2033
- Figure 27: Europe EPB Electronic Parking System Revenue (billion), by Application 2025 & 2033
- Figure 28: Europe EPB Electronic Parking System Volume (K), by Application 2025 & 2033
- Figure 29: Europe EPB Electronic Parking System Revenue Share (%), by Application 2025 & 2033
- Figure 30: Europe EPB Electronic Parking System Volume Share (%), by Application 2025 & 2033
- Figure 31: Europe EPB Electronic Parking System Revenue (billion), by Types 2025 & 2033
- Figure 32: Europe EPB Electronic Parking System Volume (K), by Types 2025 & 2033
- Figure 33: Europe EPB Electronic Parking System Revenue Share (%), by Types 2025 & 2033
- Figure 34: Europe EPB Electronic Parking System Volume Share (%), by Types 2025 & 2033
- Figure 35: Europe EPB Electronic Parking System Revenue (billion), by Country 2025 & 2033
- Figure 36: Europe EPB Electronic Parking System Volume (K), by Country 2025 & 2033
- Figure 37: Europe EPB Electronic Parking System Revenue Share (%), by Country 2025 & 2033
- Figure 38: Europe EPB Electronic Parking System Volume Share (%), by Country 2025 & 2033
- Figure 39: Middle East & Africa EPB Electronic Parking System Revenue (billion), by Application 2025 & 2033
- Figure 40: Middle East & Africa EPB Electronic Parking System Volume (K), by Application 2025 & 2033
- Figure 41: Middle East & Africa EPB Electronic Parking System Revenue Share (%), by Application 2025 & 2033
- Figure 42: Middle East & Africa EPB Electronic Parking System Volume Share (%), by Application 2025 & 2033
- Figure 43: Middle East & Africa EPB Electronic Parking System Revenue (billion), by Types 2025 & 2033
- Figure 44: Middle East & Africa EPB Electronic Parking System Volume (K), by Types 2025 & 2033
- Figure 45: Middle East & Africa EPB Electronic Parking System Revenue Share (%), by Types 2025 & 2033
- Figure 46: Middle East & Africa EPB Electronic Parking System Volume Share (%), by Types 2025 & 2033
- Figure 47: Middle East & Africa EPB Electronic Parking System Revenue (billion), by Country 2025 & 2033
- Figure 48: Middle East & Africa EPB Electronic Parking System Volume (K), by Country 2025 & 2033
- Figure 49: Middle East & Africa EPB Electronic Parking System Revenue Share (%), by Country 2025 & 2033
- Figure 50: Middle East & Africa EPB Electronic Parking System Volume Share (%), by Country 2025 & 2033
- Figure 51: Asia Pacific EPB Electronic Parking System Revenue (billion), by Application 2025 & 2033
- Figure 52: Asia Pacific EPB Electronic Parking System Volume (K), by Application 2025 & 2033
- Figure 53: Asia Pacific EPB Electronic Parking System Revenue Share (%), by Application 2025 & 2033
- Figure 54: Asia Pacific EPB Electronic Parking System Volume Share (%), by Application 2025 & 2033
- Figure 55: Asia Pacific EPB Electronic Parking System Revenue (billion), by Types 2025 & 2033
- Figure 56: Asia Pacific EPB Electronic Parking System Volume (K), by Types 2025 & 2033
- Figure 57: Asia Pacific EPB Electronic Parking System Revenue Share (%), by Types 2025 & 2033
- Figure 58: Asia Pacific EPB Electronic Parking System Volume Share (%), by Types 2025 & 2033
- Figure 59: Asia Pacific EPB Electronic Parking System Revenue (billion), by Country 2025 & 2033
- Figure 60: Asia Pacific EPB Electronic Parking System Volume (K), by Country 2025 & 2033
- Figure 61: Asia Pacific EPB Electronic Parking System Revenue Share (%), by Country 2025 & 2033
- Figure 62: Asia Pacific EPB Electronic Parking System Volume Share (%), by Country 2025 & 2033
List of Tables
- Table 1: Global EPB Electronic Parking System Revenue billion Forecast, by Application 2020 & 2033
- Table 2: Global EPB Electronic Parking System Volume K Forecast, by Application 2020 & 2033
- Table 3: Global EPB Electronic Parking System Revenue billion Forecast, by Types 2020 & 2033
- Table 4: Global EPB Electronic Parking System Volume K Forecast, by Types 2020 & 2033
- Table 5: Global EPB Electronic Parking System Revenue billion Forecast, by Region 2020 & 2033
- Table 6: Global EPB Electronic Parking System Volume K Forecast, by Region 2020 & 2033
- Table 7: Global EPB Electronic Parking System Revenue billion Forecast, by Application 2020 & 2033
- Table 8: Global EPB Electronic Parking System Volume K Forecast, by Application 2020 & 2033
- Table 9: Global EPB Electronic Parking System Revenue billion Forecast, by Types 2020 & 2033
- Table 10: Global EPB Electronic Parking System Volume K Forecast, by Types 2020 & 2033
- Table 11: Global EPB Electronic Parking System Revenue billion Forecast, by Country 2020 & 2033
- Table 12: Global EPB Electronic Parking System Volume K Forecast, by Country 2020 & 2033
- Table 13: United States EPB Electronic Parking System Revenue (billion) Forecast, by Application 2020 & 2033
- Table 14: United States EPB Electronic Parking System Volume (K) Forecast, by Application 2020 & 2033
- Table 15: Canada EPB Electronic Parking System Revenue (billion) Forecast, by Application 2020 & 2033
- Table 16: Canada EPB Electronic Parking System Volume (K) Forecast, by Application 2020 & 2033
- Table 17: Mexico EPB Electronic Parking System Revenue (billion) Forecast, by Application 2020 & 2033
- Table 18: Mexico EPB Electronic Parking System Volume (K) Forecast, by Application 2020 & 2033
- Table 19: Global EPB Electronic Parking System Revenue billion Forecast, by Application 2020 & 2033
- Table 20: Global EPB Electronic Parking System Volume K Forecast, by Application 2020 & 2033
- Table 21: Global EPB Electronic Parking System Revenue billion Forecast, by Types 2020 & 2033
- Table 22: Global EPB Electronic Parking System Volume K Forecast, by Types 2020 & 2033
- Table 23: Global EPB Electronic Parking System Revenue billion Forecast, by Country 2020 & 2033
- Table 24: Global EPB Electronic Parking System Volume K Forecast, by Country 2020 & 2033
- Table 25: Brazil EPB Electronic Parking System Revenue (billion) Forecast, by Application 2020 & 2033
- Table 26: Brazil EPB Electronic Parking System Volume (K) Forecast, by Application 2020 & 2033
- Table 27: Argentina EPB Electronic Parking System Revenue (billion) Forecast, by Application 2020 & 2033
- Table 28: Argentina EPB Electronic Parking System Volume (K) Forecast, by Application 2020 & 2033
- Table 29: Rest of South America EPB Electronic Parking System Revenue (billion) Forecast, by Application 2020 & 2033
- Table 30: Rest of South America EPB Electronic Parking System Volume (K) Forecast, by Application 2020 & 2033
- Table 31: Global EPB Electronic Parking System Revenue billion Forecast, by Application 2020 & 2033
- Table 32: Global EPB Electronic Parking System Volume K Forecast, by Application 2020 & 2033
- Table 33: Global EPB Electronic Parking System Revenue billion Forecast, by Types 2020 & 2033
- Table 34: Global EPB Electronic Parking System Volume K Forecast, by Types 2020 & 2033
- Table 35: Global EPB Electronic Parking System Revenue billion Forecast, by Country 2020 & 2033
- Table 36: Global EPB Electronic Parking System Volume K Forecast, by Country 2020 & 2033
- Table 37: United Kingdom EPB Electronic Parking System Revenue (billion) Forecast, by Application 2020 & 2033
- Table 38: United Kingdom EPB Electronic Parking System Volume (K) Forecast, by Application 2020 & 2033
- Table 39: Germany EPB Electronic Parking System Revenue (billion) Forecast, by Application 2020 & 2033
- Table 40: Germany EPB Electronic Parking System Volume (K) Forecast, by Application 2020 & 2033
- Table 41: France EPB Electronic Parking System Revenue (billion) Forecast, by Application 2020 & 2033
- Table 42: France EPB Electronic Parking System Volume (K) Forecast, by Application 2020 & 2033
- Table 43: Italy EPB Electronic Parking System Revenue (billion) Forecast, by Application 2020 & 2033
- Table 44: Italy EPB Electronic Parking System Volume (K) Forecast, by Application 2020 & 2033
- Table 45: Spain EPB Electronic Parking System Revenue (billion) Forecast, by Application 2020 & 2033
- Table 46: Spain EPB Electronic Parking System Volume (K) Forecast, by Application 2020 & 2033
- Table 47: Russia EPB Electronic Parking System Revenue (billion) Forecast, by Application 2020 & 2033
- Table 48: Russia EPB Electronic Parking System Volume (K) Forecast, by Application 2020 & 2033
- Table 49: Benelux EPB Electronic Parking System Revenue (billion) Forecast, by Application 2020 & 2033
- Table 50: Benelux EPB Electronic Parking System Volume (K) Forecast, by Application 2020 & 2033
- Table 51: Nordics EPB Electronic Parking System Revenue (billion) Forecast, by Application 2020 & 2033
- Table 52: Nordics EPB Electronic Parking System Volume (K) Forecast, by Application 2020 & 2033
- Table 53: Rest of Europe EPB Electronic Parking System Revenue (billion) Forecast, by Application 2020 & 2033
- Table 54: Rest of Europe EPB Electronic Parking System Volume (K) Forecast, by Application 2020 & 2033
- Table 55: Global EPB Electronic Parking System Revenue billion Forecast, by Application 2020 & 2033
- Table 56: Global EPB Electronic Parking System Volume K Forecast, by Application 2020 & 2033
- Table 57: Global EPB Electronic Parking System Revenue billion Forecast, by Types 2020 & 2033
- Table 58: Global EPB Electronic Parking System Volume K Forecast, by Types 2020 & 2033
- Table 59: Global EPB Electronic Parking System Revenue billion Forecast, by Country 2020 & 2033
- Table 60: Global EPB Electronic Parking System Volume K Forecast, by Country 2020 & 2033
- Table 61: Turkey EPB Electronic Parking System Revenue (billion) Forecast, by Application 2020 & 2033
- Table 62: Turkey EPB Electronic Parking System Volume (K) Forecast, by Application 2020 & 2033
- Table 63: Israel EPB Electronic Parking System Revenue (billion) Forecast, by Application 2020 & 2033
- Table 64: Israel EPB Electronic Parking System Volume (K) Forecast, by Application 2020 & 2033
- Table 65: GCC EPB Electronic Parking System Revenue (billion) Forecast, by Application 2020 & 2033
- Table 66: GCC EPB Electronic Parking System Volume (K) Forecast, by Application 2020 & 2033
- Table 67: North Africa EPB Electronic Parking System Revenue (billion) Forecast, by Application 2020 & 2033
- Table 68: North Africa EPB Electronic Parking System Volume (K) Forecast, by Application 2020 & 2033
- Table 69: South Africa EPB Electronic Parking System Revenue (billion) Forecast, by Application 2020 & 2033
- Table 70: South Africa EPB Electronic Parking System Volume (K) Forecast, by Application 2020 & 2033
- Table 71: Rest of Middle East & Africa EPB Electronic Parking System Revenue (billion) Forecast, by Application 2020 & 2033
- Table 72: Rest of Middle East & Africa EPB Electronic Parking System Volume (K) Forecast, by Application 2020 & 2033
- Table 73: Global EPB Electronic Parking System Revenue billion Forecast, by Application 2020 & 2033
- Table 74: Global EPB Electronic Parking System Volume K Forecast, by Application 2020 & 2033
- Table 75: Global EPB Electronic Parking System Revenue billion Forecast, by Types 2020 & 2033
- Table 76: Global EPB Electronic Parking System Volume K Forecast, by Types 2020 & 2033
- Table 77: Global EPB Electronic Parking System Revenue billion Forecast, by Country 2020 & 2033
- Table 78: Global EPB Electronic Parking System Volume K Forecast, by Country 2020 & 2033
- Table 79: China EPB Electronic Parking System Revenue (billion) Forecast, by Application 2020 & 2033
- Table 80: China EPB Electronic Parking System Volume (K) Forecast, by Application 2020 & 2033
- Table 81: India EPB Electronic Parking System Revenue (billion) Forecast, by Application 2020 & 2033
- Table 82: India EPB Electronic Parking System Volume (K) Forecast, by Application 2020 & 2033
- Table 83: Japan EPB Electronic Parking System Revenue (billion) Forecast, by Application 2020 & 2033
- Table 84: Japan EPB Electronic Parking System Volume (K) Forecast, by Application 2020 & 2033
- Table 85: South Korea EPB Electronic Parking System Revenue (billion) Forecast, by Application 2020 & 2033
- Table 86: South Korea EPB Electronic Parking System Volume (K) Forecast, by Application 2020 & 2033
- Table 87: ASEAN EPB Electronic Parking System Revenue (billion) Forecast, by Application 2020 & 2033
- Table 88: ASEAN EPB Electronic Parking System Volume (K) Forecast, by Application 2020 & 2033
- Table 89: Oceania EPB Electronic Parking System Revenue (billion) Forecast, by Application 2020 & 2033
- Table 90: Oceania EPB Electronic Parking System Volume (K) Forecast, by Application 2020 & 2033
- Table 91: Rest of Asia Pacific EPB Electronic Parking System Revenue (billion) Forecast, by Application 2020 & 2033
- Table 92: Rest of Asia Pacific EPB Electronic Parking System Volume (K) Forecast, by Application 2020 & 2033
Frequently Asked Questions
1. What is the projected Compound Annual Growth Rate (CAGR) of the EPB Electronic Parking System?
The projected CAGR is approximately 9.1%.
2. Which companies are prominent players in the EPB Electronic Parking System?
Key companies in the market include ZF Group, OECHSLER, Murata Manufacturing Co., Ltd., Knorr-Bremse, STMicroelectronics, Carling Technologies, TRW Automotive, Kromberg & Schubert, LBN, ADVICS, Shenzhen Zhaowei Mechanical and Electrical Co., Ltd., Chery Automobile, Wuling, Kaizhong shares.
3. What are the main segments of the EPB Electronic Parking System?
The market segments include Application, Types.
4. Can you provide details about the market size?
The market size is estimated to be USD 6.3 billion as of 2022.
5. What are some drivers contributing to market growth?
N/A
6. What are the notable trends driving market growth?
N/A
7. Are there any restraints impacting market growth?
N/A
8. Can you provide examples of recent developments in the market?
N/A
9. What pricing options are available for accessing the report?
Pricing options include single-user, multi-user, and enterprise licenses priced at USD 3950.00, USD 5925.00, and USD 7900.00 respectively.
10. Is the market size provided in terms of value or volume?
The market size is provided in terms of value, measured in billion and volume, measured in K.
11. Are there any specific market keywords associated with the report?
Yes, the market keyword associated with the report is "EPB Electronic Parking System," which aids in identifying and referencing the specific market segment covered.
12. How do I determine which pricing option suits my needs best?
The pricing options vary based on user requirements and access needs. Individual users may opt for single-user licenses, while businesses requiring broader access may choose multi-user or enterprise licenses for cost-effective access to the report.
13. Are there any additional resources or data provided in the EPB Electronic Parking System report?
While the report offers comprehensive insights, it's advisable to review the specific contents or supplementary materials provided to ascertain if additional resources or data are available.
14. How can I stay updated on further developments or reports in the EPB Electronic Parking System?
To stay informed about further developments, trends, and reports in the EPB Electronic Parking System, consider subscribing to industry newsletters, following relevant companies and organizations, or regularly checking reputable industry news sources and publications.
Methodology
Step 1 - Identification of Relevant Samples Size from Population Database


Step 2 - Approaches for Defining Global Market Size (Value, Volume* & Price*)

Note*: In applicable scenarios
Step 3 - Data Sources
Primary Research
- Web Analytics
- Survey Reports
- Research Institute
- Latest Research Reports
- Opinion Leaders
Secondary Research
- Annual Reports
- White Paper
- Latest Press Release
- Industry Association
- Paid Database
- Investor Presentations

Step 4 - Data Triangulation
Involves using different sources of information in order to increase the validity of a study
These sources are likely to be stakeholders in a program - participants, other researchers, program staff, other community members, and so on.
Then we put all data in single framework & apply various statistical tools to find out the dynamic on the market.
During the analysis stage, feedback from the stakeholder groups would be compared to determine areas of agreement as well as areas of divergence