

Key Insights
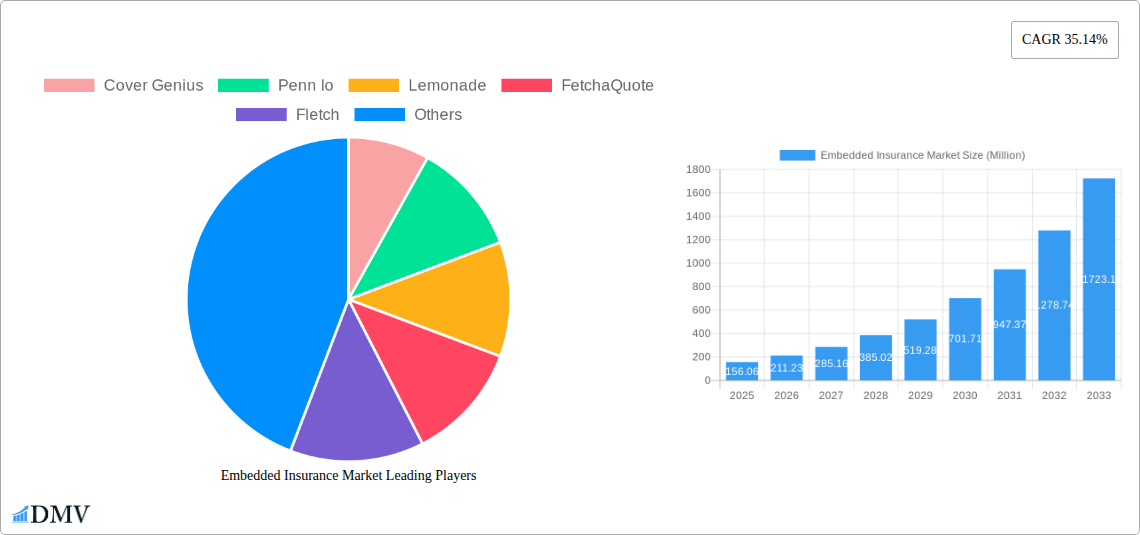
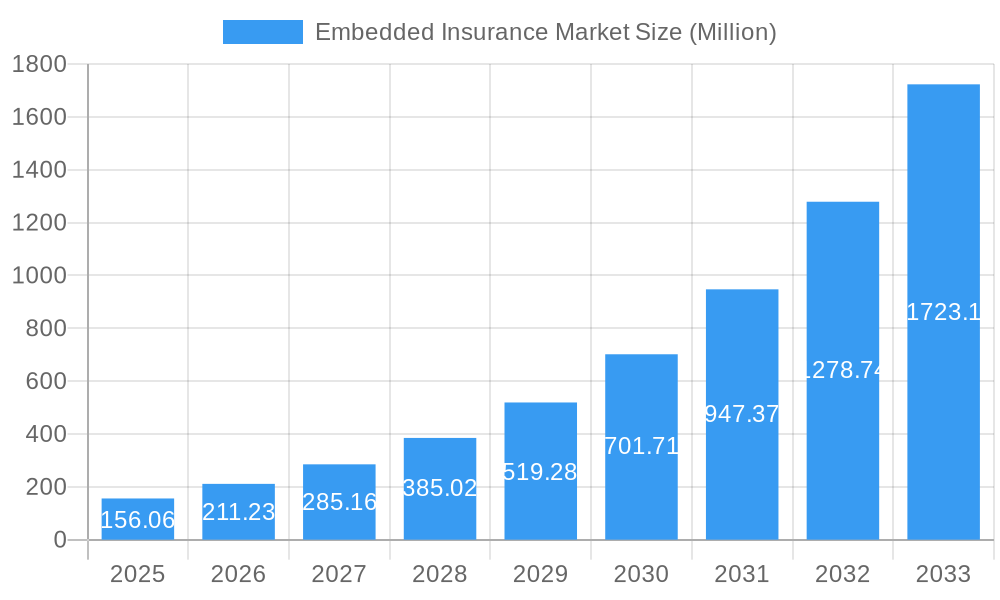
The embedded insurance market is experiencing explosive growth, projected to reach \$156.06 million in 2025 and exhibiting a remarkable Compound Annual Growth Rate (CAGR) of 35.14%. This surge is driven by several key factors. Firstly, the increasing integration of insurance products into various digital platforms and online services offers unparalleled convenience to consumers. Secondly, the rise of Insurtech companies is fostering innovation and creating more efficient, customer-centric insurance solutions. This trend is further amplified by the growing adoption of APIs and digital distribution channels, streamlining the purchase and management of insurance policies. Finally, a shift towards personalized insurance offerings, tailored to individual customer needs and risk profiles, fuels market expansion. This personalization reduces friction in the purchasing process and improves customer satisfaction.
Embedded Insurance Market Market Size (In Million)
Looking ahead, the market's trajectory is poised for continued robust expansion. Factors like the accelerating digital transformation across industries, enhanced customer experience through embedded insurance solutions, and the increasing adoption of data analytics for improved risk assessment will propel growth. While challenges such as regulatory complexities and potential security concerns related to data privacy exist, the overall market outlook remains overwhelmingly positive. The competitive landscape is dynamic, with a mix of established players like Assurant and Insurtech disruptors like Lemonade and Cover Genius vying for market share. This competition fosters innovation and fuels the ongoing evolution of embedded insurance products and services, leading to greater accessibility and affordability for consumers. The forecast period of 2025-2033 promises significant expansion, driven by the convergence of technological advancements and evolving customer expectations.
Embedded Insurance Market Company Market Share
Embedded Insurance Market: A Comprehensive Report (2019-2033)
This insightful report provides a detailed analysis of the Embedded Insurance Market, encompassing historical data (2019-2024), the current state (Base Year 2025, Estimated Year 2025), and future projections (Forecast Period: 2025-2033). It offers a 360° view, examining market trends, key players, growth drivers, and potential challenges, equipping stakeholders with the knowledge needed to navigate this rapidly evolving landscape. The market is projected to reach xx Million by 2033.
Embedded Insurance Market Composition & Trends
This section delves into the competitive dynamics of the Embedded Insurance market, analyzing market concentration, innovation drivers, regulatory landscapes, substitute products, and the evolving end-user profiles. We examine the impact of mergers and acquisitions (M&A) on market share distribution. The report includes detailed analysis of market concentration, revealing the share held by key players such as Cover Genius, Lemonade, and Bolttech. Further analysis details the influence of regulatory frameworks on market growth and the impact of substitute products on market penetration.
- Market Share Distribution: Analysis of market share amongst key players, including Cover Genius, Lemonade, and Bolttech. Data will showcase the distribution across different segments and geographic regions.
- M&A Activity: Examination of significant mergers and acquisitions, quantifying deal values in Millions, and analyzing their impact on market consolidation and innovation. For example, we analyze the impact of xx Million worth of M&A deals in 2024.
- Innovation Catalysts: Identification and analysis of technological advancements and innovative business models driving market growth, including AI-driven solutions and API integrations.
- Regulatory Landscape: A comprehensive assessment of existing and emerging regulations impacting the embedded insurance market globally and regionally, including their influence on market entry and competition.
- End-User Profiles: Detailed segmentation of end-users based on industry, size, and geographic location to understand distinct needs and preferences driving demand.
Embedded Insurance Market Industry Evolution
This section provides a comprehensive analysis of the Embedded Insurance Market's evolution, examining growth trajectories, technological advancements, and the shifting consumer demands that are reshaping the industry landscape. We analyze the increasing adoption of embedded insurance across various sectors, highlighting the drivers and impediments to growth. The report will incorporate specific data points, such as compound annual growth rates (CAGR) and adoption rates across different segments. The evolution of Insurtech and its role in market expansion will be comprehensively detailed. The report will showcase the significant shift from traditional insurance models to embedded insurance, analyzing both the reasons behind this shift and its long-term implications on the market. Data will provide insights into the growth from xx Million in 2019 to xx Million in 2024, with projections for continued growth.
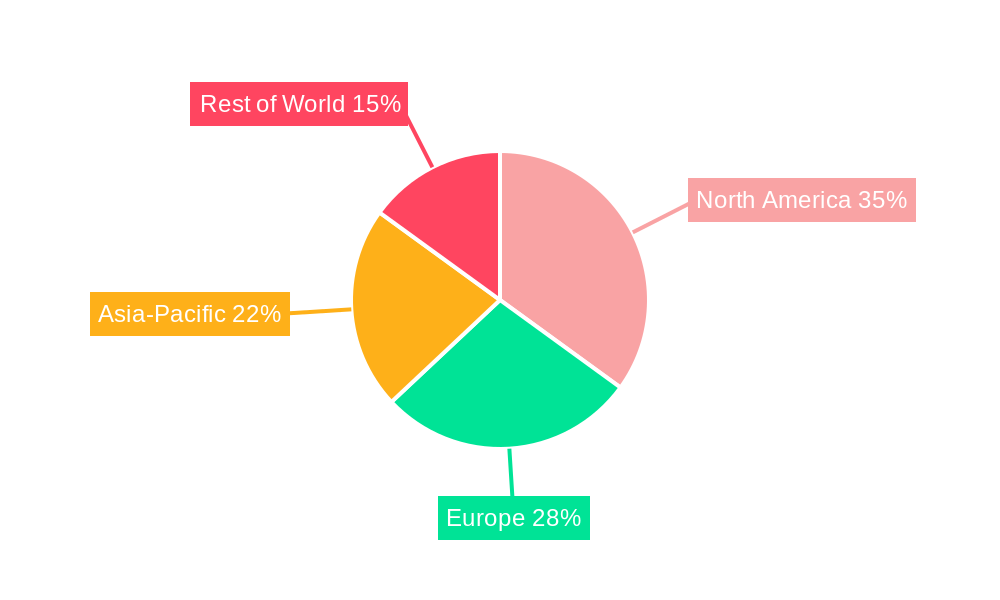
Leading Regions, Countries, or Segments in Embedded Insurance Market
This section identifies and analyzes the leading regions, countries, or segments within the Embedded Insurance market. A detailed examination of the factors driving the dominance of specific regions and segments will be provided. The section provides data-driven insights into market performance and growth potential in key regions.
- Key Drivers (Bullet Points):
- Favorable regulatory environments
- High levels of technological adoption
- Growing consumer demand
- Strategic government initiatives
- Significant investments in Insurtech
- In-depth Analysis (Paragraphs): A detailed explanation of how factors such as government regulations, technological advancements, and evolving consumer behavior contribute to regional dominance will be provided. For example, North America's leading position might be attributed to its advanced technological infrastructure and strong regulatory support for Insurtech innovation.
Embedded Insurance Market Product Innovations
This section highlights the latest product innovations, applications, and performance metrics in the embedded insurance market. We showcase the unique selling propositions and technological advancements that are driving market transformation. This includes a discussion of AI-powered risk assessment tools, seamless integration with digital platforms, and personalized insurance offerings. The analysis will highlight the impact of these innovations on customer experience, efficiency, and market competitiveness.
Propelling Factors for Embedded Insurance Market Growth
This section identifies and analyzes the key factors driving the growth of the Embedded Insurance market. These include technological advancements such as API-driven integrations, improving data analytics, and the rise of Insurtech. Economic factors, such as the increasing affordability of embedded insurance, and regulatory influences, such as supportive government policies, are also examined. Specific examples of these factors' impact will be provided.
Obstacles in the Embedded Insurance Market
This section discusses the barriers and restraints hindering the growth of the Embedded Insurance market. These include regulatory challenges related to data privacy and compliance, supply chain disruptions impacting the delivery of insurance products, and competitive pressures from established insurance providers. The quantifiable impacts of these obstacles on market growth will be assessed.
Future Opportunities in Embedded Insurance Market
This section highlights emerging opportunities in the Embedded Insurance market. These encompass the expansion into new markets (e.g., developing economies), the adoption of cutting-edge technologies (e.g., blockchain), and the emergence of novel consumer trends (e.g., demand for personalized insurance solutions).
Major Players in the Embedded Insurance Market Ecosystem
- Cover Genius
- Penn Io
- Lemonade
- FetchaQuote
- Fletch
- Bubble
- Companjon
- Rein
- Mulberri
- Qover
- Bolttech
- Igloo
- Assurant
- Bsurance
- Extend
- List Not Exhaustive
Key Developments in Embedded Insurance Market Industry
- November 2023: NJJ, a telecommunications conglomerate, collaborated with Bolttech, an Insurtech company, to offer mobile device insurance for mobile operators. This partnership expanded the reach of embedded insurance into the telecommunications sector, highlighting the potential for cross-industry collaborations.
- October 2023: Modives collaborated with Bindable aimed at introducing embedded insurance into their property segment. This collaboration demonstrates the increasing integration of insurance into non-traditional sectors.
Strategic Embedded Insurance Market Forecast
This section summarizes the growth catalysts identified in the report, emphasizing the future opportunities and market potential of embedded insurance. We forecast continued robust growth, driven by technological advancements, expanding market adoption, and the increasing demand for seamless and personalized insurance solutions. The market's potential for disruption and its capacity for significant expansion across various industries will be highlighted, emphasizing the long-term prospects for investors and stakeholders.
Embedded Insurance Market Segmentation
-
1. Insurance Line
- 1.1. Electronics
- 1.2. Furniture
- 1.3. Sports Equipment
- 1.4. Travel Insurance
- 1.5. Others
-
2. Channel
- 2.1. Online
- 2.2. Offline
Embedded Insurance Market Segmentation By Geography
-
1. North America
- 1.1. United States
- 1.2. Canada
-
2. Europe
- 2.1. United Kingdom
- 2.2. France
- 2.3. Italy
- 2.4. Spain
- 2.5. Rest of Europe
-
3. Asia Pacific
- 3.1. China
- 3.2. India
- 3.3. Japan
- 3.4. Rest of Asia Pacific
-
4. Latin America
- 4.1. Mexico
- 4.2. Brazil
- 4.3. Rest of Latin America
- 5. Middle East
-
6. United Arab Emirates
- 6.1. Saudi Arabia
- 6.2. South Africa
- 6.3. Rest of Middle East
Embedded Insurance Market Regional Market Share
Geographic Coverage of Embedded Insurance Market
Embedded Insurance Market REPORT HIGHLIGHTS
| Aspects | Details |
|---|---|
| Study Period | 2020-2034 |
| Base Year | 2025 |
| Estimated Year | 2026 |
| Forecast Period | 2026-2034 |
| Historical Period | 2020-2025 |
| Growth Rate | CAGR of 35.14% from 2020-2034 |
| Segmentation |
|
Table of Contents
- 1. Introduction
- 1.1. Research Scope
- 1.2. Market Segmentation
- 1.3. Research Objective
- 1.4. Definitions and Assumptions
- 2. Executive Summary
- 2.1. Market Snapshot
- 3. Market Dynamics
- 3.1. Market Drivers
- 3.2. Market Restrains
- 3.3. Market Trends
- 3.4. Market Opportunities
- 4. Market Factor Analysis
- 4.1. Porters Five Forces
- 4.1.1. Bargaining Power of Suppliers
- 4.1.2. Bargaining Power of Buyers
- 4.1.3. Threat of New Entrants
- 4.1.4. Threat of Substitutes
- 4.1.5. Competitive Rivalry
- 4.2. PESTEL analysis
- 4.3. BCG Analysis
- 4.3.1. Stars (High Growth, High Market Share)
- 4.3.2. Cash Cows (Low Growth, High Market Share)
- 4.3.3. Question Mark (High Growth, Low Market Share)
- 4.3.4. Dogs (Low Growth, Low Market Share)
- 4.4. Ansoff Matrix Analysis
- 4.5. Supply Chain Analysis
- 4.6. Regulatory Landscape
- 4.7. Current Market Potential and Opportunity Assessment (TAM–SAM–SOM Framework)
- 4.8. DMV Analyst Note
- 4.1. Porters Five Forces
- 5. Market Analysis, Insights and Forecast 2021-2033
- 5.1. Market Analysis, Insights and Forecast - by Insurance Line
- 5.1.1. Electronics
- 5.1.2. Furniture
- 5.1.3. Sports Equipment
- 5.1.4. Travel Insurance
- 5.1.5. Others
- 5.2. Market Analysis, Insights and Forecast - by Channel
- 5.2.1. Online
- 5.2.2. Offline
- 5.3. Market Analysis, Insights and Forecast - by Region
- 5.3.1. North America
- 5.3.2. Europe
- 5.3.3. Asia Pacific
- 5.3.4. Latin America
- 5.3.5. Middle East
- 5.3.6. United Arab Emirates
- 5.1. Market Analysis, Insights and Forecast - by Insurance Line
- 6. Global Embedded Insurance Market Analysis, Insights and Forecast, 2021-2033
- 6.1. Market Analysis, Insights and Forecast - by Insurance Line
- 6.1.1. Electronics
- 6.1.2. Furniture
- 6.1.3. Sports Equipment
- 6.1.4. Travel Insurance
- 6.1.5. Others
- 6.2. Market Analysis, Insights and Forecast - by Channel
- 6.2.1. Online
- 6.2.2. Offline
- 6.1. Market Analysis, Insights and Forecast - by Insurance Line
- 7. North America Embedded Insurance Market Analysis, Insights and Forecast, 2020-2032
- 7.1. Market Analysis, Insights and Forecast - by Insurance Line
- 7.1.1. Electronics
- 7.1.2. Furniture
- 7.1.3. Sports Equipment
- 7.1.4. Travel Insurance
- 7.1.5. Others
- 7.2. Market Analysis, Insights and Forecast - by Channel
- 7.2.1. Online
- 7.2.2. Offline
- 7.1. Market Analysis, Insights and Forecast - by Insurance Line
- 8. Europe Embedded Insurance Market Analysis, Insights and Forecast, 2020-2032
- 8.1. Market Analysis, Insights and Forecast - by Insurance Line
- 8.1.1. Electronics
- 8.1.2. Furniture
- 8.1.3. Sports Equipment
- 8.1.4. Travel Insurance
- 8.1.5. Others
- 8.2. Market Analysis, Insights and Forecast - by Channel
- 8.2.1. Online
- 8.2.2. Offline
- 8.1. Market Analysis, Insights and Forecast - by Insurance Line
- 9. Asia Pacific Embedded Insurance Market Analysis, Insights and Forecast, 2020-2032
- 9.1. Market Analysis, Insights and Forecast - by Insurance Line
- 9.1.1. Electronics
- 9.1.2. Furniture
- 9.1.3. Sports Equipment
- 9.1.4. Travel Insurance
- 9.1.5. Others
- 9.2. Market Analysis, Insights and Forecast - by Channel
- 9.2.1. Online
- 9.2.2. Offline
- 9.1. Market Analysis, Insights and Forecast - by Insurance Line
- 10. Latin America Embedded Insurance Market Analysis, Insights and Forecast, 2020-2032
- 10.1. Market Analysis, Insights and Forecast - by Insurance Line
- 10.1.1. Electronics
- 10.1.2. Furniture
- 10.1.3. Sports Equipment
- 10.1.4. Travel Insurance
- 10.1.5. Others
- 10.2. Market Analysis, Insights and Forecast - by Channel
- 10.2.1. Online
- 10.2.2. Offline
- 10.1. Market Analysis, Insights and Forecast - by Insurance Line
- 11. Middle East Embedded Insurance Market Analysis, Insights and Forecast, 2020-2032
- 11.1. Market Analysis, Insights and Forecast - by Insurance Line
- 11.1.1. Electronics
- 11.1.2. Furniture
- 11.1.3. Sports Equipment
- 11.1.4. Travel Insurance
- 11.1.5. Others
- 11.2. Market Analysis, Insights and Forecast - by Channel
- 11.2.1. Online
- 11.2.2. Offline
- 11.1. Market Analysis, Insights and Forecast - by Insurance Line
- 12. United Arab Emirates Embedded Insurance Market Analysis, Insights and Forecast, 2020-2032
- 12.1. Market Analysis, Insights and Forecast - by Insurance Line
- 12.1.1. Electronics
- 12.1.2. Furniture
- 12.1.3. Sports Equipment
- 12.1.4. Travel Insurance
- 12.1.5. Others
- 12.2. Market Analysis, Insights and Forecast - by Channel
- 12.2.1. Online
- 12.2.2. Offline
- 12.1. Market Analysis, Insights and Forecast - by Insurance Line
- 13. Competitive Analysis
- 13.1. Company Profiles
- 13.1.1 Cover Genius
- 13.1.1.1. Company Overview
- 13.1.1.2. Products
- 13.1.1.3. Company Financials
- 13.1.1.4. SWOT Analysis
- 13.1.2 Penn Io
- 13.1.2.1. Company Overview
- 13.1.2.2. Products
- 13.1.2.3. Company Financials
- 13.1.2.4. SWOT Analysis
- 13.1.3 Lemonade
- 13.1.3.1. Company Overview
- 13.1.3.2. Products
- 13.1.3.3. Company Financials
- 13.1.3.4. SWOT Analysis
- 13.1.4 FetchaQuote
- 13.1.4.1. Company Overview
- 13.1.4.2. Products
- 13.1.4.3. Company Financials
- 13.1.4.4. SWOT Analysis
- 13.1.5 Fletch
- 13.1.5.1. Company Overview
- 13.1.5.2. Products
- 13.1.5.3. Company Financials
- 13.1.5.4. SWOT Analysis
- 13.1.6 Bubble
- 13.1.6.1. Company Overview
- 13.1.6.2. Products
- 13.1.6.3. Company Financials
- 13.1.6.4. SWOT Analysis
- 13.1.7 Companjon
- 13.1.7.1. Company Overview
- 13.1.7.2. Products
- 13.1.7.3. Company Financials
- 13.1.7.4. SWOT Analysis
- 13.1.8 Rein
- 13.1.8.1. Company Overview
- 13.1.8.2. Products
- 13.1.8.3. Company Financials
- 13.1.8.4. SWOT Analysis
- 13.1.9 Mulberri
- 13.1.9.1. Company Overview
- 13.1.9.2. Products
- 13.1.9.3. Company Financials
- 13.1.9.4. SWOT Analysis
- 13.1.10 Qover
- 13.1.10.1. Company Overview
- 13.1.10.2. Products
- 13.1.10.3. Company Financials
- 13.1.10.4. SWOT Analysis
- 13.1.11 Bolttech
- 13.1.11.1. Company Overview
- 13.1.11.2. Products
- 13.1.11.3. Company Financials
- 13.1.11.4. SWOT Analysis
- 13.1.12 Igloo
- 13.1.12.1. Company Overview
- 13.1.12.2. Products
- 13.1.12.3. Company Financials
- 13.1.12.4. SWOT Analysis
- 13.1.13 Assurant
- 13.1.13.1. Company Overview
- 13.1.13.2. Products
- 13.1.13.3. Company Financials
- 13.1.13.4. SWOT Analysis
- 13.1.14 Bsurance
- 13.1.14.1. Company Overview
- 13.1.14.2. Products
- 13.1.14.3. Company Financials
- 13.1.14.4. SWOT Analysis
- 13.1.15 Extend**List Not Exhaustive
- 13.1.15.1. Company Overview
- 13.1.15.2. Products
- 13.1.15.3. Company Financials
- 13.1.15.4. SWOT Analysis
- 13.1.1 Cover Genius
- 13.2. Market Entropy
- 13.2.1 Company's Key Areas Served
- 13.2.2 Recent Developments
- 13.3. Company Market Share Analysis 2025
- 13.3.1 Top 5 Companies Market Share Analysis
- 13.3.2 Top 3 Companies Market Share Analysis
- 13.4. List of Potential Customers
- 14. Research Methodology
List of Figures
- Figure 1: Global Embedded Insurance Market Revenue Breakdown (Million, %) by Region 2025 & 2033
- Figure 2: Global Embedded Insurance Market Volume Breakdown (Billion, %) by Region 2025 & 2033
- Figure 3: North America Embedded Insurance Market Revenue (Million), by Insurance Line 2025 & 2033
- Figure 4: North America Embedded Insurance Market Volume (Billion), by Insurance Line 2025 & 2033
- Figure 5: North America Embedded Insurance Market Revenue Share (%), by Insurance Line 2025 & 2033
- Figure 6: North America Embedded Insurance Market Volume Share (%), by Insurance Line 2025 & 2033
- Figure 7: North America Embedded Insurance Market Revenue (Million), by Channel 2025 & 2033
- Figure 8: North America Embedded Insurance Market Volume (Billion), by Channel 2025 & 2033
- Figure 9: North America Embedded Insurance Market Revenue Share (%), by Channel 2025 & 2033
- Figure 10: North America Embedded Insurance Market Volume Share (%), by Channel 2025 & 2033
- Figure 11: North America Embedded Insurance Market Revenue (Million), by Country 2025 & 2033
- Figure 12: North America Embedded Insurance Market Volume (Billion), by Country 2025 & 2033
- Figure 13: North America Embedded Insurance Market Revenue Share (%), by Country 2025 & 2033
- Figure 14: North America Embedded Insurance Market Volume Share (%), by Country 2025 & 2033
- Figure 15: Europe Embedded Insurance Market Revenue (Million), by Insurance Line 2025 & 2033
- Figure 16: Europe Embedded Insurance Market Volume (Billion), by Insurance Line 2025 & 2033
- Figure 17: Europe Embedded Insurance Market Revenue Share (%), by Insurance Line 2025 & 2033
- Figure 18: Europe Embedded Insurance Market Volume Share (%), by Insurance Line 2025 & 2033
- Figure 19: Europe Embedded Insurance Market Revenue (Million), by Channel 2025 & 2033
- Figure 20: Europe Embedded Insurance Market Volume (Billion), by Channel 2025 & 2033
- Figure 21: Europe Embedded Insurance Market Revenue Share (%), by Channel 2025 & 2033
- Figure 22: Europe Embedded Insurance Market Volume Share (%), by Channel 2025 & 2033
- Figure 23: Europe Embedded Insurance Market Revenue (Million), by Country 2025 & 2033
- Figure 24: Europe Embedded Insurance Market Volume (Billion), by Country 2025 & 2033
- Figure 25: Europe Embedded Insurance Market Revenue Share (%), by Country 2025 & 2033
- Figure 26: Europe Embedded Insurance Market Volume Share (%), by Country 2025 & 2033
- Figure 27: Asia Pacific Embedded Insurance Market Revenue (Million), by Insurance Line 2025 & 2033
- Figure 28: Asia Pacific Embedded Insurance Market Volume (Billion), by Insurance Line 2025 & 2033
- Figure 29: Asia Pacific Embedded Insurance Market Revenue Share (%), by Insurance Line 2025 & 2033
- Figure 30: Asia Pacific Embedded Insurance Market Volume Share (%), by Insurance Line 2025 & 2033
- Figure 31: Asia Pacific Embedded Insurance Market Revenue (Million), by Channel 2025 & 2033
- Figure 32: Asia Pacific Embedded Insurance Market Volume (Billion), by Channel 2025 & 2033
- Figure 33: Asia Pacific Embedded Insurance Market Revenue Share (%), by Channel 2025 & 2033
- Figure 34: Asia Pacific Embedded Insurance Market Volume Share (%), by Channel 2025 & 2033
- Figure 35: Asia Pacific Embedded Insurance Market Revenue (Million), by Country 2025 & 2033
- Figure 36: Asia Pacific Embedded Insurance Market Volume (Billion), by Country 2025 & 2033
- Figure 37: Asia Pacific Embedded Insurance Market Revenue Share (%), by Country 2025 & 2033
- Figure 38: Asia Pacific Embedded Insurance Market Volume Share (%), by Country 2025 & 2033
- Figure 39: Latin America Embedded Insurance Market Revenue (Million), by Insurance Line 2025 & 2033
- Figure 40: Latin America Embedded Insurance Market Volume (Billion), by Insurance Line 2025 & 2033
- Figure 41: Latin America Embedded Insurance Market Revenue Share (%), by Insurance Line 2025 & 2033
- Figure 42: Latin America Embedded Insurance Market Volume Share (%), by Insurance Line 2025 & 2033
- Figure 43: Latin America Embedded Insurance Market Revenue (Million), by Channel 2025 & 2033
- Figure 44: Latin America Embedded Insurance Market Volume (Billion), by Channel 2025 & 2033
- Figure 45: Latin America Embedded Insurance Market Revenue Share (%), by Channel 2025 & 2033
- Figure 46: Latin America Embedded Insurance Market Volume Share (%), by Channel 2025 & 2033
- Figure 47: Latin America Embedded Insurance Market Revenue (Million), by Country 2025 & 2033
- Figure 48: Latin America Embedded Insurance Market Volume (Billion), by Country 2025 & 2033
- Figure 49: Latin America Embedded Insurance Market Revenue Share (%), by Country 2025 & 2033
- Figure 50: Latin America Embedded Insurance Market Volume Share (%), by Country 2025 & 2033
- Figure 51: Middle East Embedded Insurance Market Revenue (Million), by Insurance Line 2025 & 2033
- Figure 52: Middle East Embedded Insurance Market Volume (Billion), by Insurance Line 2025 & 2033
- Figure 53: Middle East Embedded Insurance Market Revenue Share (%), by Insurance Line 2025 & 2033
- Figure 54: Middle East Embedded Insurance Market Volume Share (%), by Insurance Line 2025 & 2033
- Figure 55: Middle East Embedded Insurance Market Revenue (Million), by Channel 2025 & 2033
- Figure 56: Middle East Embedded Insurance Market Volume (Billion), by Channel 2025 & 2033
- Figure 57: Middle East Embedded Insurance Market Revenue Share (%), by Channel 2025 & 2033
- Figure 58: Middle East Embedded Insurance Market Volume Share (%), by Channel 2025 & 2033
- Figure 59: Middle East Embedded Insurance Market Revenue (Million), by Country 2025 & 2033
- Figure 60: Middle East Embedded Insurance Market Volume (Billion), by Country 2025 & 2033
- Figure 61: Middle East Embedded Insurance Market Revenue Share (%), by Country 2025 & 2033
- Figure 62: Middle East Embedded Insurance Market Volume Share (%), by Country 2025 & 2033
- Figure 63: United Arab Emirates Embedded Insurance Market Revenue (Million), by Insurance Line 2025 & 2033
- Figure 64: United Arab Emirates Embedded Insurance Market Volume (Billion), by Insurance Line 2025 & 2033
- Figure 65: United Arab Emirates Embedded Insurance Market Revenue Share (%), by Insurance Line 2025 & 2033
- Figure 66: United Arab Emirates Embedded Insurance Market Volume Share (%), by Insurance Line 2025 & 2033
- Figure 67: United Arab Emirates Embedded Insurance Market Revenue (Million), by Channel 2025 & 2033
- Figure 68: United Arab Emirates Embedded Insurance Market Volume (Billion), by Channel 2025 & 2033
- Figure 69: United Arab Emirates Embedded Insurance Market Revenue Share (%), by Channel 2025 & 2033
- Figure 70: United Arab Emirates Embedded Insurance Market Volume Share (%), by Channel 2025 & 2033
- Figure 71: United Arab Emirates Embedded Insurance Market Revenue (Million), by Country 2025 & 2033
- Figure 72: United Arab Emirates Embedded Insurance Market Volume (Billion), by Country 2025 & 2033
- Figure 73: United Arab Emirates Embedded Insurance Market Revenue Share (%), by Country 2025 & 2033
- Figure 74: United Arab Emirates Embedded Insurance Market Volume Share (%), by Country 2025 & 2033
List of Tables
- Table 1: Global Embedded Insurance Market Revenue Million Forecast, by Insurance Line 2020 & 2033
- Table 2: Global Embedded Insurance Market Volume Billion Forecast, by Insurance Line 2020 & 2033
- Table 3: Global Embedded Insurance Market Revenue Million Forecast, by Channel 2020 & 2033
- Table 4: Global Embedded Insurance Market Volume Billion Forecast, by Channel 2020 & 2033
- Table 5: Global Embedded Insurance Market Revenue Million Forecast, by Region 2020 & 2033
- Table 6: Global Embedded Insurance Market Volume Billion Forecast, by Region 2020 & 2033
- Table 7: Global Embedded Insurance Market Revenue Million Forecast, by Insurance Line 2020 & 2033
- Table 8: Global Embedded Insurance Market Volume Billion Forecast, by Insurance Line 2020 & 2033
- Table 9: Global Embedded Insurance Market Revenue Million Forecast, by Channel 2020 & 2033
- Table 10: Global Embedded Insurance Market Volume Billion Forecast, by Channel 2020 & 2033
- Table 11: Global Embedded Insurance Market Revenue Million Forecast, by Country 2020 & 2033
- Table 12: Global Embedded Insurance Market Volume Billion Forecast, by Country 2020 & 2033
- Table 13: United States Embedded Insurance Market Revenue (Million) Forecast, by Application 2020 & 2033
- Table 14: United States Embedded Insurance Market Volume (Billion) Forecast, by Application 2020 & 2033
- Table 15: Canada Embedded Insurance Market Revenue (Million) Forecast, by Application 2020 & 2033
- Table 16: Canada Embedded Insurance Market Volume (Billion) Forecast, by Application 2020 & 2033
- Table 17: Global Embedded Insurance Market Revenue Million Forecast, by Insurance Line 2020 & 2033
- Table 18: Global Embedded Insurance Market Volume Billion Forecast, by Insurance Line 2020 & 2033
- Table 19: Global Embedded Insurance Market Revenue Million Forecast, by Channel 2020 & 2033
- Table 20: Global Embedded Insurance Market Volume Billion Forecast, by Channel 2020 & 2033
- Table 21: Global Embedded Insurance Market Revenue Million Forecast, by Country 2020 & 2033
- Table 22: Global Embedded Insurance Market Volume Billion Forecast, by Country 2020 & 2033
- Table 23: United Kingdom Embedded Insurance Market Revenue (Million) Forecast, by Application 2020 & 2033
- Table 24: United Kingdom Embedded Insurance Market Volume (Billion) Forecast, by Application 2020 & 2033
- Table 25: France Embedded Insurance Market Revenue (Million) Forecast, by Application 2020 & 2033
- Table 26: France Embedded Insurance Market Volume (Billion) Forecast, by Application 2020 & 2033
- Table 27: Italy Embedded Insurance Market Revenue (Million) Forecast, by Application 2020 & 2033
- Table 28: Italy Embedded Insurance Market Volume (Billion) Forecast, by Application 2020 & 2033
- Table 29: Spain Embedded Insurance Market Revenue (Million) Forecast, by Application 2020 & 2033
- Table 30: Spain Embedded Insurance Market Volume (Billion) Forecast, by Application 2020 & 2033
- Table 31: Rest of Europe Embedded Insurance Market Revenue (Million) Forecast, by Application 2020 & 2033
- Table 32: Rest of Europe Embedded Insurance Market Volume (Billion) Forecast, by Application 2020 & 2033
- Table 33: Global Embedded Insurance Market Revenue Million Forecast, by Insurance Line 2020 & 2033
- Table 34: Global Embedded Insurance Market Volume Billion Forecast, by Insurance Line 2020 & 2033
- Table 35: Global Embedded Insurance Market Revenue Million Forecast, by Channel 2020 & 2033
- Table 36: Global Embedded Insurance Market Volume Billion Forecast, by Channel 2020 & 2033
- Table 37: Global Embedded Insurance Market Revenue Million Forecast, by Country 2020 & 2033
- Table 38: Global Embedded Insurance Market Volume Billion Forecast, by Country 2020 & 2033
- Table 39: China Embedded Insurance Market Revenue (Million) Forecast, by Application 2020 & 2033
- Table 40: China Embedded Insurance Market Volume (Billion) Forecast, by Application 2020 & 2033
- Table 41: India Embedded Insurance Market Revenue (Million) Forecast, by Application 2020 & 2033
- Table 42: India Embedded Insurance Market Volume (Billion) Forecast, by Application 2020 & 2033
- Table 43: Japan Embedded Insurance Market Revenue (Million) Forecast, by Application 2020 & 2033
- Table 44: Japan Embedded Insurance Market Volume (Billion) Forecast, by Application 2020 & 2033
- Table 45: Rest of Asia Pacific Embedded Insurance Market Revenue (Million) Forecast, by Application 2020 & 2033
- Table 46: Rest of Asia Pacific Embedded Insurance Market Volume (Billion) Forecast, by Application 2020 & 2033
- Table 47: Global Embedded Insurance Market Revenue Million Forecast, by Insurance Line 2020 & 2033
- Table 48: Global Embedded Insurance Market Volume Billion Forecast, by Insurance Line 2020 & 2033
- Table 49: Global Embedded Insurance Market Revenue Million Forecast, by Channel 2020 & 2033
- Table 50: Global Embedded Insurance Market Volume Billion Forecast, by Channel 2020 & 2033
- Table 51: Global Embedded Insurance Market Revenue Million Forecast, by Country 2020 & 2033
- Table 52: Global Embedded Insurance Market Volume Billion Forecast, by Country 2020 & 2033
- Table 53: Mexico Embedded Insurance Market Revenue (Million) Forecast, by Application 2020 & 2033
- Table 54: Mexico Embedded Insurance Market Volume (Billion) Forecast, by Application 2020 & 2033
- Table 55: Brazil Embedded Insurance Market Revenue (Million) Forecast, by Application 2020 & 2033
- Table 56: Brazil Embedded Insurance Market Volume (Billion) Forecast, by Application 2020 & 2033
- Table 57: Rest of Latin America Embedded Insurance Market Revenue (Million) Forecast, by Application 2020 & 2033
- Table 58: Rest of Latin America Embedded Insurance Market Volume (Billion) Forecast, by Application 2020 & 2033
- Table 59: Global Embedded Insurance Market Revenue Million Forecast, by Insurance Line 2020 & 2033
- Table 60: Global Embedded Insurance Market Volume Billion Forecast, by Insurance Line 2020 & 2033
- Table 61: Global Embedded Insurance Market Revenue Million Forecast, by Channel 2020 & 2033
- Table 62: Global Embedded Insurance Market Volume Billion Forecast, by Channel 2020 & 2033
- Table 63: Global Embedded Insurance Market Revenue Million Forecast, by Country 2020 & 2033
- Table 64: Global Embedded Insurance Market Volume Billion Forecast, by Country 2020 & 2033
- Table 65: Global Embedded Insurance Market Revenue Million Forecast, by Insurance Line 2020 & 2033
- Table 66: Global Embedded Insurance Market Volume Billion Forecast, by Insurance Line 2020 & 2033
- Table 67: Global Embedded Insurance Market Revenue Million Forecast, by Channel 2020 & 2033
- Table 68: Global Embedded Insurance Market Volume Billion Forecast, by Channel 2020 & 2033
- Table 69: Global Embedded Insurance Market Revenue Million Forecast, by Country 2020 & 2033
- Table 70: Global Embedded Insurance Market Volume Billion Forecast, by Country 2020 & 2033
- Table 71: Saudi Arabia Embedded Insurance Market Revenue (Million) Forecast, by Application 2020 & 2033
- Table 72: Saudi Arabia Embedded Insurance Market Volume (Billion) Forecast, by Application 2020 & 2033
- Table 73: South Africa Embedded Insurance Market Revenue (Million) Forecast, by Application 2020 & 2033
- Table 74: South Africa Embedded Insurance Market Volume (Billion) Forecast, by Application 2020 & 2033
- Table 75: Rest of Middle East Embedded Insurance Market Revenue (Million) Forecast, by Application 2020 & 2033
- Table 76: Rest of Middle East Embedded Insurance Market Volume (Billion) Forecast, by Application 2020 & 2033
Frequently Asked Questions
1. What is the projected Compound Annual Growth Rate (CAGR) of the Embedded Insurance Market?
The projected CAGR is approximately 35.14%.
2. Which companies are prominent players in the Embedded Insurance Market?
Key companies in the market include Cover Genius, Penn Io, Lemonade, FetchaQuote, Fletch, Bubble, Companjon, Rein, Mulberri, Qover, Bolttech, Igloo, Assurant, Bsurance, Extend**List Not Exhaustive.
3. What are the main segments of the Embedded Insurance Market?
The market segments include Insurance Line, Channel.
4. Can you provide details about the market size?
The market size is estimated to be USD 156.06 Million as of 2022.
5. What are some drivers contributing to market growth?
N/A
6. What are the notable trends driving market growth?
Increasing Life Insurance Premiums is Fuelling the Market.
7. Are there any restraints impacting market growth?
N/A
8. Can you provide examples of recent developments in the market?
November 2023: NJJ, a telecommunications conglomerate, collaborated with Bolttech, an Insurtech company, to offer mobile device insurance for mobile operators.
9. What pricing options are available for accessing the report?
Pricing options include single-user, multi-user, and enterprise licenses priced at USD 4750, USD 5250, and USD 8750 respectively.
10. Is the market size provided in terms of value or volume?
The market size is provided in terms of value, measured in Million and volume, measured in Billion.
11. Are there any specific market keywords associated with the report?
Yes, the market keyword associated with the report is "Embedded Insurance Market," which aids in identifying and referencing the specific market segment covered.
12. How do I determine which pricing option suits my needs best?
The pricing options vary based on user requirements and access needs. Individual users may opt for single-user licenses, while businesses requiring broader access may choose multi-user or enterprise licenses for cost-effective access to the report.
13. Are there any additional resources or data provided in the Embedded Insurance Market report?
While the report offers comprehensive insights, it's advisable to review the specific contents or supplementary materials provided to ascertain if additional resources or data are available.
14. How can I stay updated on further developments or reports in the Embedded Insurance Market?
To stay informed about further developments, trends, and reports in the Embedded Insurance Market, consider subscribing to industry newsletters, following relevant companies and organizations, or regularly checking reputable industry news sources and publications.
Methodology
Step 1 - Identification of Relevant Samples Size from Population Database


Step 2 - Approaches for Defining Global Market Size (Value, Volume* & Price*)

Note*: In applicable scenarios
Step 3 - Data Sources
Primary Research
- Web Analytics
- Survey Reports
- Research Institute
- Latest Research Reports
- Opinion Leaders
Secondary Research
- Annual Reports
- White Paper
- Latest Press Release
- Industry Association
- Paid Database
- Investor Presentations

Step 4 - Data Triangulation
Involves using different sources of information in order to increase the validity of a study
These sources are likely to be stakeholders in a program - participants, other researchers, program staff, other community members, and so on.
Then we put all data in single framework & apply various statistical tools to find out the dynamic on the market.
During the analysis stage, feedback from the stakeholder groups would be compared to determine areas of agreement as well as areas of divergence