

Key Insights
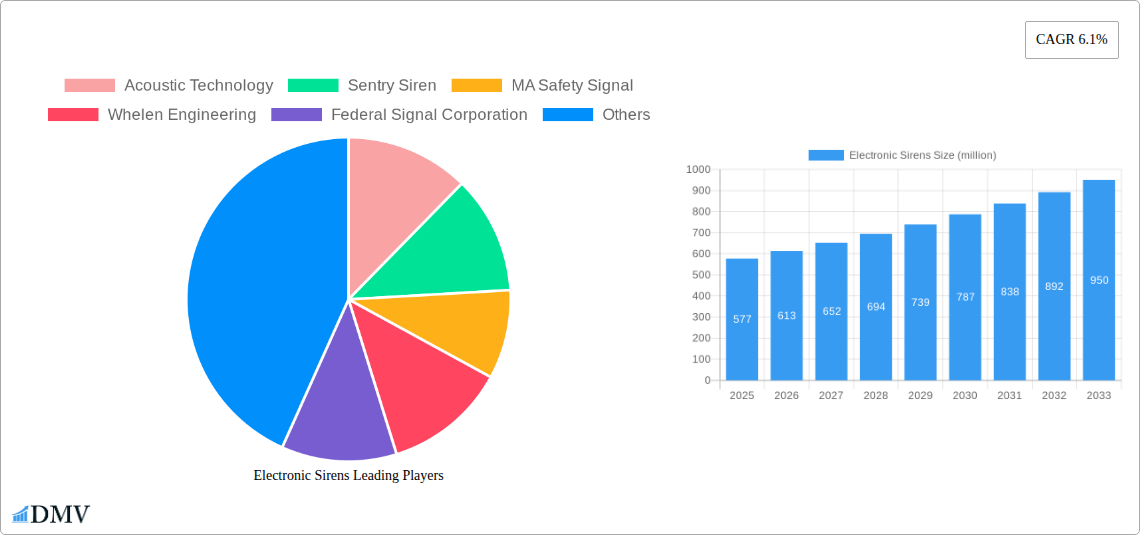
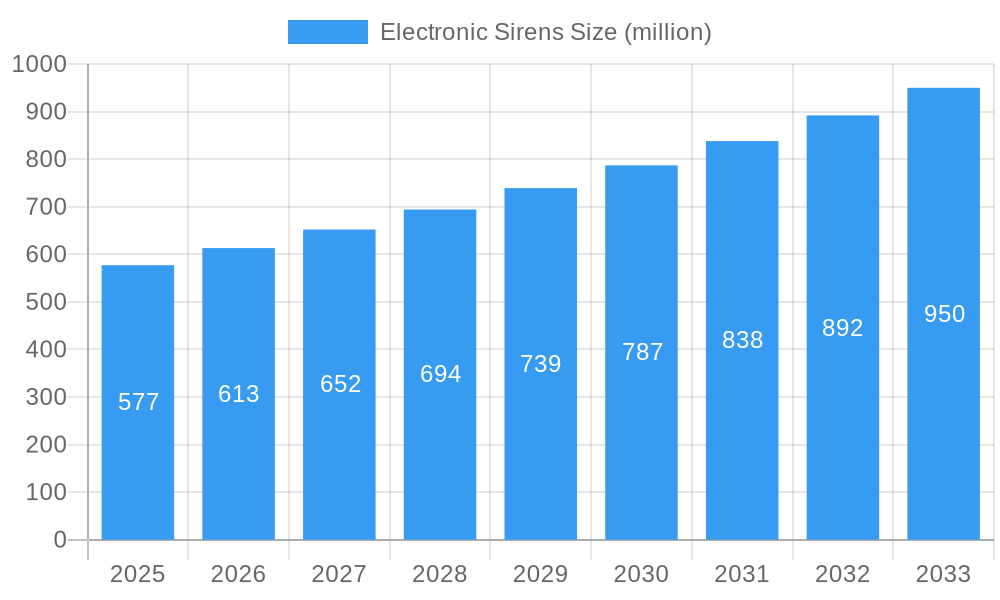
The global electronic sirens market, valued at $577 million in 2025, is projected to experience robust growth, driven by increasing demand for enhanced safety and security systems across diverse sectors. The compound annual growth rate (CAGR) of 6.1% from 2025 to 2033 indicates a significant expansion, fueled by several key factors. Rising urbanization and the consequent need for effective emergency warning systems in densely populated areas are primary drivers. Furthermore, advancements in siren technology, including the integration of sophisticated features like remote monitoring and control, GPS tracking, and improved sound projection capabilities, are boosting market adoption. The growing adoption of smart city initiatives globally further contributes to market expansion, as these initiatives often prioritize robust public safety infrastructure. Stringent safety regulations across various industries, particularly in manufacturing, construction, and transportation, also mandate the use of reliable electronic sirens. While challenges such as high initial investment costs and potential maintenance complexities exist, the overall market outlook remains positive.
Electronic Sirens Market Size (In Million)
The market segmentation is likely diverse, encompassing various siren types based on power source (battery-powered, AC-powered), frequency, sound level, and application (industrial, emergency services, automotive). Leading players such as Acoustic Technology, Sentry Siren, MA Safety Signal, Whelen Engineering, Federal Signal Corporation, B & M Siren Manufacturing, Projects Unlimited, Phoenix Contact, Mallory Sonalert Products, and QlightUSA are vying for market share, employing competitive strategies such as product innovation, strategic partnerships, and geographic expansion. Future growth will likely be influenced by technological innovations focused on improving energy efficiency, extending operational lifespan, and enhancing siren performance in challenging environments. Government initiatives promoting safer infrastructure and increased public safety awareness will also play a crucial role in shaping market dynamics during the forecast period.
Electronic Sirens Company Market Share
Electronic Sirens Market Report: A Comprehensive Analysis (2019-2033)
This insightful report delivers a comprehensive analysis of the global Electronic Sirens market, projecting a market value exceeding $XX million by 2033. The study covers the period 2019-2033, with 2025 serving as the base and estimated year. This in-depth examination unveils key trends, growth drivers, and challenges shaping this dynamic sector, providing stakeholders with actionable intelligence for strategic decision-making. The report leverages rigorous research methodologies and incorporates data from numerous sources, including financial statements, industry publications, and expert interviews, to provide a precise and reliable forecast.
Electronic Sirens Market Composition & Trends
This section dissects the competitive landscape, analyzing market concentration, innovation, regulation, substitution, end-user profiles, and mergers & acquisitions (M&A). The market is moderately concentrated, with key players including Acoustic Technology, Sentry Siren, MA Safety Signal, Whelen Engineering, Federal Signal Corporation, B & M Siren Manufacturing, Projects Unlimited, Phoenix Contact, Mallory Sonalert Products, and QlightUSA holding a combined market share of approximately 60% in 2025.
- Market Share Distribution (2025): Whelen Engineering (20%), Federal Signal Corporation (18%), Acoustic Technology (12%), Sentry Siren (8%), Others (42%).
- Innovation Catalysts: Advancements in microcontroller technology, miniaturization, and wireless connectivity are driving product innovation.
- Regulatory Landscape: Stringent safety and environmental regulations, varying by region, influence product design and adoption.
- Substitute Products: Alternative warning systems, such as visual signaling devices, pose a limited threat due to electronic sirens' superior audibility and versatility.
- End-User Profiles: The primary end-users include emergency services (police, fire, ambulance), industrial facilities, construction sites, and transportation systems. Demand is largely driven by safety concerns and regulatory requirements.
- M&A Activities: Over the historical period (2019-2024), a total of xx M&A deals involving electronic siren companies were recorded, with a combined value of approximately $xx million. Consolidation is expected to continue, driven by economies of scale and technological integration.
Electronic Sirens Industry Evolution
This section explores the evolution of the electronic sirens market, analyzing growth trajectories, technological advancements, and shifting consumer demands. The market has witnessed consistent growth over the historical period (2019-2024), with a Compound Annual Growth Rate (CAGR) of xx%. This growth is largely attributed to increasing urbanization, stricter safety regulations, and rising demand for advanced warning systems across various sectors. Technological advancements, such as the integration of GPS, improved sound projection, and smart connectivity features, have further fueled market expansion. Consumer demand is shifting towards more energy-efficient, reliable, and versatile siren systems with enhanced features, prompting manufacturers to continually innovate. The forecast period (2025-2033) projects a CAGR of xx%, driven by the continued adoption of smart city initiatives and increasing investments in infrastructure development globally.
Leading Regions, Countries, or Segments in Electronic Sirens
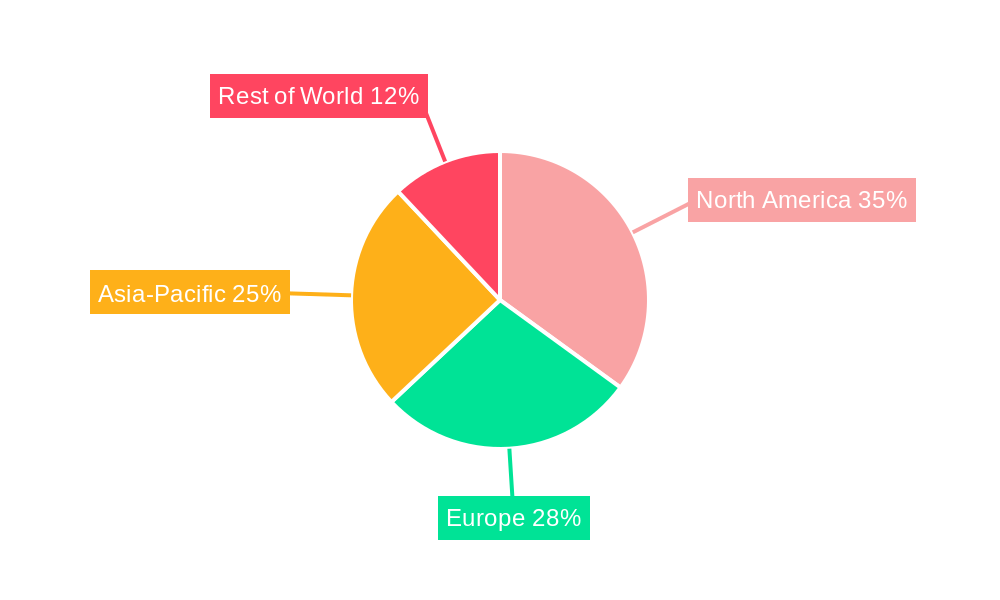
North America currently dominates the global electronic sirens market, driven by strong demand from the emergency services sector and stringent safety regulations. Europe follows closely, with significant market penetration in developed countries. The Asia-Pacific region demonstrates promising growth potential, fueled by rapid urbanization and infrastructure development.
- Key Drivers for North American Dominance:
- High adoption of advanced warning systems in emergency services.
- Stringent safety regulations and compliance requirements.
- Significant investments in public safety infrastructure.
- Established presence of major electronic siren manufacturers.
The dominance is primarily attributed to factors such as higher per capita income, greater awareness of safety regulations, and a more established presence of major manufacturers. Government initiatives promoting public safety and infrastructure development in North America also contribute significantly. However, the Asia-Pacific region exhibits substantial growth potential driven by rapid industrialization and expanding urban populations.
Electronic Sirens Product Innovations
Recent years have witnessed significant innovation in electronic siren technology, including the introduction of multi-tone sirens offering enhanced sound projection and clarity, integration of GPS for precise location tracking, and wireless connectivity for remote monitoring and control. Miniaturization efforts have led to smaller, more compact sirens, suitable for diverse applications. These advancements cater to the growing demand for improved safety and operational efficiency. Key selling propositions include enhanced audibility, durability, versatility, and integration with smart city infrastructure.
Propelling Factors for Electronic Sirens Growth
Several factors are propelling the growth of the electronic sirens market. Firstly, the increasing urbanization and population density worldwide necessitate advanced warning systems to ensure public safety and minimize the impact of emergencies. Secondly, stringent safety regulations implemented by governments globally are driving the adoption of electronic sirens across various sectors. Finally, technological advancements, such as the integration of GPS and smart connectivity features, are enhancing the functionalities and capabilities of electronic sirens, increasing their market appeal.
Obstacles in the Electronic Sirens Market
The electronic sirens market faces certain obstacles. Supply chain disruptions, particularly concerning raw materials and semiconductor components, can lead to production delays and cost increases. Furthermore, intense competition among numerous manufacturers necessitates continuous innovation and cost optimization to maintain market share. Finally, varying regulatory landscapes across different regions can increase compliance costs and complexity for manufacturers.
Future Opportunities in Electronic Sirens
Future opportunities exist in expanding into emerging markets, particularly in developing countries experiencing rapid urbanization. The integration of advanced technologies, such as artificial intelligence (AI) and machine learning (ML), can enhance siren functionality and effectiveness. The development of eco-friendly and energy-efficient sirens addresses increasing environmental concerns.
Major Players in the Electronic Sirens Ecosystem
- Acoustic Technology
- Sentry Siren
- MA Safety Signal
- Whelen Engineering
- Federal Signal Corporation
- B & M Siren Manufacturing
- Projects Unlimited
- Phoenix Contact
- Mallory Sonalert Products
- QlightUSA
Key Developments in Electronic Sirens Industry
- 2022 Q3: Whelen Engineering launched a new line of compact, high-intensity sirens.
- 2023 Q1: Federal Signal Corporation acquired a smaller siren manufacturer, expanding its product portfolio.
- 2024 Q2: New regulations mandating advanced warning systems in construction zones were implemented in several US states.
Strategic Electronic Sirens Market Forecast
The electronic sirens market is poised for robust growth over the forecast period (2025-2033), driven by sustained demand from various sectors. The increasing adoption of smart city initiatives globally, coupled with technological advancements, will create substantial opportunities. The market's expansion is expected to be driven by technological innovation, stringent safety regulations, and increased investment in public safety infrastructure. The continued consolidation through M&A activities will further shape the competitive landscape.
Electronic Sirens Segmentation
-
1. Application
- 1.1. Civil Defense
- 1.2. Industrial Signaling
- 1.3. Emergency Vehicles
- 1.4. Home/Vehicle Safety
- 1.5. Security/Warning Systems
- 1.6. Military Use
- 1.7. Others
-
2. Types
- 2.1. Electronic
- 2.2. Electro-mechanical
Electronic Sirens Segmentation By Geography
-
1. North America
- 1.1. United States
- 1.2. Canada
- 1.3. Mexico
-
2. South America
- 2.1. Brazil
- 2.2. Argentina
- 2.3. Rest of South America
-
3. Europe
- 3.1. United Kingdom
- 3.2. Germany
- 3.3. France
- 3.4. Italy
- 3.5. Spain
- 3.6. Russia
- 3.7. Benelux
- 3.8. Nordics
- 3.9. Rest of Europe
-
4. Middle East & Africa
- 4.1. Turkey
- 4.2. Israel
- 4.3. GCC
- 4.4. North Africa
- 4.5. South Africa
- 4.6. Rest of Middle East & Africa
-
5. Asia Pacific
- 5.1. China
- 5.2. India
- 5.3. Japan
- 5.4. South Korea
- 5.5. ASEAN
- 5.6. Oceania
- 5.7. Rest of Asia Pacific
Electronic Sirens Regional Market Share
Geographic Coverage of Electronic Sirens
Electronic Sirens REPORT HIGHLIGHTS
| Aspects | Details |
|---|---|
| Study Period | 2020-2034 |
| Base Year | 2025 |
| Estimated Year | 2026 |
| Forecast Period | 2026-2034 |
| Historical Period | 2020-2025 |
| Growth Rate | CAGR of 6.6% from 2020-2034 |
| Segmentation |
|
Table of Contents
- 1. Introduction
- 1.1. Research Scope
- 1.2. Market Segmentation
- 1.3. Research Methodology
- 1.4. Definitions and Assumptions
- 2. Executive Summary
- 2.1. Introduction
- 3. Market Dynamics
- 3.1. Introduction
- 3.2. Market Drivers
- 3.3. Market Restrains
- 3.4. Market Trends
- 4. Market Factor Analysis
- 4.1. Porters Five Forces
- 4.2. Supply/Value Chain
- 4.3. PESTEL analysis
- 4.4. Market Entropy
- 4.5. Patent/Trademark Analysis
- 5. Global Electronic Sirens Analysis, Insights and Forecast, 2020-2032
- 5.1. Market Analysis, Insights and Forecast - by Application
- 5.1.1. Civil Defense
- 5.1.2. Industrial Signaling
- 5.1.3. Emergency Vehicles
- 5.1.4. Home/Vehicle Safety
- 5.1.5. Security/Warning Systems
- 5.1.6. Military Use
- 5.1.7. Others
- 5.2. Market Analysis, Insights and Forecast - by Types
- 5.2.1. Electronic
- 5.2.2. Electro-mechanical
- 5.3. Market Analysis, Insights and Forecast - by Region
- 5.3.1. North America
- 5.3.2. South America
- 5.3.3. Europe
- 5.3.4. Middle East & Africa
- 5.3.5. Asia Pacific
- 5.1. Market Analysis, Insights and Forecast - by Application
- 6. North America Electronic Sirens Analysis, Insights and Forecast, 2020-2032
- 6.1. Market Analysis, Insights and Forecast - by Application
- 6.1.1. Civil Defense
- 6.1.2. Industrial Signaling
- 6.1.3. Emergency Vehicles
- 6.1.4. Home/Vehicle Safety
- 6.1.5. Security/Warning Systems
- 6.1.6. Military Use
- 6.1.7. Others
- 6.2. Market Analysis, Insights and Forecast - by Types
- 6.2.1. Electronic
- 6.2.2. Electro-mechanical
- 6.1. Market Analysis, Insights and Forecast - by Application
- 7. South America Electronic Sirens Analysis, Insights and Forecast, 2020-2032
- 7.1. Market Analysis, Insights and Forecast - by Application
- 7.1.1. Civil Defense
- 7.1.2. Industrial Signaling
- 7.1.3. Emergency Vehicles
- 7.1.4. Home/Vehicle Safety
- 7.1.5. Security/Warning Systems
- 7.1.6. Military Use
- 7.1.7. Others
- 7.2. Market Analysis, Insights and Forecast - by Types
- 7.2.1. Electronic
- 7.2.2. Electro-mechanical
- 7.1. Market Analysis, Insights and Forecast - by Application
- 8. Europe Electronic Sirens Analysis, Insights and Forecast, 2020-2032
- 8.1. Market Analysis, Insights and Forecast - by Application
- 8.1.1. Civil Defense
- 8.1.2. Industrial Signaling
- 8.1.3. Emergency Vehicles
- 8.1.4. Home/Vehicle Safety
- 8.1.5. Security/Warning Systems
- 8.1.6. Military Use
- 8.1.7. Others
- 8.2. Market Analysis, Insights and Forecast - by Types
- 8.2.1. Electronic
- 8.2.2. Electro-mechanical
- 8.1. Market Analysis, Insights and Forecast - by Application
- 9. Middle East & Africa Electronic Sirens Analysis, Insights and Forecast, 2020-2032
- 9.1. Market Analysis, Insights and Forecast - by Application
- 9.1.1. Civil Defense
- 9.1.2. Industrial Signaling
- 9.1.3. Emergency Vehicles
- 9.1.4. Home/Vehicle Safety
- 9.1.5. Security/Warning Systems
- 9.1.6. Military Use
- 9.1.7. Others
- 9.2. Market Analysis, Insights and Forecast - by Types
- 9.2.1. Electronic
- 9.2.2. Electro-mechanical
- 9.1. Market Analysis, Insights and Forecast - by Application
- 10. Asia Pacific Electronic Sirens Analysis, Insights and Forecast, 2020-2032
- 10.1. Market Analysis, Insights and Forecast - by Application
- 10.1.1. Civil Defense
- 10.1.2. Industrial Signaling
- 10.1.3. Emergency Vehicles
- 10.1.4. Home/Vehicle Safety
- 10.1.5. Security/Warning Systems
- 10.1.6. Military Use
- 10.1.7. Others
- 10.2. Market Analysis, Insights and Forecast - by Types
- 10.2.1. Electronic
- 10.2.2. Electro-mechanical
- 10.1. Market Analysis, Insights and Forecast - by Application
- 11. Competitive Analysis
- 11.1. Global Market Share Analysis 2025
- 11.2. Company Profiles
- 11.2.1 Acoustic Technology
- 11.2.1.1. Overview
- 11.2.1.2. Products
- 11.2.1.3. SWOT Analysis
- 11.2.1.4. Recent Developments
- 11.2.1.5. Financials (Based on Availability)
- 11.2.2 Sentry Siren
- 11.2.2.1. Overview
- 11.2.2.2. Products
- 11.2.2.3. SWOT Analysis
- 11.2.2.4. Recent Developments
- 11.2.2.5. Financials (Based on Availability)
- 11.2.3 MA Safety Signal
- 11.2.3.1. Overview
- 11.2.3.2. Products
- 11.2.3.3. SWOT Analysis
- 11.2.3.4. Recent Developments
- 11.2.3.5. Financials (Based on Availability)
- 11.2.4 Whelen Engineering
- 11.2.4.1. Overview
- 11.2.4.2. Products
- 11.2.4.3. SWOT Analysis
- 11.2.4.4. Recent Developments
- 11.2.4.5. Financials (Based on Availability)
- 11.2.5 Federal Signal Corporation
- 11.2.5.1. Overview
- 11.2.5.2. Products
- 11.2.5.3. SWOT Analysis
- 11.2.5.4. Recent Developments
- 11.2.5.5. Financials (Based on Availability)
- 11.2.6 B & M Siren Manufacturing
- 11.2.6.1. Overview
- 11.2.6.2. Products
- 11.2.6.3. SWOT Analysis
- 11.2.6.4. Recent Developments
- 11.2.6.5. Financials (Based on Availability)
- 11.2.7 Projects Unlimited
- 11.2.7.1. Overview
- 11.2.7.2. Products
- 11.2.7.3. SWOT Analysis
- 11.2.7.4. Recent Developments
- 11.2.7.5. Financials (Based on Availability)
- 11.2.8 Phoenix Contact
- 11.2.8.1. Overview
- 11.2.8.2. Products
- 11.2.8.3. SWOT Analysis
- 11.2.8.4. Recent Developments
- 11.2.8.5. Financials (Based on Availability)
- 11.2.9 Mallory Sonalert Products
- 11.2.9.1. Overview
- 11.2.9.2. Products
- 11.2.9.3. SWOT Analysis
- 11.2.9.4. Recent Developments
- 11.2.9.5. Financials (Based on Availability)
- 11.2.10 QlightUSA
- 11.2.10.1. Overview
- 11.2.10.2. Products
- 11.2.10.3. SWOT Analysis
- 11.2.10.4. Recent Developments
- 11.2.10.5. Financials (Based on Availability)
- 11.2.1 Acoustic Technology
List of Figures
- Figure 1: Global Electronic Sirens Revenue Breakdown (undefined, %) by Region 2025 & 2033
- Figure 2: North America Electronic Sirens Revenue (undefined), by Application 2025 & 2033
- Figure 3: North America Electronic Sirens Revenue Share (%), by Application 2025 & 2033
- Figure 4: North America Electronic Sirens Revenue (undefined), by Types 2025 & 2033
- Figure 5: North America Electronic Sirens Revenue Share (%), by Types 2025 & 2033
- Figure 6: North America Electronic Sirens Revenue (undefined), by Country 2025 & 2033
- Figure 7: North America Electronic Sirens Revenue Share (%), by Country 2025 & 2033
- Figure 8: South America Electronic Sirens Revenue (undefined), by Application 2025 & 2033
- Figure 9: South America Electronic Sirens Revenue Share (%), by Application 2025 & 2033
- Figure 10: South America Electronic Sirens Revenue (undefined), by Types 2025 & 2033
- Figure 11: South America Electronic Sirens Revenue Share (%), by Types 2025 & 2033
- Figure 12: South America Electronic Sirens Revenue (undefined), by Country 2025 & 2033
- Figure 13: South America Electronic Sirens Revenue Share (%), by Country 2025 & 2033
- Figure 14: Europe Electronic Sirens Revenue (undefined), by Application 2025 & 2033
- Figure 15: Europe Electronic Sirens Revenue Share (%), by Application 2025 & 2033
- Figure 16: Europe Electronic Sirens Revenue (undefined), by Types 2025 & 2033
- Figure 17: Europe Electronic Sirens Revenue Share (%), by Types 2025 & 2033
- Figure 18: Europe Electronic Sirens Revenue (undefined), by Country 2025 & 2033
- Figure 19: Europe Electronic Sirens Revenue Share (%), by Country 2025 & 2033
- Figure 20: Middle East & Africa Electronic Sirens Revenue (undefined), by Application 2025 & 2033
- Figure 21: Middle East & Africa Electronic Sirens Revenue Share (%), by Application 2025 & 2033
- Figure 22: Middle East & Africa Electronic Sirens Revenue (undefined), by Types 2025 & 2033
- Figure 23: Middle East & Africa Electronic Sirens Revenue Share (%), by Types 2025 & 2033
- Figure 24: Middle East & Africa Electronic Sirens Revenue (undefined), by Country 2025 & 2033
- Figure 25: Middle East & Africa Electronic Sirens Revenue Share (%), by Country 2025 & 2033
- Figure 26: Asia Pacific Electronic Sirens Revenue (undefined), by Application 2025 & 2033
- Figure 27: Asia Pacific Electronic Sirens Revenue Share (%), by Application 2025 & 2033
- Figure 28: Asia Pacific Electronic Sirens Revenue (undefined), by Types 2025 & 2033
- Figure 29: Asia Pacific Electronic Sirens Revenue Share (%), by Types 2025 & 2033
- Figure 30: Asia Pacific Electronic Sirens Revenue (undefined), by Country 2025 & 2033
- Figure 31: Asia Pacific Electronic Sirens Revenue Share (%), by Country 2025 & 2033
List of Tables
- Table 1: Global Electronic Sirens Revenue undefined Forecast, by Application 2020 & 2033
- Table 2: Global Electronic Sirens Revenue undefined Forecast, by Types 2020 & 2033
- Table 3: Global Electronic Sirens Revenue undefined Forecast, by Region 2020 & 2033
- Table 4: Global Electronic Sirens Revenue undefined Forecast, by Application 2020 & 2033
- Table 5: Global Electronic Sirens Revenue undefined Forecast, by Types 2020 & 2033
- Table 6: Global Electronic Sirens Revenue undefined Forecast, by Country 2020 & 2033
- Table 7: United States Electronic Sirens Revenue (undefined) Forecast, by Application 2020 & 2033
- Table 8: Canada Electronic Sirens Revenue (undefined) Forecast, by Application 2020 & 2033
- Table 9: Mexico Electronic Sirens Revenue (undefined) Forecast, by Application 2020 & 2033
- Table 10: Global Electronic Sirens Revenue undefined Forecast, by Application 2020 & 2033
- Table 11: Global Electronic Sirens Revenue undefined Forecast, by Types 2020 & 2033
- Table 12: Global Electronic Sirens Revenue undefined Forecast, by Country 2020 & 2033
- Table 13: Brazil Electronic Sirens Revenue (undefined) Forecast, by Application 2020 & 2033
- Table 14: Argentina Electronic Sirens Revenue (undefined) Forecast, by Application 2020 & 2033
- Table 15: Rest of South America Electronic Sirens Revenue (undefined) Forecast, by Application 2020 & 2033
- Table 16: Global Electronic Sirens Revenue undefined Forecast, by Application 2020 & 2033
- Table 17: Global Electronic Sirens Revenue undefined Forecast, by Types 2020 & 2033
- Table 18: Global Electronic Sirens Revenue undefined Forecast, by Country 2020 & 2033
- Table 19: United Kingdom Electronic Sirens Revenue (undefined) Forecast, by Application 2020 & 2033
- Table 20: Germany Electronic Sirens Revenue (undefined) Forecast, by Application 2020 & 2033
- Table 21: France Electronic Sirens Revenue (undefined) Forecast, by Application 2020 & 2033
- Table 22: Italy Electronic Sirens Revenue (undefined) Forecast, by Application 2020 & 2033
- Table 23: Spain Electronic Sirens Revenue (undefined) Forecast, by Application 2020 & 2033
- Table 24: Russia Electronic Sirens Revenue (undefined) Forecast, by Application 2020 & 2033
- Table 25: Benelux Electronic Sirens Revenue (undefined) Forecast, by Application 2020 & 2033
- Table 26: Nordics Electronic Sirens Revenue (undefined) Forecast, by Application 2020 & 2033
- Table 27: Rest of Europe Electronic Sirens Revenue (undefined) Forecast, by Application 2020 & 2033
- Table 28: Global Electronic Sirens Revenue undefined Forecast, by Application 2020 & 2033
- Table 29: Global Electronic Sirens Revenue undefined Forecast, by Types 2020 & 2033
- Table 30: Global Electronic Sirens Revenue undefined Forecast, by Country 2020 & 2033
- Table 31: Turkey Electronic Sirens Revenue (undefined) Forecast, by Application 2020 & 2033
- Table 32: Israel Electronic Sirens Revenue (undefined) Forecast, by Application 2020 & 2033
- Table 33: GCC Electronic Sirens Revenue (undefined) Forecast, by Application 2020 & 2033
- Table 34: North Africa Electronic Sirens Revenue (undefined) Forecast, by Application 2020 & 2033
- Table 35: South Africa Electronic Sirens Revenue (undefined) Forecast, by Application 2020 & 2033
- Table 36: Rest of Middle East & Africa Electronic Sirens Revenue (undefined) Forecast, by Application 2020 & 2033
- Table 37: Global Electronic Sirens Revenue undefined Forecast, by Application 2020 & 2033
- Table 38: Global Electronic Sirens Revenue undefined Forecast, by Types 2020 & 2033
- Table 39: Global Electronic Sirens Revenue undefined Forecast, by Country 2020 & 2033
- Table 40: China Electronic Sirens Revenue (undefined) Forecast, by Application 2020 & 2033
- Table 41: India Electronic Sirens Revenue (undefined) Forecast, by Application 2020 & 2033
- Table 42: Japan Electronic Sirens Revenue (undefined) Forecast, by Application 2020 & 2033
- Table 43: South Korea Electronic Sirens Revenue (undefined) Forecast, by Application 2020 & 2033
- Table 44: ASEAN Electronic Sirens Revenue (undefined) Forecast, by Application 2020 & 2033
- Table 45: Oceania Electronic Sirens Revenue (undefined) Forecast, by Application 2020 & 2033
- Table 46: Rest of Asia Pacific Electronic Sirens Revenue (undefined) Forecast, by Application 2020 & 2033
Frequently Asked Questions
1. What is the projected Compound Annual Growth Rate (CAGR) of the Electronic Sirens?
The projected CAGR is approximately 6.6%.
2. Which companies are prominent players in the Electronic Sirens?
Key companies in the market include Acoustic Technology, Sentry Siren, MA Safety Signal, Whelen Engineering, Federal Signal Corporation, B & M Siren Manufacturing, Projects Unlimited, Phoenix Contact, Mallory Sonalert Products, QlightUSA.
3. What are the main segments of the Electronic Sirens?
The market segments include Application, Types.
4. Can you provide details about the market size?
The market size is estimated to be USD XXX N/A as of 2022.
5. What are some drivers contributing to market growth?
N/A
6. What are the notable trends driving market growth?
N/A
7. Are there any restraints impacting market growth?
N/A
8. Can you provide examples of recent developments in the market?
N/A
9. What pricing options are available for accessing the report?
Pricing options include single-user, multi-user, and enterprise licenses priced at USD 4900.00, USD 7350.00, and USD 9800.00 respectively.
10. Is the market size provided in terms of value or volume?
The market size is provided in terms of value, measured in N/A.
11. Are there any specific market keywords associated with the report?
Yes, the market keyword associated with the report is "Electronic Sirens," which aids in identifying and referencing the specific market segment covered.
12. How do I determine which pricing option suits my needs best?
The pricing options vary based on user requirements and access needs. Individual users may opt for single-user licenses, while businesses requiring broader access may choose multi-user or enterprise licenses for cost-effective access to the report.
13. Are there any additional resources or data provided in the Electronic Sirens report?
While the report offers comprehensive insights, it's advisable to review the specific contents or supplementary materials provided to ascertain if additional resources or data are available.
14. How can I stay updated on further developments or reports in the Electronic Sirens?
To stay informed about further developments, trends, and reports in the Electronic Sirens, consider subscribing to industry newsletters, following relevant companies and organizations, or regularly checking reputable industry news sources and publications.
Methodology
Step 1 - Identification of Relevant Samples Size from Population Database


Step 2 - Approaches for Defining Global Market Size (Value, Volume* & Price*)

Note*: In applicable scenarios
Step 3 - Data Sources
Primary Research
- Web Analytics
- Survey Reports
- Research Institute
- Latest Research Reports
- Opinion Leaders
Secondary Research
- Annual Reports
- White Paper
- Latest Press Release
- Industry Association
- Paid Database
- Investor Presentations

Step 4 - Data Triangulation
Involves using different sources of information in order to increase the validity of a study
These sources are likely to be stakeholders in a program - participants, other researchers, program staff, other community members, and so on.
Then we put all data in single framework & apply various statistical tools to find out the dynamic on the market.
During the analysis stage, feedback from the stakeholder groups would be compared to determine areas of agreement as well as areas of divergence