

Key Insights
The global durian processing products market is experiencing robust growth, driven by increasing consumer demand for convenient and value-added durian products. The rising popularity of durian in both its native Southeast Asian markets and globally, fueled by social media trends and increased exposure in international culinary circles, is a significant factor. This burgeoning demand is further propelled by advancements in processing technologies that enhance shelf life and product quality, making durian accessible to a wider consumer base beyond its traditionally limited geographical reach. Key segments within the market include frozen durian pulp, durian puree, durian paste, and value-added products like durian ice cream, desserts, and confectionery. The market is highly competitive, with a mix of established players and emerging brands leveraging innovative product development and strategic partnerships to gain market share. While logistical challenges and seasonal variations in durian production can present some restraints, the overall market trajectory points towards significant expansion over the next decade.
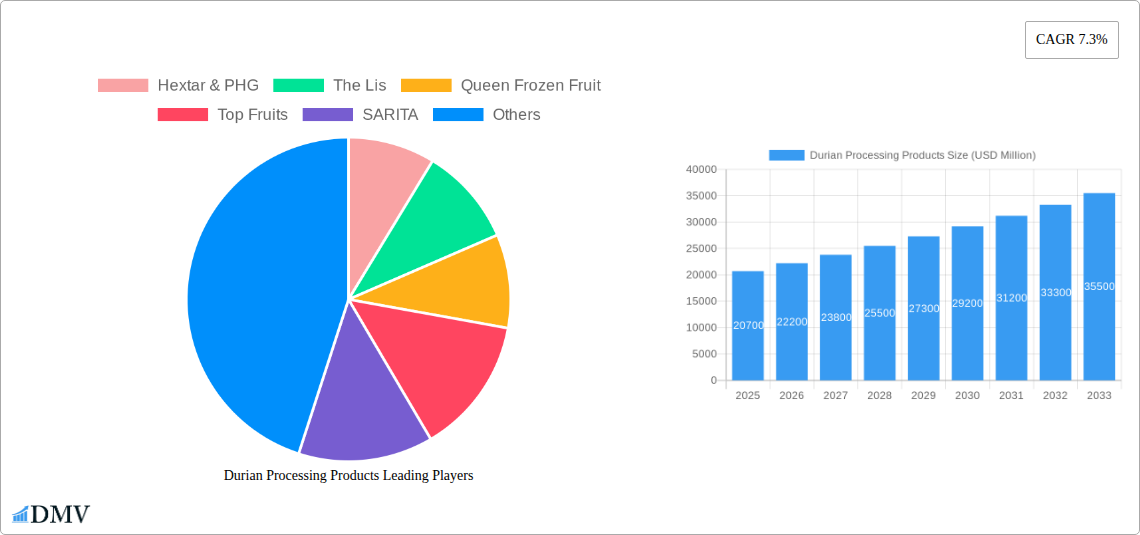
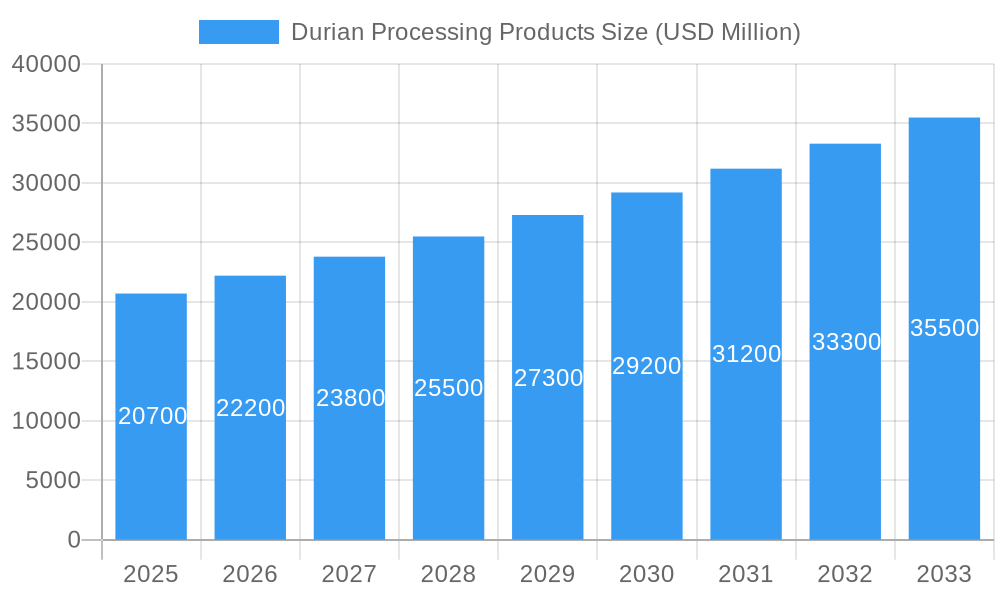
Durian Processing Products Market Size (In Billion)
Looking ahead, several trends are shaping the future of the durian processing products market. The growing health and wellness consciousness is driving demand for minimally processed, organic, and sustainably sourced durian products. E-commerce platforms and direct-to-consumer models are enhancing market accessibility, while continuous innovation in packaging and preservation techniques is extending product shelf life and optimizing supply chain efficiency. The rise of plant-based foods and the increased acceptance of unique and exotic flavors in international markets are further contributing to the market’s expansion. Companies are investing in research and development to create new durian-based products and cater to diverse consumer preferences. Geographical expansion into new markets and strategic partnerships with food retailers and distributors will play crucial roles in driving future growth. We anticipate the continued consolidation within the market as larger players acquire smaller companies and scale their operations to meet the increasing demand.
Durian Processing Products Company Market Share
Durian Processing Products Market Report: 2019-2033
This comprehensive report provides a detailed analysis of the global durian processing products market, offering invaluable insights for stakeholders seeking to navigate this rapidly evolving landscape. The study covers the period 2019-2033, with a base year of 2025 and a forecast period of 2025-2033. The report leverages extensive data analysis to project a market valued at over $XX million by 2033, driven by innovation, changing consumer preferences, and expanding geographical reach. Key players such as Hextar & PHG, The Lis, Queen Frozen Fruit, Top Fruits, SARITA, Hernan Corporation, HERNG YUAN, MANGUWANG FOOD, Goodfarmer, and Thaiblue are profiled, providing a granular understanding of their market positions and strategic initiatives.
Durian Processing Products Market Composition & Trends
This section delves into the competitive dynamics of the durian processing products market, assessing market concentration and identifying key trends influencing its evolution. The report analyzes the market share distribution among key players, revealing the dominance of certain companies and highlighting areas for potential disruption. We assess the impact of M&A activities, including deal values exceeding $XX million in the historical period, shaping the market landscape. Innovation catalysts like technological advancements in processing and preservation techniques are explored, alongside regulatory changes affecting product standards and market access. Furthermore, the report profiles end-user segments and examines the role of substitute products in influencing market demand.
- Market Share Distribution: Hextar & PHG holds an estimated xx% market share in 2025, followed by The Lis at xx%, and Queen Frozen Fruit at xx%. Remaining market share is distributed among other players.
- M&A Activity: Significant M&A activity was observed between 2019-2024, with a total deal value exceeding $XX million, mainly driven by consolidation efforts and expansion into new markets.
- Regulatory Landscape: Stringent food safety regulations and evolving labeling requirements significantly impact market dynamics, requiring manufacturers to adopt stringent quality control measures.
- Substitute Products: The emergence of alternative fruit-based products presents a competitive challenge, albeit limited due to durian's unique flavor profile and growing global appeal.
Durian Processing Products Industry Evolution
This section provides a comprehensive analysis of the durian processing products industry’s trajectory over the historical period (2019-2024) and projects its future growth path until 2033. We analyze market growth trajectories, revealing a Compound Annual Growth Rate (CAGR) of xx% from 2019 to 2024, expected to accelerate to xx% during the forecast period (2025-2033). Technological advancements, such as improved freeze-drying techniques and advanced packaging solutions, have significantly influenced the market. The changing consumer demands towards healthier and more convenient food options are also driving product innovation and market expansion. Specific data points, including adoption rates of new technologies and evolving consumer preferences, are integrated into the analysis. The influence of these factors on market growth and the evolution of product offerings are thoroughly examined.
Leading Regions, Countries, or Segments in Durian Processing Products
This segment pinpoints the leading regions and segments driving market growth. Southeast Asia, specifically countries like Thailand, Malaysia, and Indonesia, are identified as the dominant regions due to significant durian production and a strong local market. The frozen durian segment accounts for the largest share, followed by processed products like durian paste and puree.
- Key Drivers in Southeast Asia:
- High Durian Production: Southeast Asia accounts for the majority of global durian production.
- Strong Local Demand: High domestic consumption fuels market growth.
- Favorable Government Policies: Supportive regulatory frameworks encourage industry development.
- Strategic Investments: Significant investments in processing facilities and infrastructure are boosting capacity.
The dominance of Southeast Asia is further analyzed, considering factors like access to raw materials, established supply chains, and supportive government policies, creating a favorable environment for market expansion.
Durian Processing Products Product Innovations
The durian processing products market witnesses continuous product innovation, driven by consumer preferences and technological advancements. New product forms, such as ready-to-eat durian desserts and convenient frozen durian pulp packs, cater to evolving consumer demand for convenience and variety. Technological advancements in processing and packaging ensure better product quality, extended shelf life, and reduced waste, maximizing value throughout the supply chain. Unique selling propositions often center on superior taste, texture, and convenient usage, targeting consumers seeking high-quality, premium durian products.
Propelling Factors for Durian Processing Products Growth
Several factors propel the growth of the durian processing products market. Firstly, rising consumer demand for convenient and readily available durian products, particularly in urban areas, fuels market expansion. Secondly, technological advancements in processing and packaging enhance product quality and shelf life, expanding the market reach. Finally, supportive government policies and initiatives encourage industry growth and export expansion, driving broader market acceptance.
Obstacles in the Durian Processing Products Market
Despite the significant growth potential, challenges persist within the durian processing products market. Maintaining consistent product quality is crucial due to the fruit's delicate nature and susceptibility to spoilage. Supply chain disruptions, such as seasonal variations in durian production, can impact market stability and pricing. Furthermore, intense competition among established players necessitates continuous innovation and efficient cost management to maintain profitability. Regulatory hurdles related to food safety and labeling regulations impose additional challenges on market players. These factors can lead to fluctuations in market supply and pricing, impacting the overall market stability.
Future Opportunities in Durian Processing Products
Future opportunities lie in expanding into new geographical markets, particularly in regions with growing demand for exotic fruits. Further innovation in product formats and flavors, coupled with the development of functional durian-based food and beverage products, can significantly boost market growth. Exploring new processing techniques and value-added products will increase market attractiveness and broaden consumer appeal.
Major Players in the Durian Processing Products Ecosystem
- Hextar & PHG
- The Lis
- Queen Frozen Fruit
- Top Fruits
- SARITA
- Hernan Corporation
- HERNG YUAN
- MANGUWANG FOOD
- Goodfarmer
- Thaiblue
Key Developments in Durian Processing Products Industry
- 2022 Q3: Queen Frozen Fruit launches a new range of organic frozen durian pulp, expanding into the premium segment.
- 2023 Q1: Hextar & PHG announces a strategic partnership with a major retailer to increase distribution reach.
- 2024 Q2: Significant investment in a new durian processing facility in Thailand by Goodfarmer boosts regional capacity. (Further developments to be added based on specific data)
Strategic Durian Processing Products Market Forecast
The durian processing products market is poised for significant growth, driven by continuous product innovation, expanding consumer base, and robust industry investment. The forecast period (2025-2033) projects a market expansion based on predicted increases in consumption, coupled with successful expansion into new markets. Opportunities for sustainable growth lie in further technological advancements and catering to specific consumer preferences for healthier and more convenient durian products. The market's potential for substantial expansion is underscored by its strong fundamentals and positive growth trajectory.
Durian Processing Products Segmentation
-
1. Application
- 1.1. Baking Industry
- 1.2. Snack Industry
- 1.3. Beverage Industry
- 1.4. Others
-
2. Type
- 2.1. Frozen Durian Pulp
- 2.2. Frozen Durian Paste
- 2.3. Dried Durian
- 2.4. Others
Durian Processing Products Segmentation By Geography
-
1. North America
- 1.1. United States
- 1.2. Canada
- 1.3. Mexico
-
2. South America
- 2.1. Brazil
- 2.2. Argentina
- 2.3. Rest of South America
-
3. Europe
- 3.1. United Kingdom
- 3.2. Germany
- 3.3. France
- 3.4. Italy
- 3.5. Spain
- 3.6. Russia
- 3.7. Benelux
- 3.8. Nordics
- 3.9. Rest of Europe
-
4. Middle East & Africa
- 4.1. Turkey
- 4.2. Israel
- 4.3. GCC
- 4.4. North Africa
- 4.5. South Africa
- 4.6. Rest of Middle East & Africa
-
5. Asia Pacific
- 5.1. China
- 5.2. India
- 5.3. Japan
- 5.4. South Korea
- 5.5. ASEAN
- 5.6. Oceania
- 5.7. Rest of Asia Pacific
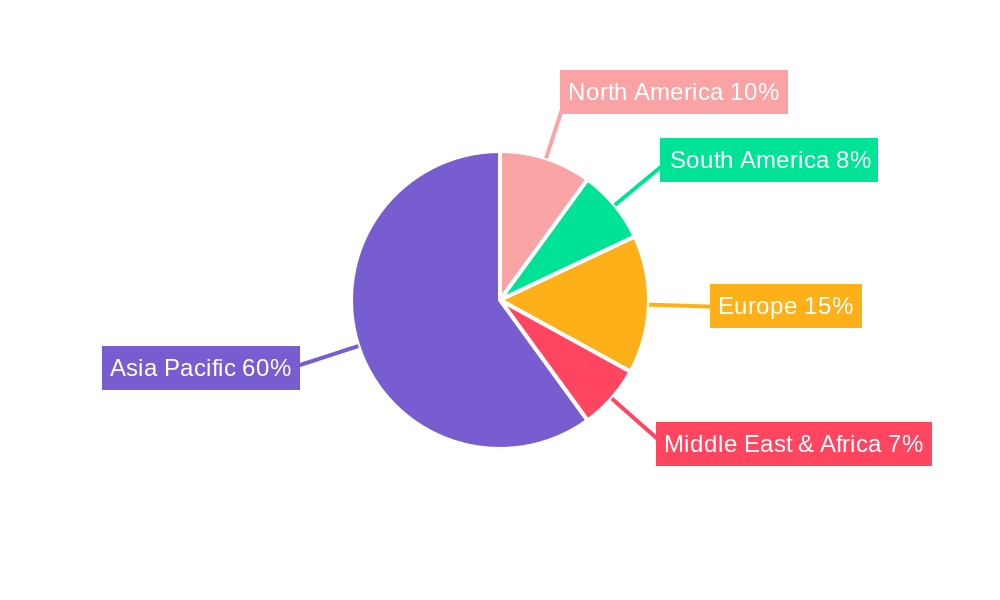
Durian Processing Products Regional Market Share
Geographic Coverage of Durian Processing Products
Durian Processing Products REPORT HIGHLIGHTS
| Aspects | Details |
|---|---|
| Study Period | 2020-2034 |
| Base Year | 2025 |
| Estimated Year | 2026 |
| Forecast Period | 2026-2034 |
| Historical Period | 2020-2025 |
| Growth Rate | CAGR of 7.3% from 2020-2034 |
| Segmentation |
|
Table of Contents
- 1. Introduction
- 1.1. Research Scope
- 1.2. Market Segmentation
- 1.3. Research Methodology
- 1.4. Definitions and Assumptions
- 2. Executive Summary
- 2.1. Introduction
- 3. Market Dynamics
- 3.1. Introduction
- 3.2. Market Drivers
- 3.3. Market Restrains
- 3.4. Market Trends
- 4. Market Factor Analysis
- 4.1. Porters Five Forces
- 4.2. Supply/Value Chain
- 4.3. PESTEL analysis
- 4.4. Market Entropy
- 4.5. Patent/Trademark Analysis
- 5. Global Durian Processing Products Analysis, Insights and Forecast, 2020-2032
- 5.1. Market Analysis, Insights and Forecast - by Application
- 5.1.1. Baking Industry
- 5.1.2. Snack Industry
- 5.1.3. Beverage Industry
- 5.1.4. Others
- 5.2. Market Analysis, Insights and Forecast - by Type
- 5.2.1. Frozen Durian Pulp
- 5.2.2. Frozen Durian Paste
- 5.2.3. Dried Durian
- 5.2.4. Others
- 5.3. Market Analysis, Insights and Forecast - by Region
- 5.3.1. North America
- 5.3.2. South America
- 5.3.3. Europe
- 5.3.4. Middle East & Africa
- 5.3.5. Asia Pacific
- 5.1. Market Analysis, Insights and Forecast - by Application
- 6. North America Durian Processing Products Analysis, Insights and Forecast, 2020-2032
- 6.1. Market Analysis, Insights and Forecast - by Application
- 6.1.1. Baking Industry
- 6.1.2. Snack Industry
- 6.1.3. Beverage Industry
- 6.1.4. Others
- 6.2. Market Analysis, Insights and Forecast - by Type
- 6.2.1. Frozen Durian Pulp
- 6.2.2. Frozen Durian Paste
- 6.2.3. Dried Durian
- 6.2.4. Others
- 6.1. Market Analysis, Insights and Forecast - by Application
- 7. South America Durian Processing Products Analysis, Insights and Forecast, 2020-2032
- 7.1. Market Analysis, Insights and Forecast - by Application
- 7.1.1. Baking Industry
- 7.1.2. Snack Industry
- 7.1.3. Beverage Industry
- 7.1.4. Others
- 7.2. Market Analysis, Insights and Forecast - by Type
- 7.2.1. Frozen Durian Pulp
- 7.2.2. Frozen Durian Paste
- 7.2.3. Dried Durian
- 7.2.4. Others
- 7.1. Market Analysis, Insights and Forecast - by Application
- 8. Europe Durian Processing Products Analysis, Insights and Forecast, 2020-2032
- 8.1. Market Analysis, Insights and Forecast - by Application
- 8.1.1. Baking Industry
- 8.1.2. Snack Industry
- 8.1.3. Beverage Industry
- 8.1.4. Others
- 8.2. Market Analysis, Insights and Forecast - by Type
- 8.2.1. Frozen Durian Pulp
- 8.2.2. Frozen Durian Paste
- 8.2.3. Dried Durian
- 8.2.4. Others
- 8.1. Market Analysis, Insights and Forecast - by Application
- 9. Middle East & Africa Durian Processing Products Analysis, Insights and Forecast, 2020-2032
- 9.1. Market Analysis, Insights and Forecast - by Application
- 9.1.1. Baking Industry
- 9.1.2. Snack Industry
- 9.1.3. Beverage Industry
- 9.1.4. Others
- 9.2. Market Analysis, Insights and Forecast - by Type
- 9.2.1. Frozen Durian Pulp
- 9.2.2. Frozen Durian Paste
- 9.2.3. Dried Durian
- 9.2.4. Others
- 9.1. Market Analysis, Insights and Forecast - by Application
- 10. Asia Pacific Durian Processing Products Analysis, Insights and Forecast, 2020-2032
- 10.1. Market Analysis, Insights and Forecast - by Application
- 10.1.1. Baking Industry
- 10.1.2. Snack Industry
- 10.1.3. Beverage Industry
- 10.1.4. Others
- 10.2. Market Analysis, Insights and Forecast - by Type
- 10.2.1. Frozen Durian Pulp
- 10.2.2. Frozen Durian Paste
- 10.2.3. Dried Durian
- 10.2.4. Others
- 10.1. Market Analysis, Insights and Forecast - by Application
- 11. Competitive Analysis
- 11.1. Global Market Share Analysis 2025
- 11.2. Company Profiles
- 11.2.1 Hextar & PHG
- 11.2.1.1. Overview
- 11.2.1.2. Products
- 11.2.1.3. SWOT Analysis
- 11.2.1.4. Recent Developments
- 11.2.1.5. Financials (Based on Availability)
- 11.2.2 The Lis
- 11.2.2.1. Overview
- 11.2.2.2. Products
- 11.2.2.3. SWOT Analysis
- 11.2.2.4. Recent Developments
- 11.2.2.5. Financials (Based on Availability)
- 11.2.3 Queen Frozen Fruit
- 11.2.3.1. Overview
- 11.2.3.2. Products
- 11.2.3.3. SWOT Analysis
- 11.2.3.4. Recent Developments
- 11.2.3.5. Financials (Based on Availability)
- 11.2.4 Top Fruits
- 11.2.4.1. Overview
- 11.2.4.2. Products
- 11.2.4.3. SWOT Analysis
- 11.2.4.4. Recent Developments
- 11.2.4.5. Financials (Based on Availability)
- 11.2.5 SARITA
- 11.2.5.1. Overview
- 11.2.5.2. Products
- 11.2.5.3. SWOT Analysis
- 11.2.5.4. Recent Developments
- 11.2.5.5. Financials (Based on Availability)
- 11.2.6 Hernan Corporation
- 11.2.6.1. Overview
- 11.2.6.2. Products
- 11.2.6.3. SWOT Analysis
- 11.2.6.4. Recent Developments
- 11.2.6.5. Financials (Based on Availability)
- 11.2.7 HERNG YUAN
- 11.2.7.1. Overview
- 11.2.7.2. Products
- 11.2.7.3. SWOT Analysis
- 11.2.7.4. Recent Developments
- 11.2.7.5. Financials (Based on Availability)
- 11.2.8 MANGUWANG FOOD
- 11.2.8.1. Overview
- 11.2.8.2. Products
- 11.2.8.3. SWOT Analysis
- 11.2.8.4. Recent Developments
- 11.2.8.5. Financials (Based on Availability)
- 11.2.9 Goodfarmer
- 11.2.9.1. Overview
- 11.2.9.2. Products
- 11.2.9.3. SWOT Analysis
- 11.2.9.4. Recent Developments
- 11.2.9.5. Financials (Based on Availability)
- 11.2.10 Thaiblue
- 11.2.10.1. Overview
- 11.2.10.2. Products
- 11.2.10.3. SWOT Analysis
- 11.2.10.4. Recent Developments
- 11.2.10.5. Financials (Based on Availability)
- 11.2.1 Hextar & PHG
List of Figures
- Figure 1: Global Durian Processing Products Revenue Breakdown (undefined, %) by Region 2025 & 2033
- Figure 2: Global Durian Processing Products Volume Breakdown (K, %) by Region 2025 & 2033
- Figure 3: North America Durian Processing Products Revenue (undefined), by Application 2025 & 2033
- Figure 4: North America Durian Processing Products Volume (K), by Application 2025 & 2033
- Figure 5: North America Durian Processing Products Revenue Share (%), by Application 2025 & 2033
- Figure 6: North America Durian Processing Products Volume Share (%), by Application 2025 & 2033
- Figure 7: North America Durian Processing Products Revenue (undefined), by Type 2025 & 2033
- Figure 8: North America Durian Processing Products Volume (K), by Type 2025 & 2033
- Figure 9: North America Durian Processing Products Revenue Share (%), by Type 2025 & 2033
- Figure 10: North America Durian Processing Products Volume Share (%), by Type 2025 & 2033
- Figure 11: North America Durian Processing Products Revenue (undefined), by Country 2025 & 2033
- Figure 12: North America Durian Processing Products Volume (K), by Country 2025 & 2033
- Figure 13: North America Durian Processing Products Revenue Share (%), by Country 2025 & 2033
- Figure 14: North America Durian Processing Products Volume Share (%), by Country 2025 & 2033
- Figure 15: South America Durian Processing Products Revenue (undefined), by Application 2025 & 2033
- Figure 16: South America Durian Processing Products Volume (K), by Application 2025 & 2033
- Figure 17: South America Durian Processing Products Revenue Share (%), by Application 2025 & 2033
- Figure 18: South America Durian Processing Products Volume Share (%), by Application 2025 & 2033
- Figure 19: South America Durian Processing Products Revenue (undefined), by Type 2025 & 2033
- Figure 20: South America Durian Processing Products Volume (K), by Type 2025 & 2033
- Figure 21: South America Durian Processing Products Revenue Share (%), by Type 2025 & 2033
- Figure 22: South America Durian Processing Products Volume Share (%), by Type 2025 & 2033
- Figure 23: South America Durian Processing Products Revenue (undefined), by Country 2025 & 2033
- Figure 24: South America Durian Processing Products Volume (K), by Country 2025 & 2033
- Figure 25: South America Durian Processing Products Revenue Share (%), by Country 2025 & 2033
- Figure 26: South America Durian Processing Products Volume Share (%), by Country 2025 & 2033
- Figure 27: Europe Durian Processing Products Revenue (undefined), by Application 2025 & 2033
- Figure 28: Europe Durian Processing Products Volume (K), by Application 2025 & 2033
- Figure 29: Europe Durian Processing Products Revenue Share (%), by Application 2025 & 2033
- Figure 30: Europe Durian Processing Products Volume Share (%), by Application 2025 & 2033
- Figure 31: Europe Durian Processing Products Revenue (undefined), by Type 2025 & 2033
- Figure 32: Europe Durian Processing Products Volume (K), by Type 2025 & 2033
- Figure 33: Europe Durian Processing Products Revenue Share (%), by Type 2025 & 2033
- Figure 34: Europe Durian Processing Products Volume Share (%), by Type 2025 & 2033
- Figure 35: Europe Durian Processing Products Revenue (undefined), by Country 2025 & 2033
- Figure 36: Europe Durian Processing Products Volume (K), by Country 2025 & 2033
- Figure 37: Europe Durian Processing Products Revenue Share (%), by Country 2025 & 2033
- Figure 38: Europe Durian Processing Products Volume Share (%), by Country 2025 & 2033
- Figure 39: Middle East & Africa Durian Processing Products Revenue (undefined), by Application 2025 & 2033
- Figure 40: Middle East & Africa Durian Processing Products Volume (K), by Application 2025 & 2033
- Figure 41: Middle East & Africa Durian Processing Products Revenue Share (%), by Application 2025 & 2033
- Figure 42: Middle East & Africa Durian Processing Products Volume Share (%), by Application 2025 & 2033
- Figure 43: Middle East & Africa Durian Processing Products Revenue (undefined), by Type 2025 & 2033
- Figure 44: Middle East & Africa Durian Processing Products Volume (K), by Type 2025 & 2033
- Figure 45: Middle East & Africa Durian Processing Products Revenue Share (%), by Type 2025 & 2033
- Figure 46: Middle East & Africa Durian Processing Products Volume Share (%), by Type 2025 & 2033
- Figure 47: Middle East & Africa Durian Processing Products Revenue (undefined), by Country 2025 & 2033
- Figure 48: Middle East & Africa Durian Processing Products Volume (K), by Country 2025 & 2033
- Figure 49: Middle East & Africa Durian Processing Products Revenue Share (%), by Country 2025 & 2033
- Figure 50: Middle East & Africa Durian Processing Products Volume Share (%), by Country 2025 & 2033
- Figure 51: Asia Pacific Durian Processing Products Revenue (undefined), by Application 2025 & 2033
- Figure 52: Asia Pacific Durian Processing Products Volume (K), by Application 2025 & 2033
- Figure 53: Asia Pacific Durian Processing Products Revenue Share (%), by Application 2025 & 2033
- Figure 54: Asia Pacific Durian Processing Products Volume Share (%), by Application 2025 & 2033
- Figure 55: Asia Pacific Durian Processing Products Revenue (undefined), by Type 2025 & 2033
- Figure 56: Asia Pacific Durian Processing Products Volume (K), by Type 2025 & 2033
- Figure 57: Asia Pacific Durian Processing Products Revenue Share (%), by Type 2025 & 2033
- Figure 58: Asia Pacific Durian Processing Products Volume Share (%), by Type 2025 & 2033
- Figure 59: Asia Pacific Durian Processing Products Revenue (undefined), by Country 2025 & 2033
- Figure 60: Asia Pacific Durian Processing Products Volume (K), by Country 2025 & 2033
- Figure 61: Asia Pacific Durian Processing Products Revenue Share (%), by Country 2025 & 2033
- Figure 62: Asia Pacific Durian Processing Products Volume Share (%), by Country 2025 & 2033
List of Tables
- Table 1: Global Durian Processing Products Revenue undefined Forecast, by Application 2020 & 2033
- Table 2: Global Durian Processing Products Volume K Forecast, by Application 2020 & 2033
- Table 3: Global Durian Processing Products Revenue undefined Forecast, by Type 2020 & 2033
- Table 4: Global Durian Processing Products Volume K Forecast, by Type 2020 & 2033
- Table 5: Global Durian Processing Products Revenue undefined Forecast, by Region 2020 & 2033
- Table 6: Global Durian Processing Products Volume K Forecast, by Region 2020 & 2033
- Table 7: Global Durian Processing Products Revenue undefined Forecast, by Application 2020 & 2033
- Table 8: Global Durian Processing Products Volume K Forecast, by Application 2020 & 2033
- Table 9: Global Durian Processing Products Revenue undefined Forecast, by Type 2020 & 2033
- Table 10: Global Durian Processing Products Volume K Forecast, by Type 2020 & 2033
- Table 11: Global Durian Processing Products Revenue undefined Forecast, by Country 2020 & 2033
- Table 12: Global Durian Processing Products Volume K Forecast, by Country 2020 & 2033
- Table 13: United States Durian Processing Products Revenue (undefined) Forecast, by Application 2020 & 2033
- Table 14: United States Durian Processing Products Volume (K) Forecast, by Application 2020 & 2033
- Table 15: Canada Durian Processing Products Revenue (undefined) Forecast, by Application 2020 & 2033
- Table 16: Canada Durian Processing Products Volume (K) Forecast, by Application 2020 & 2033
- Table 17: Mexico Durian Processing Products Revenue (undefined) Forecast, by Application 2020 & 2033
- Table 18: Mexico Durian Processing Products Volume (K) Forecast, by Application 2020 & 2033
- Table 19: Global Durian Processing Products Revenue undefined Forecast, by Application 2020 & 2033
- Table 20: Global Durian Processing Products Volume K Forecast, by Application 2020 & 2033
- Table 21: Global Durian Processing Products Revenue undefined Forecast, by Type 2020 & 2033
- Table 22: Global Durian Processing Products Volume K Forecast, by Type 2020 & 2033
- Table 23: Global Durian Processing Products Revenue undefined Forecast, by Country 2020 & 2033
- Table 24: Global Durian Processing Products Volume K Forecast, by Country 2020 & 2033
- Table 25: Brazil Durian Processing Products Revenue (undefined) Forecast, by Application 2020 & 2033
- Table 26: Brazil Durian Processing Products Volume (K) Forecast, by Application 2020 & 2033
- Table 27: Argentina Durian Processing Products Revenue (undefined) Forecast, by Application 2020 & 2033
- Table 28: Argentina Durian Processing Products Volume (K) Forecast, by Application 2020 & 2033
- Table 29: Rest of South America Durian Processing Products Revenue (undefined) Forecast, by Application 2020 & 2033
- Table 30: Rest of South America Durian Processing Products Volume (K) Forecast, by Application 2020 & 2033
- Table 31: Global Durian Processing Products Revenue undefined Forecast, by Application 2020 & 2033
- Table 32: Global Durian Processing Products Volume K Forecast, by Application 2020 & 2033
- Table 33: Global Durian Processing Products Revenue undefined Forecast, by Type 2020 & 2033
- Table 34: Global Durian Processing Products Volume K Forecast, by Type 2020 & 2033
- Table 35: Global Durian Processing Products Revenue undefined Forecast, by Country 2020 & 2033
- Table 36: Global Durian Processing Products Volume K Forecast, by Country 2020 & 2033
- Table 37: United Kingdom Durian Processing Products Revenue (undefined) Forecast, by Application 2020 & 2033
- Table 38: United Kingdom Durian Processing Products Volume (K) Forecast, by Application 2020 & 2033
- Table 39: Germany Durian Processing Products Revenue (undefined) Forecast, by Application 2020 & 2033
- Table 40: Germany Durian Processing Products Volume (K) Forecast, by Application 2020 & 2033
- Table 41: France Durian Processing Products Revenue (undefined) Forecast, by Application 2020 & 2033
- Table 42: France Durian Processing Products Volume (K) Forecast, by Application 2020 & 2033
- Table 43: Italy Durian Processing Products Revenue (undefined) Forecast, by Application 2020 & 2033
- Table 44: Italy Durian Processing Products Volume (K) Forecast, by Application 2020 & 2033
- Table 45: Spain Durian Processing Products Revenue (undefined) Forecast, by Application 2020 & 2033
- Table 46: Spain Durian Processing Products Volume (K) Forecast, by Application 2020 & 2033
- Table 47: Russia Durian Processing Products Revenue (undefined) Forecast, by Application 2020 & 2033
- Table 48: Russia Durian Processing Products Volume (K) Forecast, by Application 2020 & 2033
- Table 49: Benelux Durian Processing Products Revenue (undefined) Forecast, by Application 2020 & 2033
- Table 50: Benelux Durian Processing Products Volume (K) Forecast, by Application 2020 & 2033
- Table 51: Nordics Durian Processing Products Revenue (undefined) Forecast, by Application 2020 & 2033
- Table 52: Nordics Durian Processing Products Volume (K) Forecast, by Application 2020 & 2033
- Table 53: Rest of Europe Durian Processing Products Revenue (undefined) Forecast, by Application 2020 & 2033
- Table 54: Rest of Europe Durian Processing Products Volume (K) Forecast, by Application 2020 & 2033
- Table 55: Global Durian Processing Products Revenue undefined Forecast, by Application 2020 & 2033
- Table 56: Global Durian Processing Products Volume K Forecast, by Application 2020 & 2033
- Table 57: Global Durian Processing Products Revenue undefined Forecast, by Type 2020 & 2033
- Table 58: Global Durian Processing Products Volume K Forecast, by Type 2020 & 2033
- Table 59: Global Durian Processing Products Revenue undefined Forecast, by Country 2020 & 2033
- Table 60: Global Durian Processing Products Volume K Forecast, by Country 2020 & 2033
- Table 61: Turkey Durian Processing Products Revenue (undefined) Forecast, by Application 2020 & 2033
- Table 62: Turkey Durian Processing Products Volume (K) Forecast, by Application 2020 & 2033
- Table 63: Israel Durian Processing Products Revenue (undefined) Forecast, by Application 2020 & 2033
- Table 64: Israel Durian Processing Products Volume (K) Forecast, by Application 2020 & 2033
- Table 65: GCC Durian Processing Products Revenue (undefined) Forecast, by Application 2020 & 2033
- Table 66: GCC Durian Processing Products Volume (K) Forecast, by Application 2020 & 2033
- Table 67: North Africa Durian Processing Products Revenue (undefined) Forecast, by Application 2020 & 2033
- Table 68: North Africa Durian Processing Products Volume (K) Forecast, by Application 2020 & 2033
- Table 69: South Africa Durian Processing Products Revenue (undefined) Forecast, by Application 2020 & 2033
- Table 70: South Africa Durian Processing Products Volume (K) Forecast, by Application 2020 & 2033
- Table 71: Rest of Middle East & Africa Durian Processing Products Revenue (undefined) Forecast, by Application 2020 & 2033
- Table 72: Rest of Middle East & Africa Durian Processing Products Volume (K) Forecast, by Application 2020 & 2033
- Table 73: Global Durian Processing Products Revenue undefined Forecast, by Application 2020 & 2033
- Table 74: Global Durian Processing Products Volume K Forecast, by Application 2020 & 2033
- Table 75: Global Durian Processing Products Revenue undefined Forecast, by Type 2020 & 2033
- Table 76: Global Durian Processing Products Volume K Forecast, by Type 2020 & 2033
- Table 77: Global Durian Processing Products Revenue undefined Forecast, by Country 2020 & 2033
- Table 78: Global Durian Processing Products Volume K Forecast, by Country 2020 & 2033
- Table 79: China Durian Processing Products Revenue (undefined) Forecast, by Application 2020 & 2033
- Table 80: China Durian Processing Products Volume (K) Forecast, by Application 2020 & 2033
- Table 81: India Durian Processing Products Revenue (undefined) Forecast, by Application 2020 & 2033
- Table 82: India Durian Processing Products Volume (K) Forecast, by Application 2020 & 2033
- Table 83: Japan Durian Processing Products Revenue (undefined) Forecast, by Application 2020 & 2033
- Table 84: Japan Durian Processing Products Volume (K) Forecast, by Application 2020 & 2033
- Table 85: South Korea Durian Processing Products Revenue (undefined) Forecast, by Application 2020 & 2033
- Table 86: South Korea Durian Processing Products Volume (K) Forecast, by Application 2020 & 2033
- Table 87: ASEAN Durian Processing Products Revenue (undefined) Forecast, by Application 2020 & 2033
- Table 88: ASEAN Durian Processing Products Volume (K) Forecast, by Application 2020 & 2033
- Table 89: Oceania Durian Processing Products Revenue (undefined) Forecast, by Application 2020 & 2033
- Table 90: Oceania Durian Processing Products Volume (K) Forecast, by Application 2020 & 2033
- Table 91: Rest of Asia Pacific Durian Processing Products Revenue (undefined) Forecast, by Application 2020 & 2033
- Table 92: Rest of Asia Pacific Durian Processing Products Volume (K) Forecast, by Application 2020 & 2033
Frequently Asked Questions
1. What is the projected Compound Annual Growth Rate (CAGR) of the Durian Processing Products?
The projected CAGR is approximately 7.3%.
2. Which companies are prominent players in the Durian Processing Products?
Key companies in the market include Hextar & PHG, The Lis, Queen Frozen Fruit, Top Fruits, SARITA, Hernan Corporation, HERNG YUAN, MANGUWANG FOOD, Goodfarmer, Thaiblue.
3. What are the main segments of the Durian Processing Products?
The market segments include Application, Type.
4. Can you provide details about the market size?
The market size is estimated to be USD XXX N/A as of 2022.
5. What are some drivers contributing to market growth?
N/A
6. What are the notable trends driving market growth?
N/A
7. Are there any restraints impacting market growth?
N/A
8. Can you provide examples of recent developments in the market?
N/A
9. What pricing options are available for accessing the report?
Pricing options include single-user, multi-user, and enterprise licenses priced at USD 3950.00, USD 5925.00, and USD 7900.00 respectively.
10. Is the market size provided in terms of value or volume?
The market size is provided in terms of value, measured in N/A and volume, measured in K.
11. Are there any specific market keywords associated with the report?
Yes, the market keyword associated with the report is "Durian Processing Products," which aids in identifying and referencing the specific market segment covered.
12. How do I determine which pricing option suits my needs best?
The pricing options vary based on user requirements and access needs. Individual users may opt for single-user licenses, while businesses requiring broader access may choose multi-user or enterprise licenses for cost-effective access to the report.
13. Are there any additional resources or data provided in the Durian Processing Products report?
While the report offers comprehensive insights, it's advisable to review the specific contents or supplementary materials provided to ascertain if additional resources or data are available.
14. How can I stay updated on further developments or reports in the Durian Processing Products?
To stay informed about further developments, trends, and reports in the Durian Processing Products, consider subscribing to industry newsletters, following relevant companies and organizations, or regularly checking reputable industry news sources and publications.
Methodology
Step 1 - Identification of Relevant Samples Size from Population Database


Step 2 - Approaches for Defining Global Market Size (Value, Volume* & Price*)

Note*: In applicable scenarios
Step 3 - Data Sources
Primary Research
- Web Analytics
- Survey Reports
- Research Institute
- Latest Research Reports
- Opinion Leaders
Secondary Research
- Annual Reports
- White Paper
- Latest Press Release
- Industry Association
- Paid Database
- Investor Presentations

Step 4 - Data Triangulation
Involves using different sources of information in order to increase the validity of a study
These sources are likely to be stakeholders in a program - participants, other researchers, program staff, other community members, and so on.
Then we put all data in single framework & apply various statistical tools to find out the dynamic on the market.
During the analysis stage, feedback from the stakeholder groups would be compared to determine areas of agreement as well as areas of divergence