

Key Insights
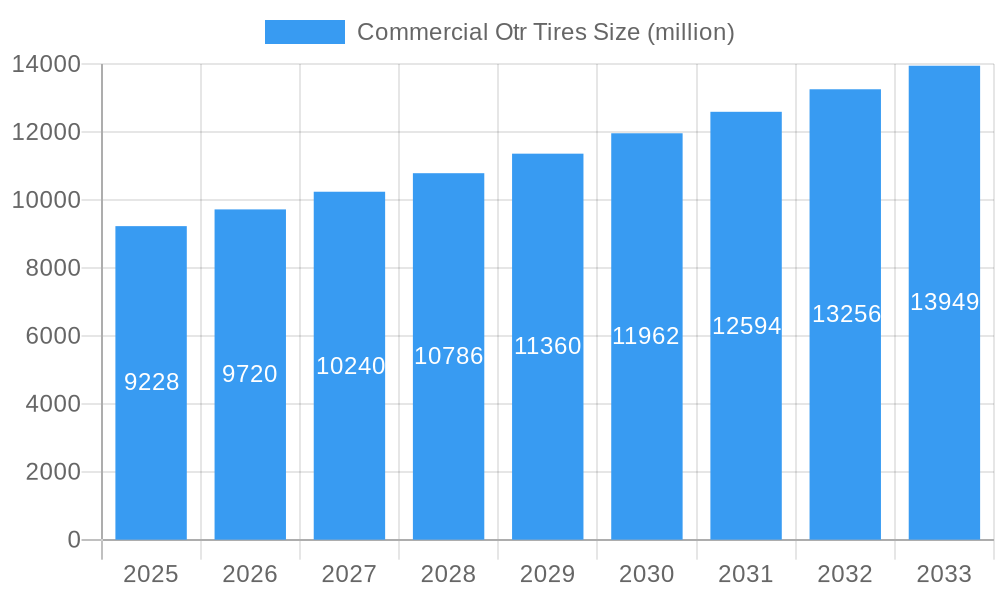
The global commercial off-the-road (OTR) tire market, currently valued at approximately $9.23 billion (2025), is projected to experience robust growth, exhibiting a Compound Annual Growth Rate (CAGR) of 5.1% from 2025 to 2033. This expansion is driven by several key factors. The increasing demand for heavy-duty vehicles in construction, mining, and logistics sectors fuels the need for durable and high-performance OTR tires. Furthermore, technological advancements in tire design and materials, leading to improved fuel efficiency, longer lifespan, and enhanced traction, are significantly contributing to market growth. The rising focus on safety regulations and the adoption of advanced tire management systems also play a crucial role. Competition among major players like Continental, Bridgestone, Michelin, and Goodyear OTR is intense, prompting innovation and competitive pricing, benefiting end-users. While fluctuations in raw material prices and global economic conditions present potential restraints, the long-term outlook for the commercial OTR tire market remains positive, driven by the continuous expansion of infrastructure projects and industrial activities worldwide.
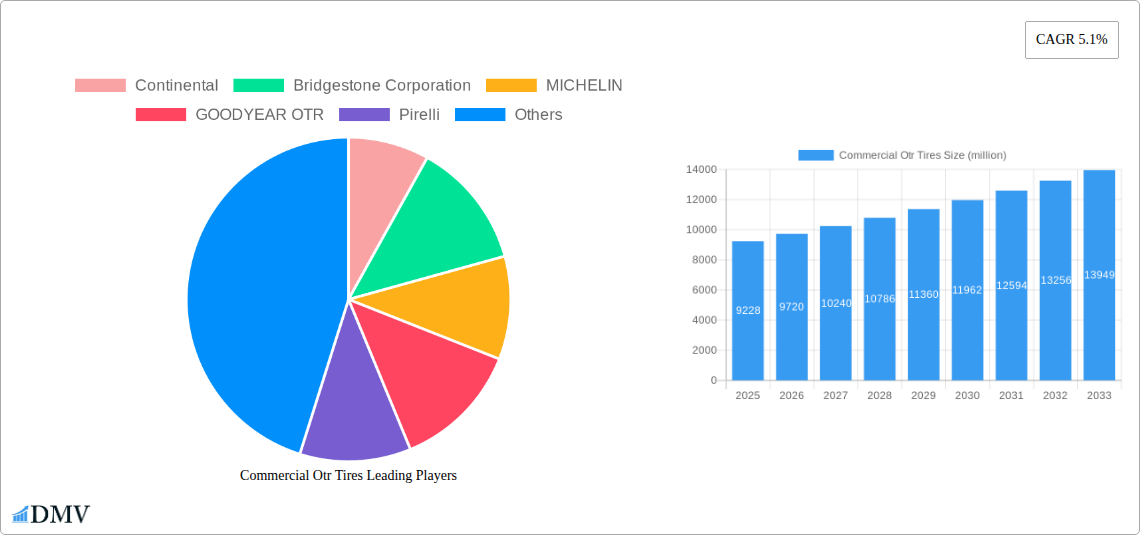
Commercial Otr Tires Market Size (In Billion)
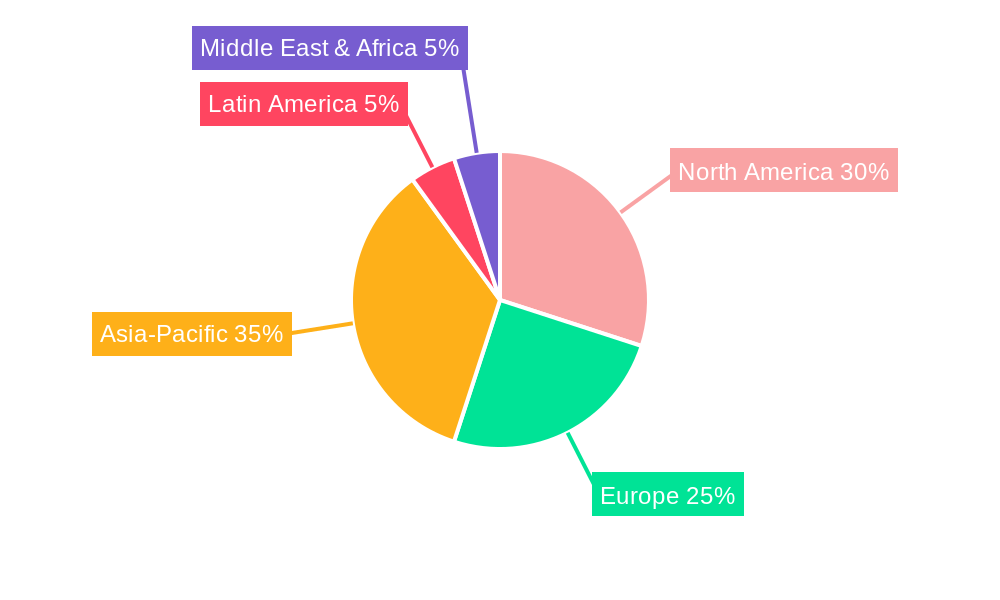
The market segmentation within the commercial OTR tire industry shows significant diversity, with various tire types catering to specific applications and vehicle requirements. Regional variations in market growth are expected, with developing economies witnessing potentially faster expansion due to rapid infrastructure development. North America and Europe currently hold substantial market shares, but regions like Asia-Pacific are poised for significant growth driven by increasing industrialization and urbanization. The competitive landscape is marked by established industry giants and emerging players, leading to ongoing product innovation and strategic partnerships. The future success of players hinges on their ability to adapt to evolving technological demands, manage supply chain challenges, and cater to the diverse needs of end-users in different geographic regions.
Commercial Otr Tires Company Market Share
Commercial OTR Tires Market Report: 2019-2033
This comprehensive report provides a detailed analysis of the global Commercial Off-the-Road (OTR) Tires market, offering invaluable insights for stakeholders across the value chain. Covering the period from 2019 to 2033, with a focus on the 2025-2033 forecast, this report meticulously examines market trends, competitive landscapes, and future growth prospects. The study encompasses millions of dollars in market value and addresses crucial aspects impacting the OTR tire industry, offering a strategic advantage to businesses navigating this dynamic sector.
Commercial OTR Tires Market Composition & Trends
This section delves into the intricate structure of the Commercial OTR Tires market, examining its concentration, innovation drivers, regulatory environment, substitute products, end-user profiles, and mergers & acquisitions (M&A) activities. The global market size, estimated at $XX million in 2025, is expected to experience significant growth during the forecast period. Market concentration is moderately high, with key players like Bridgestone, Michelin, and Goodyear holding substantial market share. However, smaller players, especially in emerging markets, are gradually increasing their presence.
- Market Share Distribution (2025): Bridgestone (XX%), Michelin (XX%), Goodyear (XX%), Continental (XX%), Others (XX%). These figures represent estimated market shares.
- Innovation Catalysts: Focus on sustainable materials, improved tire life, and enhanced fuel efficiency are key drivers.
- Regulatory Landscape: Stringent emission norms and safety regulations are shaping product development.
- Substitute Products: Solid tires and alternative technologies represent niche challenges.
- End-User Profiles: Mining, construction, and agriculture sectors are major end-users.
- M&A Activities (2019-2024): A total of XX M&A deals were recorded, with a cumulative value of approximately $XX million. These deals significantly altered market dynamics and competitive landscapes.
Commercial OTR Tires Industry Evolution
This section meticulously traces the evolutionary path of the Commercial OTR Tires market, exploring growth trajectories, technological advancements, and evolving consumer demands from 2019 to 2033. The historical period (2019-2024) witnessed a compound annual growth rate (CAGR) of XX%, driven by increased infrastructure development and mining activities. The market is projected to grow at a CAGR of XX% during the forecast period (2025-2033). Technological advancements, such as the development of advanced materials and smart tire technologies, are key drivers behind this growth.
The shift toward sustainable and environmentally friendly practices is significantly influencing consumer preferences. Demand for tires with extended lifespans and improved fuel efficiency is on the rise. The adoption of digital technologies in tire management and predictive maintenance systems is also gaining momentum.
Leading Regions, Countries, or Segments in Commercial Otr Tires
This section identifies the dominant regions, countries, or segments within the Commercial OTR Tires market. Currently, North America and Europe hold a substantial market share, driven by robust construction and mining sectors. However, the Asia-Pacific region is experiencing rapid growth, fueled by extensive infrastructure development and industrialization.
- Key Drivers for Dominant Regions:
- North America: High infrastructure spending, robust mining activities.
- Europe: Stringent environmental regulations, focus on sustainable solutions.
- Asia-Pacific: Rapid industrialization, rising construction activities, significant government investments in infrastructure projects.
The dominance of these regions is largely attributable to factors such as higher per capita income, advanced infrastructure, and strong government support. However, emerging economies are rapidly catching up, presenting significant growth opportunities.
Commercial OTR Tires Product Innovations
Recent innovations in Commercial OTR tires focus on enhanced durability, improved fuel efficiency, and reduced environmental impact. Manufacturers are incorporating advanced materials such as specialized rubber compounds and reinforced steel belts to enhance tire life and performance. Smart tire technologies, incorporating sensors and data analytics, are gaining traction, enabling predictive maintenance and optimized fleet management. These innovations offer significant advantages in terms of reduced downtime, lower operating costs, and improved overall efficiency.
Propelling Factors for Commercial Otr Tires Growth
The growth of the Commercial OTR Tires market is driven by several key factors: The booming construction and mining industries globally are major contributors. Government investments in infrastructure projects fuel demand, while the increasing focus on sustainability is driving the adoption of fuel-efficient and environmentally friendly tires. Technological advancements, such as the development of smart tires and improved materials, are also significant growth drivers.
Obstacles in the Commercial Otr Tires Market
The Commercial OTR Tires market faces challenges including fluctuating raw material prices, supply chain disruptions, and intense competition. Stringent environmental regulations and the increasing cost of compliance represent significant hurdles. Economic downturns can also negatively impact demand, particularly in cyclical industries like construction and mining.
Future Opportunities in Commercial Otr Tires
Future opportunities lie in expanding into emerging markets, developing innovative tire technologies, and catering to the growing demand for sustainable products. The development of smart tire technologies with enhanced connectivity and data analytics capabilities offers promising prospects. The focus on circular economy principles, such as tire recycling and retreading, also presents significant opportunities for market expansion.
Major Players in the Commercial Otr Tires Ecosystem
- Continental
- Bridgestone Corporation
- MICHELIN
- GOODYEAR OTR
- Pirelli
- Yokohama OTR
- Trelleborg Wheels
- Titan International
- Nokian Tyres
- CEAT
- Double Coin Tires
- Magna Tyres
- Carlisle Tires
- Firestone
- Techking Tires
- Triangle Tire
- MRF Tyres
- OTR Tyre
- Apollo Tyres
- BKT Tires
- MAXXIS International
- Linglong tire
- Truck Tyre
Key Developments in Commercial Otr Tires Industry
- 2023-03: Bridgestone launched a new line of fuel-efficient OTR tires.
- 2022-11: Michelin and Goodyear announced a joint venture focusing on sustainable tire materials.
- 2021-09: Continental acquired a smaller OTR tire manufacturer, expanding its market share. (Note: Specific details are illustrative and need to be replaced with actual data.)
Strategic Commercial OTR Tires Market Forecast
The Commercial OTR Tires market is poised for substantial growth in the coming years, driven by robust demand from key end-user industries and ongoing technological advancements. The focus on sustainable solutions, coupled with innovations in tire design and manufacturing, will further fuel market expansion. The continued development and adoption of smart tire technologies will enhance operational efficiency and optimize tire management practices across various sectors.
Commercial Otr Tires Segmentation
-
1. Application
- 1.1. Construction
- 1.2. Mining
- 1.3. Others
-
2. Type
- 2.1. Radial Tire
- 2.2. Bias Tire
Commercial Otr Tires Segmentation By Geography
-
1. North America
- 1.1. United States
- 1.2. Canada
- 1.3. Mexico
-
2. South America
- 2.1. Brazil
- 2.2. Argentina
- 2.3. Rest of South America
-
3. Europe
- 3.1. United Kingdom
- 3.2. Germany
- 3.3. France
- 3.4. Italy
- 3.5. Spain
- 3.6. Russia
- 3.7. Benelux
- 3.8. Nordics
- 3.9. Rest of Europe
-
4. Middle East & Africa
- 4.1. Turkey
- 4.2. Israel
- 4.3. GCC
- 4.4. North Africa
- 4.5. South Africa
- 4.6. Rest of Middle East & Africa
-
5. Asia Pacific
- 5.1. China
- 5.2. India
- 5.3. Japan
- 5.4. South Korea
- 5.5. ASEAN
- 5.6. Oceania
- 5.7. Rest of Asia Pacific
Commercial Otr Tires Regional Market Share
Geographic Coverage of Commercial Otr Tires
Commercial Otr Tires REPORT HIGHLIGHTS
| Aspects | Details |
|---|---|
| Study Period | 2020-2034 |
| Base Year | 2025 |
| Estimated Year | 2026 |
| Forecast Period | 2026-2034 |
| Historical Period | 2020-2025 |
| Growth Rate | CAGR of 5.1% from 2020-2034 |
| Segmentation |
|
Table of Contents
- 1. Introduction
- 1.1. Research Scope
- 1.2. Market Segmentation
- 1.3. Research Methodology
- 1.4. Definitions and Assumptions
- 2. Executive Summary
- 2.1. Introduction
- 3. Market Dynamics
- 3.1. Introduction
- 3.2. Market Drivers
- 3.3. Market Restrains
- 3.4. Market Trends
- 4. Market Factor Analysis
- 4.1. Porters Five Forces
- 4.2. Supply/Value Chain
- 4.3. PESTEL analysis
- 4.4. Market Entropy
- 4.5. Patent/Trademark Analysis
- 5. Global Commercial Otr Tires Analysis, Insights and Forecast, 2020-2032
- 5.1. Market Analysis, Insights and Forecast - by Application
- 5.1.1. Construction
- 5.1.2. Mining
- 5.1.3. Others
- 5.2. Market Analysis, Insights and Forecast - by Type
- 5.2.1. Radial Tire
- 5.2.2. Bias Tire
- 5.3. Market Analysis, Insights and Forecast - by Region
- 5.3.1. North America
- 5.3.2. South America
- 5.3.3. Europe
- 5.3.4. Middle East & Africa
- 5.3.5. Asia Pacific
- 5.1. Market Analysis, Insights and Forecast - by Application
- 6. North America Commercial Otr Tires Analysis, Insights and Forecast, 2020-2032
- 6.1. Market Analysis, Insights and Forecast - by Application
- 6.1.1. Construction
- 6.1.2. Mining
- 6.1.3. Others
- 6.2. Market Analysis, Insights and Forecast - by Type
- 6.2.1. Radial Tire
- 6.2.2. Bias Tire
- 6.1. Market Analysis, Insights and Forecast - by Application
- 7. South America Commercial Otr Tires Analysis, Insights and Forecast, 2020-2032
- 7.1. Market Analysis, Insights and Forecast - by Application
- 7.1.1. Construction
- 7.1.2. Mining
- 7.1.3. Others
- 7.2. Market Analysis, Insights and Forecast - by Type
- 7.2.1. Radial Tire
- 7.2.2. Bias Tire
- 7.1. Market Analysis, Insights and Forecast - by Application
- 8. Europe Commercial Otr Tires Analysis, Insights and Forecast, 2020-2032
- 8.1. Market Analysis, Insights and Forecast - by Application
- 8.1.1. Construction
- 8.1.2. Mining
- 8.1.3. Others
- 8.2. Market Analysis, Insights and Forecast - by Type
- 8.2.1. Radial Tire
- 8.2.2. Bias Tire
- 8.1. Market Analysis, Insights and Forecast - by Application
- 9. Middle East & Africa Commercial Otr Tires Analysis, Insights and Forecast, 2020-2032
- 9.1. Market Analysis, Insights and Forecast - by Application
- 9.1.1. Construction
- 9.1.2. Mining
- 9.1.3. Others
- 9.2. Market Analysis, Insights and Forecast - by Type
- 9.2.1. Radial Tire
- 9.2.2. Bias Tire
- 9.1. Market Analysis, Insights and Forecast - by Application
- 10. Asia Pacific Commercial Otr Tires Analysis, Insights and Forecast, 2020-2032
- 10.1. Market Analysis, Insights and Forecast - by Application
- 10.1.1. Construction
- 10.1.2. Mining
- 10.1.3. Others
- 10.2. Market Analysis, Insights and Forecast - by Type
- 10.2.1. Radial Tire
- 10.2.2. Bias Tire
- 10.1. Market Analysis, Insights and Forecast - by Application
- 11. Competitive Analysis
- 11.1. Global Market Share Analysis 2025
- 11.2. Company Profiles
- 11.2.1 Continental
- 11.2.1.1. Overview
- 11.2.1.2. Products
- 11.2.1.3. SWOT Analysis
- 11.2.1.4. Recent Developments
- 11.2.1.5. Financials (Based on Availability)
- 11.2.2 Bridgestone Corporation
- 11.2.2.1. Overview
- 11.2.2.2. Products
- 11.2.2.3. SWOT Analysis
- 11.2.2.4. Recent Developments
- 11.2.2.5. Financials (Based on Availability)
- 11.2.3 MICHELIN
- 11.2.3.1. Overview
- 11.2.3.2. Products
- 11.2.3.3. SWOT Analysis
- 11.2.3.4. Recent Developments
- 11.2.3.5. Financials (Based on Availability)
- 11.2.4 GOODYEAR OTR
- 11.2.4.1. Overview
- 11.2.4.2. Products
- 11.2.4.3. SWOT Analysis
- 11.2.4.4. Recent Developments
- 11.2.4.5. Financials (Based on Availability)
- 11.2.5 Pirelli
- 11.2.5.1. Overview
- 11.2.5.2. Products
- 11.2.5.3. SWOT Analysis
- 11.2.5.4. Recent Developments
- 11.2.5.5. Financials (Based on Availability)
- 11.2.6 Yokohama OTR
- 11.2.6.1. Overview
- 11.2.6.2. Products
- 11.2.6.3. SWOT Analysis
- 11.2.6.4. Recent Developments
- 11.2.6.5. Financials (Based on Availability)
- 11.2.7 Trelleborg Wheels
- 11.2.7.1. Overview
- 11.2.7.2. Products
- 11.2.7.3. SWOT Analysis
- 11.2.7.4. Recent Developments
- 11.2.7.5. Financials (Based on Availability)
- 11.2.8 Titan International
- 11.2.8.1. Overview
- 11.2.8.2. Products
- 11.2.8.3. SWOT Analysis
- 11.2.8.4. Recent Developments
- 11.2.8.5. Financials (Based on Availability)
- 11.2.9 Nokian Tyres
- 11.2.9.1. Overview
- 11.2.9.2. Products
- 11.2.9.3. SWOT Analysis
- 11.2.9.4. Recent Developments
- 11.2.9.5. Financials (Based on Availability)
- 11.2.10 CEAT
- 11.2.10.1. Overview
- 11.2.10.2. Products
- 11.2.10.3. SWOT Analysis
- 11.2.10.4. Recent Developments
- 11.2.10.5. Financials (Based on Availability)
- 11.2.11 Double Coin Tires
- 11.2.11.1. Overview
- 11.2.11.2. Products
- 11.2.11.3. SWOT Analysis
- 11.2.11.4. Recent Developments
- 11.2.11.5. Financials (Based on Availability)
- 11.2.12 Magna Tyres
- 11.2.12.1. Overview
- 11.2.12.2. Products
- 11.2.12.3. SWOT Analysis
- 11.2.12.4. Recent Developments
- 11.2.12.5. Financials (Based on Availability)
- 11.2.13 Carlisle Tires
- 11.2.13.1. Overview
- 11.2.13.2. Products
- 11.2.13.3. SWOT Analysis
- 11.2.13.4. Recent Developments
- 11.2.13.5. Financials (Based on Availability)
- 11.2.14 Firestone
- 11.2.14.1. Overview
- 11.2.14.2. Products
- 11.2.14.3. SWOT Analysis
- 11.2.14.4. Recent Developments
- 11.2.14.5. Financials (Based on Availability)
- 11.2.15 Techking Tires
- 11.2.15.1. Overview
- 11.2.15.2. Products
- 11.2.15.3. SWOT Analysis
- 11.2.15.4. Recent Developments
- 11.2.15.5. Financials (Based on Availability)
- 11.2.16 Triangle Tire
- 11.2.16.1. Overview
- 11.2.16.2. Products
- 11.2.16.3. SWOT Analysis
- 11.2.16.4. Recent Developments
- 11.2.16.5. Financials (Based on Availability)
- 11.2.17 MRF Tyres
- 11.2.17.1. Overview
- 11.2.17.2. Products
- 11.2.17.3. SWOT Analysis
- 11.2.17.4. Recent Developments
- 11.2.17.5. Financials (Based on Availability)
- 11.2.18 OTR Tyre
- 11.2.18.1. Overview
- 11.2.18.2. Products
- 11.2.18.3. SWOT Analysis
- 11.2.18.4. Recent Developments
- 11.2.18.5. Financials (Based on Availability)
- 11.2.19 Apollo Tyres
- 11.2.19.1. Overview
- 11.2.19.2. Products
- 11.2.19.3. SWOT Analysis
- 11.2.19.4. Recent Developments
- 11.2.19.5. Financials (Based on Availability)
- 11.2.20 BKT Tires
- 11.2.20.1. Overview
- 11.2.20.2. Products
- 11.2.20.3. SWOT Analysis
- 11.2.20.4. Recent Developments
- 11.2.20.5. Financials (Based on Availability)
- 11.2.21 MAXXIS International
- 11.2.21.1. Overview
- 11.2.21.2. Products
- 11.2.21.3. SWOT Analysis
- 11.2.21.4. Recent Developments
- 11.2.21.5. Financials (Based on Availability)
- 11.2.22 Linglong tire
- 11.2.22.1. Overview
- 11.2.22.2. Products
- 11.2.22.3. SWOT Analysis
- 11.2.22.4. Recent Developments
- 11.2.22.5. Financials (Based on Availability)
- 11.2.23 Truck Tyre
- 11.2.23.1. Overview
- 11.2.23.2. Products
- 11.2.23.3. SWOT Analysis
- 11.2.23.4. Recent Developments
- 11.2.23.5. Financials (Based on Availability)
- 11.2.1 Continental
List of Figures
- Figure 1: Global Commercial Otr Tires Revenue Breakdown (million, %) by Region 2025 & 2033
- Figure 2: Global Commercial Otr Tires Volume Breakdown (K, %) by Region 2025 & 2033
- Figure 3: North America Commercial Otr Tires Revenue (million), by Application 2025 & 2033
- Figure 4: North America Commercial Otr Tires Volume (K), by Application 2025 & 2033
- Figure 5: North America Commercial Otr Tires Revenue Share (%), by Application 2025 & 2033
- Figure 6: North America Commercial Otr Tires Volume Share (%), by Application 2025 & 2033
- Figure 7: North America Commercial Otr Tires Revenue (million), by Type 2025 & 2033
- Figure 8: North America Commercial Otr Tires Volume (K), by Type 2025 & 2033
- Figure 9: North America Commercial Otr Tires Revenue Share (%), by Type 2025 & 2033
- Figure 10: North America Commercial Otr Tires Volume Share (%), by Type 2025 & 2033
- Figure 11: North America Commercial Otr Tires Revenue (million), by Country 2025 & 2033
- Figure 12: North America Commercial Otr Tires Volume (K), by Country 2025 & 2033
- Figure 13: North America Commercial Otr Tires Revenue Share (%), by Country 2025 & 2033
- Figure 14: North America Commercial Otr Tires Volume Share (%), by Country 2025 & 2033
- Figure 15: South America Commercial Otr Tires Revenue (million), by Application 2025 & 2033
- Figure 16: South America Commercial Otr Tires Volume (K), by Application 2025 & 2033
- Figure 17: South America Commercial Otr Tires Revenue Share (%), by Application 2025 & 2033
- Figure 18: South America Commercial Otr Tires Volume Share (%), by Application 2025 & 2033
- Figure 19: South America Commercial Otr Tires Revenue (million), by Type 2025 & 2033
- Figure 20: South America Commercial Otr Tires Volume (K), by Type 2025 & 2033
- Figure 21: South America Commercial Otr Tires Revenue Share (%), by Type 2025 & 2033
- Figure 22: South America Commercial Otr Tires Volume Share (%), by Type 2025 & 2033
- Figure 23: South America Commercial Otr Tires Revenue (million), by Country 2025 & 2033
- Figure 24: South America Commercial Otr Tires Volume (K), by Country 2025 & 2033
- Figure 25: South America Commercial Otr Tires Revenue Share (%), by Country 2025 & 2033
- Figure 26: South America Commercial Otr Tires Volume Share (%), by Country 2025 & 2033
- Figure 27: Europe Commercial Otr Tires Revenue (million), by Application 2025 & 2033
- Figure 28: Europe Commercial Otr Tires Volume (K), by Application 2025 & 2033
- Figure 29: Europe Commercial Otr Tires Revenue Share (%), by Application 2025 & 2033
- Figure 30: Europe Commercial Otr Tires Volume Share (%), by Application 2025 & 2033
- Figure 31: Europe Commercial Otr Tires Revenue (million), by Type 2025 & 2033
- Figure 32: Europe Commercial Otr Tires Volume (K), by Type 2025 & 2033
- Figure 33: Europe Commercial Otr Tires Revenue Share (%), by Type 2025 & 2033
- Figure 34: Europe Commercial Otr Tires Volume Share (%), by Type 2025 & 2033
- Figure 35: Europe Commercial Otr Tires Revenue (million), by Country 2025 & 2033
- Figure 36: Europe Commercial Otr Tires Volume (K), by Country 2025 & 2033
- Figure 37: Europe Commercial Otr Tires Revenue Share (%), by Country 2025 & 2033
- Figure 38: Europe Commercial Otr Tires Volume Share (%), by Country 2025 & 2033
- Figure 39: Middle East & Africa Commercial Otr Tires Revenue (million), by Application 2025 & 2033
- Figure 40: Middle East & Africa Commercial Otr Tires Volume (K), by Application 2025 & 2033
- Figure 41: Middle East & Africa Commercial Otr Tires Revenue Share (%), by Application 2025 & 2033
- Figure 42: Middle East & Africa Commercial Otr Tires Volume Share (%), by Application 2025 & 2033
- Figure 43: Middle East & Africa Commercial Otr Tires Revenue (million), by Type 2025 & 2033
- Figure 44: Middle East & Africa Commercial Otr Tires Volume (K), by Type 2025 & 2033
- Figure 45: Middle East & Africa Commercial Otr Tires Revenue Share (%), by Type 2025 & 2033
- Figure 46: Middle East & Africa Commercial Otr Tires Volume Share (%), by Type 2025 & 2033
- Figure 47: Middle East & Africa Commercial Otr Tires Revenue (million), by Country 2025 & 2033
- Figure 48: Middle East & Africa Commercial Otr Tires Volume (K), by Country 2025 & 2033
- Figure 49: Middle East & Africa Commercial Otr Tires Revenue Share (%), by Country 2025 & 2033
- Figure 50: Middle East & Africa Commercial Otr Tires Volume Share (%), by Country 2025 & 2033
- Figure 51: Asia Pacific Commercial Otr Tires Revenue (million), by Application 2025 & 2033
- Figure 52: Asia Pacific Commercial Otr Tires Volume (K), by Application 2025 & 2033
- Figure 53: Asia Pacific Commercial Otr Tires Revenue Share (%), by Application 2025 & 2033
- Figure 54: Asia Pacific Commercial Otr Tires Volume Share (%), by Application 2025 & 2033
- Figure 55: Asia Pacific Commercial Otr Tires Revenue (million), by Type 2025 & 2033
- Figure 56: Asia Pacific Commercial Otr Tires Volume (K), by Type 2025 & 2033
- Figure 57: Asia Pacific Commercial Otr Tires Revenue Share (%), by Type 2025 & 2033
- Figure 58: Asia Pacific Commercial Otr Tires Volume Share (%), by Type 2025 & 2033
- Figure 59: Asia Pacific Commercial Otr Tires Revenue (million), by Country 2025 & 2033
- Figure 60: Asia Pacific Commercial Otr Tires Volume (K), by Country 2025 & 2033
- Figure 61: Asia Pacific Commercial Otr Tires Revenue Share (%), by Country 2025 & 2033
- Figure 62: Asia Pacific Commercial Otr Tires Volume Share (%), by Country 2025 & 2033
List of Tables
- Table 1: Global Commercial Otr Tires Revenue million Forecast, by Application 2020 & 2033
- Table 2: Global Commercial Otr Tires Volume K Forecast, by Application 2020 & 2033
- Table 3: Global Commercial Otr Tires Revenue million Forecast, by Type 2020 & 2033
- Table 4: Global Commercial Otr Tires Volume K Forecast, by Type 2020 & 2033
- Table 5: Global Commercial Otr Tires Revenue million Forecast, by Region 2020 & 2033
- Table 6: Global Commercial Otr Tires Volume K Forecast, by Region 2020 & 2033
- Table 7: Global Commercial Otr Tires Revenue million Forecast, by Application 2020 & 2033
- Table 8: Global Commercial Otr Tires Volume K Forecast, by Application 2020 & 2033
- Table 9: Global Commercial Otr Tires Revenue million Forecast, by Type 2020 & 2033
- Table 10: Global Commercial Otr Tires Volume K Forecast, by Type 2020 & 2033
- Table 11: Global Commercial Otr Tires Revenue million Forecast, by Country 2020 & 2033
- Table 12: Global Commercial Otr Tires Volume K Forecast, by Country 2020 & 2033
- Table 13: United States Commercial Otr Tires Revenue (million) Forecast, by Application 2020 & 2033
- Table 14: United States Commercial Otr Tires Volume (K) Forecast, by Application 2020 & 2033
- Table 15: Canada Commercial Otr Tires Revenue (million) Forecast, by Application 2020 & 2033
- Table 16: Canada Commercial Otr Tires Volume (K) Forecast, by Application 2020 & 2033
- Table 17: Mexico Commercial Otr Tires Revenue (million) Forecast, by Application 2020 & 2033
- Table 18: Mexico Commercial Otr Tires Volume (K) Forecast, by Application 2020 & 2033
- Table 19: Global Commercial Otr Tires Revenue million Forecast, by Application 2020 & 2033
- Table 20: Global Commercial Otr Tires Volume K Forecast, by Application 2020 & 2033
- Table 21: Global Commercial Otr Tires Revenue million Forecast, by Type 2020 & 2033
- Table 22: Global Commercial Otr Tires Volume K Forecast, by Type 2020 & 2033
- Table 23: Global Commercial Otr Tires Revenue million Forecast, by Country 2020 & 2033
- Table 24: Global Commercial Otr Tires Volume K Forecast, by Country 2020 & 2033
- Table 25: Brazil Commercial Otr Tires Revenue (million) Forecast, by Application 2020 & 2033
- Table 26: Brazil Commercial Otr Tires Volume (K) Forecast, by Application 2020 & 2033
- Table 27: Argentina Commercial Otr Tires Revenue (million) Forecast, by Application 2020 & 2033
- Table 28: Argentina Commercial Otr Tires Volume (K) Forecast, by Application 2020 & 2033
- Table 29: Rest of South America Commercial Otr Tires Revenue (million) Forecast, by Application 2020 & 2033
- Table 30: Rest of South America Commercial Otr Tires Volume (K) Forecast, by Application 2020 & 2033
- Table 31: Global Commercial Otr Tires Revenue million Forecast, by Application 2020 & 2033
- Table 32: Global Commercial Otr Tires Volume K Forecast, by Application 2020 & 2033
- Table 33: Global Commercial Otr Tires Revenue million Forecast, by Type 2020 & 2033
- Table 34: Global Commercial Otr Tires Volume K Forecast, by Type 2020 & 2033
- Table 35: Global Commercial Otr Tires Revenue million Forecast, by Country 2020 & 2033
- Table 36: Global Commercial Otr Tires Volume K Forecast, by Country 2020 & 2033
- Table 37: United Kingdom Commercial Otr Tires Revenue (million) Forecast, by Application 2020 & 2033
- Table 38: United Kingdom Commercial Otr Tires Volume (K) Forecast, by Application 2020 & 2033
- Table 39: Germany Commercial Otr Tires Revenue (million) Forecast, by Application 2020 & 2033
- Table 40: Germany Commercial Otr Tires Volume (K) Forecast, by Application 2020 & 2033
- Table 41: France Commercial Otr Tires Revenue (million) Forecast, by Application 2020 & 2033
- Table 42: France Commercial Otr Tires Volume (K) Forecast, by Application 2020 & 2033
- Table 43: Italy Commercial Otr Tires Revenue (million) Forecast, by Application 2020 & 2033
- Table 44: Italy Commercial Otr Tires Volume (K) Forecast, by Application 2020 & 2033
- Table 45: Spain Commercial Otr Tires Revenue (million) Forecast, by Application 2020 & 2033
- Table 46: Spain Commercial Otr Tires Volume (K) Forecast, by Application 2020 & 2033
- Table 47: Russia Commercial Otr Tires Revenue (million) Forecast, by Application 2020 & 2033
- Table 48: Russia Commercial Otr Tires Volume (K) Forecast, by Application 2020 & 2033
- Table 49: Benelux Commercial Otr Tires Revenue (million) Forecast, by Application 2020 & 2033
- Table 50: Benelux Commercial Otr Tires Volume (K) Forecast, by Application 2020 & 2033
- Table 51: Nordics Commercial Otr Tires Revenue (million) Forecast, by Application 2020 & 2033
- Table 52: Nordics Commercial Otr Tires Volume (K) Forecast, by Application 2020 & 2033
- Table 53: Rest of Europe Commercial Otr Tires Revenue (million) Forecast, by Application 2020 & 2033
- Table 54: Rest of Europe Commercial Otr Tires Volume (K) Forecast, by Application 2020 & 2033
- Table 55: Global Commercial Otr Tires Revenue million Forecast, by Application 2020 & 2033
- Table 56: Global Commercial Otr Tires Volume K Forecast, by Application 2020 & 2033
- Table 57: Global Commercial Otr Tires Revenue million Forecast, by Type 2020 & 2033
- Table 58: Global Commercial Otr Tires Volume K Forecast, by Type 2020 & 2033
- Table 59: Global Commercial Otr Tires Revenue million Forecast, by Country 2020 & 2033
- Table 60: Global Commercial Otr Tires Volume K Forecast, by Country 2020 & 2033
- Table 61: Turkey Commercial Otr Tires Revenue (million) Forecast, by Application 2020 & 2033
- Table 62: Turkey Commercial Otr Tires Volume (K) Forecast, by Application 2020 & 2033
- Table 63: Israel Commercial Otr Tires Revenue (million) Forecast, by Application 2020 & 2033
- Table 64: Israel Commercial Otr Tires Volume (K) Forecast, by Application 2020 & 2033
- Table 65: GCC Commercial Otr Tires Revenue (million) Forecast, by Application 2020 & 2033
- Table 66: GCC Commercial Otr Tires Volume (K) Forecast, by Application 2020 & 2033
- Table 67: North Africa Commercial Otr Tires Revenue (million) Forecast, by Application 2020 & 2033
- Table 68: North Africa Commercial Otr Tires Volume (K) Forecast, by Application 2020 & 2033
- Table 69: South Africa Commercial Otr Tires Revenue (million) Forecast, by Application 2020 & 2033
- Table 70: South Africa Commercial Otr Tires Volume (K) Forecast, by Application 2020 & 2033
- Table 71: Rest of Middle East & Africa Commercial Otr Tires Revenue (million) Forecast, by Application 2020 & 2033
- Table 72: Rest of Middle East & Africa Commercial Otr Tires Volume (K) Forecast, by Application 2020 & 2033
- Table 73: Global Commercial Otr Tires Revenue million Forecast, by Application 2020 & 2033
- Table 74: Global Commercial Otr Tires Volume K Forecast, by Application 2020 & 2033
- Table 75: Global Commercial Otr Tires Revenue million Forecast, by Type 2020 & 2033
- Table 76: Global Commercial Otr Tires Volume K Forecast, by Type 2020 & 2033
- Table 77: Global Commercial Otr Tires Revenue million Forecast, by Country 2020 & 2033
- Table 78: Global Commercial Otr Tires Volume K Forecast, by Country 2020 & 2033
- Table 79: China Commercial Otr Tires Revenue (million) Forecast, by Application 2020 & 2033
- Table 80: China Commercial Otr Tires Volume (K) Forecast, by Application 2020 & 2033
- Table 81: India Commercial Otr Tires Revenue (million) Forecast, by Application 2020 & 2033
- Table 82: India Commercial Otr Tires Volume (K) Forecast, by Application 2020 & 2033
- Table 83: Japan Commercial Otr Tires Revenue (million) Forecast, by Application 2020 & 2033
- Table 84: Japan Commercial Otr Tires Volume (K) Forecast, by Application 2020 & 2033
- Table 85: South Korea Commercial Otr Tires Revenue (million) Forecast, by Application 2020 & 2033
- Table 86: South Korea Commercial Otr Tires Volume (K) Forecast, by Application 2020 & 2033
- Table 87: ASEAN Commercial Otr Tires Revenue (million) Forecast, by Application 2020 & 2033
- Table 88: ASEAN Commercial Otr Tires Volume (K) Forecast, by Application 2020 & 2033
- Table 89: Oceania Commercial Otr Tires Revenue (million) Forecast, by Application 2020 & 2033
- Table 90: Oceania Commercial Otr Tires Volume (K) Forecast, by Application 2020 & 2033
- Table 91: Rest of Asia Pacific Commercial Otr Tires Revenue (million) Forecast, by Application 2020 & 2033
- Table 92: Rest of Asia Pacific Commercial Otr Tires Volume (K) Forecast, by Application 2020 & 2033
Frequently Asked Questions
1. What is the projected Compound Annual Growth Rate (CAGR) of the Commercial Otr Tires?
The projected CAGR is approximately 5.1%.
2. Which companies are prominent players in the Commercial Otr Tires?
Key companies in the market include Continental, Bridgestone Corporation, MICHELIN, GOODYEAR OTR, Pirelli, Yokohama OTR, Trelleborg Wheels, Titan International, Nokian Tyres, CEAT, Double Coin Tires, Magna Tyres, Carlisle Tires, Firestone, Techking Tires, Triangle Tire, MRF Tyres, OTR Tyre, Apollo Tyres, BKT Tires, MAXXIS International, Linglong tire, Truck Tyre.
3. What are the main segments of the Commercial Otr Tires?
The market segments include Application, Type.
4. Can you provide details about the market size?
The market size is estimated to be USD 9228 million as of 2022.
5. What are some drivers contributing to market growth?
N/A
6. What are the notable trends driving market growth?
N/A
7. Are there any restraints impacting market growth?
N/A
8. Can you provide examples of recent developments in the market?
N/A
9. What pricing options are available for accessing the report?
Pricing options include single-user, multi-user, and enterprise licenses priced at USD 3950.00, USD 5925.00, and USD 7900.00 respectively.
10. Is the market size provided in terms of value or volume?
The market size is provided in terms of value, measured in million and volume, measured in K.
11. Are there any specific market keywords associated with the report?
Yes, the market keyword associated with the report is "Commercial Otr Tires," which aids in identifying and referencing the specific market segment covered.
12. How do I determine which pricing option suits my needs best?
The pricing options vary based on user requirements and access needs. Individual users may opt for single-user licenses, while businesses requiring broader access may choose multi-user or enterprise licenses for cost-effective access to the report.
13. Are there any additional resources or data provided in the Commercial Otr Tires report?
While the report offers comprehensive insights, it's advisable to review the specific contents or supplementary materials provided to ascertain if additional resources or data are available.
14. How can I stay updated on further developments or reports in the Commercial Otr Tires?
To stay informed about further developments, trends, and reports in the Commercial Otr Tires, consider subscribing to industry newsletters, following relevant companies and organizations, or regularly checking reputable industry news sources and publications.
Methodology
Step 1 - Identification of Relevant Samples Size from Population Database


Step 2 - Approaches for Defining Global Market Size (Value, Volume* & Price*)

Note*: In applicable scenarios
Step 3 - Data Sources
Primary Research
- Web Analytics
- Survey Reports
- Research Institute
- Latest Research Reports
- Opinion Leaders
Secondary Research
- Annual Reports
- White Paper
- Latest Press Release
- Industry Association
- Paid Database
- Investor Presentations

Step 4 - Data Triangulation
Involves using different sources of information in order to increase the validity of a study
These sources are likely to be stakeholders in a program - participants, other researchers, program staff, other community members, and so on.
Then we put all data in single framework & apply various statistical tools to find out the dynamic on the market.
During the analysis stage, feedback from the stakeholder groups would be compared to determine areas of agreement as well as areas of divergence