

Key Insights
The global business class seat market is poised for significant expansion, propelled by recovering air travel demand, a growing passenger inclination for premium in-flight experiences, and ongoing innovations in seat design and passenger amenities. Airlines are actively investing in elevating their offerings, especially for long-haul routes, to enhance passenger satisfaction and brand prestige. Key growth catalysts include the integration of advanced features such as advanced lie-flat seat technology, sophisticated in-flight entertainment systems, and connectivity solutions like in-seat power and Wi-Fi. The market is also influenced by a heightened emphasis on ergonomic design and the adoption of sustainable materials, reflecting airline commitments to both passenger well-being and environmental responsibility. The market size was valued at $6.83 billion in the base year 2025 and is projected to grow at a Compound Annual Growth Rate (CAGR) of 9.86%.
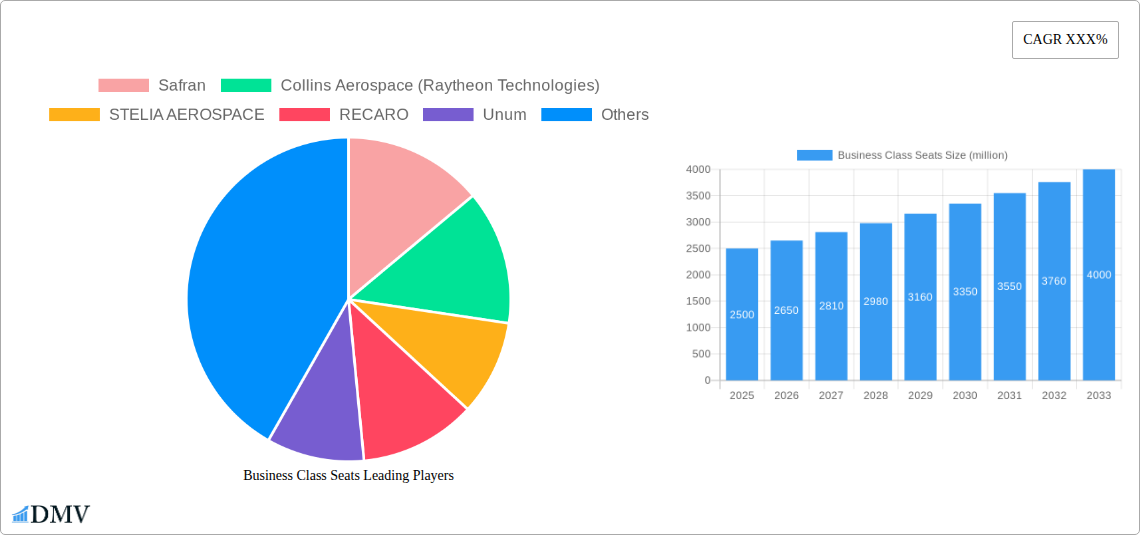
Business Class Seats Market Size (In Billion)
Leading industry participants such as Safran, Collins Aerospace, and Stelia Aerospace are at the forefront, capitalizing on their technological prowess and extensive operational networks. The competitive landscape is characterized by a mix of established giants and agile niche players dedicated to pioneering novel seat concepts. Differentiation strategies revolve around superior comfort, cutting-edge technology, and efficient production methods. Market segmentation includes variations in seat type (e.g., lie-flat, angled-flat), aircraft configuration (narrow-body, wide-body), and geographic regions. While North America and Europe currently represent major markets, the Asia-Pacific region is anticipated to experience robust growth, fueled by rising disposable incomes and an expanding affluent demographic. Potential challenges include volatile fuel prices affecting airline financial health and the inherent cyclicality of the aerospace sector, which may temper investment during economic slowdowns.

Business Class Seats Company Market Share
Business Class Seats Market Report: A Comprehensive Analysis (2019-2033)
This comprehensive report provides an in-depth analysis of the global Business Class Seats market, projecting a multi-million-dollar valuation by 2033. The study covers the period from 2019 to 2033, with a base year of 2025 and a forecast period spanning 2025-2033. We delve into market dynamics, competitive landscapes, technological advancements, and future growth prospects. This report is crucial for stakeholders seeking to understand the intricacies of this lucrative market and make informed strategic decisions.
Business Class Seats Market Composition & Trends
This section analyzes the competitive landscape, innovation drivers, and regulatory factors shaping the multi-million-dollar Business Class Seats market. We evaluate market concentration, revealing a xx% market share held by the top 5 players in 2025. Key players like Safran, Collins Aerospace, and Stelia Aerospace are driving innovation through lightweight materials and advanced ergonomics. The report also meticulously details M&A activities, with a total deal value exceeding $xx million in the historical period (2019-2024).
- Market Concentration: Top 5 players hold xx% market share (2025).
- Innovation Catalysts: Lightweight materials, advanced ergonomics, personalized in-flight entertainment systems.
- Regulatory Landscape: Stringent safety regulations and evolving airline certifications influence product development.
- Substitute Products: Limited direct substitutes, primarily focusing on variations within premium seating.
- End-User Profiles: Major airlines, private jet operators, and aircraft leasing companies.
- M&A Activities: xx major deals completed between 2019-2024, with a total value exceeding $xx million. This activity reflects consolidation and expansion within the market.
Business Class Seats Industry Evolution
The Business Class Seats market showcases significant growth from 2019 to 2033, driven by factors such as rising disposable incomes, increasing air travel, and a growing preference for enhanced passenger comfort. The report projects a Compound Annual Growth Rate (CAGR) of xx% during the forecast period (2025-2033), reaching a market value of $xx million by 2033. Technological advancements, including the integration of advanced materials, personalized entertainment systems, and improved seat adjustability, are key drivers of this growth. Shifting consumer demands, such as a preference for more spacious and comfortable seating, have also fueled market expansion. Adoption of new technologies like xx% for features such as lie-flat seats and improved climate control.
Leading Regions, Countries, or Segments in Business Class Seats
North America maintains its position as the leading region, commanding a xx% share in 2025 driven by strong domestic air travel and a robust aircraft manufacturing industry. Europe follows closely behind, with a xx% market share.
- Key Drivers for North America:
- High levels of investment in airline infrastructure and modernization.
- Stringent safety regulations stimulating innovation.
- Large base of premium air travelers.
- Key Drivers for Europe:
- Presence of major aircraft manufacturers and suppliers.
- Government support for sustainable aviation technologies.
- Strong tourism and business travel sectors.
The report further segments the market by aircraft type (wide-body vs. narrow-body) and seat type (lie-flat vs. angle-flat), providing detailed analysis of each segment's growth trajectory and key drivers. The wide-body segment is expected to contribute significantly to market revenue, driven by increasing demand for long-haul flights.
Business Class Seats Product Innovations
Recent innovations focus on enhancing passenger comfort, such as adjustable lumbar support, improved ventilation, and enhanced in-seat entertainment systems including larger screens and improved connectivity. These features aim to enhance the overall passenger experience and justify premium pricing. The integration of smart materials and advanced ergonomics is also improving passenger health and wellbeing during long-haul flights. Companies are exploring new lightweight materials for increased fuel efficiency.
Propelling Factors for Business Class Seats Growth
Several factors contribute to the market's growth. Firstly, the rise in air travel, particularly among business and high-income travelers, fuels demand for premium seating. Secondly, technological advancements, such as lighter materials and improved designs, enhance passenger comfort and reduce aircraft weight, improving fuel efficiency for airlines. Finally, regulatory measures focused on passenger safety and comfort further stimulate innovation within the industry.
Obstacles in the Business Class Seats Market
Significant challenges include supply chain disruptions impacting material availability and manufacturing timelines. This leads to increased production costs and potentially delayed deliveries. Furthermore, intense competition among manufacturers requires continuous innovation and cost optimization to maintain market share. Fluctuations in fuel prices also impact airline profitability and their investment in premium seating.
Future Opportunities in Business Class Seats
The market presents numerous opportunities. The growing demand for personalized in-flight experiences allows for innovation in customized seat features, entertainment, and connectivity. The integration of sustainable materials aligns with the increasing focus on environmentally conscious air travel. Furthermore, expanding into emerging markets with a rising middle class presents significant growth potential.
Major Players in the Business Class Seats Ecosystem
- Safran
- Collins Aerospace (Raytheon Technologies)
- STELIA AEROSPACE
- RECARO
- Unum
- Geven S.p.A
- ZIM Aircraft Seating
- Lufthansa Technik
- Vantage DUO
- Acro Aircraft Seating
- JAMCO Corporation
- HAECO
- AFI KLM E&M
- Adient Aerospace
- JPA Design
- TSI Seats
- Thompson Aero Seating
- Mirus Hawk
- Ipeco Holdings
- Pitch Aircraft Seating Systems
- AirGo Design
- Iacobucci HF Aerospace
- MAC Aero
Key Developments in Business Class Seats Industry
- 2022 Q4: Safran launched its new "Skylife" business class seat, featuring advanced ergonomics and enhanced passenger comfort.
- 2023 Q1: Collins Aerospace announced a strategic partnership with an airline to develop a fully customized business class seat with integrated technology.
- 2023 Q2: A merger between two smaller seat manufacturers resulted in an increased market share for the combined entity. (Further details on specific mergers and acquisition activities will be provided within the full report).
Strategic Business Class Seats Market Forecast
The Business Class Seats market is poised for robust growth, driven by technological advancements, a rise in air travel, and a growing preference for enhanced passenger comfort. The forecast anticipates sustained demand for premium seating options, particularly in long-haul flights. This favorable outlook creates significant opportunities for manufacturers to invest in innovation and expand their market share, while navigating the challenges presented by supply chain complexities and intensifying competition.
Business Class Seats Segmentation
-
1. Application
- 1.1. Airplane
- 1.2. High Speed Rail
- 1.3. Others
-
2. Type
- 2.1. Full-Flat Seat
- 2.2. Angled Lie-Flat
- 2.3. Cradle Seat
Business Class Seats Segmentation By Geography
-
1. North America
- 1.1. United States
- 1.2. Canada
- 1.3. Mexico
-
2. South America
- 2.1. Brazil
- 2.2. Argentina
- 2.3. Rest of South America
-
3. Europe
- 3.1. United Kingdom
- 3.2. Germany
- 3.3. France
- 3.4. Italy
- 3.5. Spain
- 3.6. Russia
- 3.7. Benelux
- 3.8. Nordics
- 3.9. Rest of Europe
-
4. Middle East & Africa
- 4.1. Turkey
- 4.2. Israel
- 4.3. GCC
- 4.4. North Africa
- 4.5. South Africa
- 4.6. Rest of Middle East & Africa
-
5. Asia Pacific
- 5.1. China
- 5.2. India
- 5.3. Japan
- 5.4. South Korea
- 5.5. ASEAN
- 5.6. Oceania
- 5.7. Rest of Asia Pacific

Business Class Seats Regional Market Share
Geographic Coverage of Business Class Seats
Business Class Seats REPORT HIGHLIGHTS
| Aspects | Details |
|---|---|
| Study Period | 2020-2034 |
| Base Year | 2025 |
| Estimated Year | 2026 |
| Forecast Period | 2026-2034 |
| Historical Period | 2020-2025 |
| Growth Rate | CAGR of 9.86% from 2020-2034 |
| Segmentation |
|
Table of Contents
- 1. Introduction
- 1.1. Research Scope
- 1.2. Market Segmentation
- 1.3. Research Methodology
- 1.4. Definitions and Assumptions
- 2. Executive Summary
- 2.1. Introduction
- 3. Market Dynamics
- 3.1. Introduction
- 3.2. Market Drivers
- 3.3. Market Restrains
- 3.4. Market Trends
- 4. Market Factor Analysis
- 4.1. Porters Five Forces
- 4.2. Supply/Value Chain
- 4.3. PESTEL analysis
- 4.4. Market Entropy
- 4.5. Patent/Trademark Analysis
- 5. Global Business Class Seats Analysis, Insights and Forecast, 2020-2032
- 5.1. Market Analysis, Insights and Forecast - by Application
- 5.1.1. Airplane
- 5.1.2. High Speed Rail
- 5.1.3. Others
- 5.2. Market Analysis, Insights and Forecast - by Type
- 5.2.1. Full-Flat Seat
- 5.2.2. Angled Lie-Flat
- 5.2.3. Cradle Seat
- 5.3. Market Analysis, Insights and Forecast - by Region
- 5.3.1. North America
- 5.3.2. South America
- 5.3.3. Europe
- 5.3.4. Middle East & Africa
- 5.3.5. Asia Pacific
- 5.1. Market Analysis, Insights and Forecast - by Application
- 6. North America Business Class Seats Analysis, Insights and Forecast, 2020-2032
- 6.1. Market Analysis, Insights and Forecast - by Application
- 6.1.1. Airplane
- 6.1.2. High Speed Rail
- 6.1.3. Others
- 6.2. Market Analysis, Insights and Forecast - by Type
- 6.2.1. Full-Flat Seat
- 6.2.2. Angled Lie-Flat
- 6.2.3. Cradle Seat
- 6.1. Market Analysis, Insights and Forecast - by Application
- 7. South America Business Class Seats Analysis, Insights and Forecast, 2020-2032
- 7.1. Market Analysis, Insights and Forecast - by Application
- 7.1.1. Airplane
- 7.1.2. High Speed Rail
- 7.1.3. Others
- 7.2. Market Analysis, Insights and Forecast - by Type
- 7.2.1. Full-Flat Seat
- 7.2.2. Angled Lie-Flat
- 7.2.3. Cradle Seat
- 7.1. Market Analysis, Insights and Forecast - by Application
- 8. Europe Business Class Seats Analysis, Insights and Forecast, 2020-2032
- 8.1. Market Analysis, Insights and Forecast - by Application
- 8.1.1. Airplane
- 8.1.2. High Speed Rail
- 8.1.3. Others
- 8.2. Market Analysis, Insights and Forecast - by Type
- 8.2.1. Full-Flat Seat
- 8.2.2. Angled Lie-Flat
- 8.2.3. Cradle Seat
- 8.1. Market Analysis, Insights and Forecast - by Application
- 9. Middle East & Africa Business Class Seats Analysis, Insights and Forecast, 2020-2032
- 9.1. Market Analysis, Insights and Forecast - by Application
- 9.1.1. Airplane
- 9.1.2. High Speed Rail
- 9.1.3. Others
- 9.2. Market Analysis, Insights and Forecast - by Type
- 9.2.1. Full-Flat Seat
- 9.2.2. Angled Lie-Flat
- 9.2.3. Cradle Seat
- 9.1. Market Analysis, Insights and Forecast - by Application
- 10. Asia Pacific Business Class Seats Analysis, Insights and Forecast, 2020-2032
- 10.1. Market Analysis, Insights and Forecast - by Application
- 10.1.1. Airplane
- 10.1.2. High Speed Rail
- 10.1.3. Others
- 10.2. Market Analysis, Insights and Forecast - by Type
- 10.2.1. Full-Flat Seat
- 10.2.2. Angled Lie-Flat
- 10.2.3. Cradle Seat
- 10.1. Market Analysis, Insights and Forecast - by Application
- 11. Competitive Analysis
- 11.1. Global Market Share Analysis 2025
- 11.2. Company Profiles
- 11.2.1 Safran
- 11.2.1.1. Overview
- 11.2.1.2. Products
- 11.2.1.3. SWOT Analysis
- 11.2.1.4. Recent Developments
- 11.2.1.5. Financials (Based on Availability)
- 11.2.2 Collins Aerospace (Raytheon Technologies)
- 11.2.2.1. Overview
- 11.2.2.2. Products
- 11.2.2.3. SWOT Analysis
- 11.2.2.4. Recent Developments
- 11.2.2.5. Financials (Based on Availability)
- 11.2.3 STELIA AEROSPACE
- 11.2.3.1. Overview
- 11.2.3.2. Products
- 11.2.3.3. SWOT Analysis
- 11.2.3.4. Recent Developments
- 11.2.3.5. Financials (Based on Availability)
- 11.2.4 RECARO
- 11.2.4.1. Overview
- 11.2.4.2. Products
- 11.2.4.3. SWOT Analysis
- 11.2.4.4. Recent Developments
- 11.2.4.5. Financials (Based on Availability)
- 11.2.5 Unum
- 11.2.5.1. Overview
- 11.2.5.2. Products
- 11.2.5.3. SWOT Analysis
- 11.2.5.4. Recent Developments
- 11.2.5.5. Financials (Based on Availability)
- 11.2.6 Geven S.p.A
- 11.2.6.1. Overview
- 11.2.6.2. Products
- 11.2.6.3. SWOT Analysis
- 11.2.6.4. Recent Developments
- 11.2.6.5. Financials (Based on Availability)
- 11.2.7 ZIM Aircraft Seating
- 11.2.7.1. Overview
- 11.2.7.2. Products
- 11.2.7.3. SWOT Analysis
- 11.2.7.4. Recent Developments
- 11.2.7.5. Financials (Based on Availability)
- 11.2.8 Lufthansa Technik
- 11.2.8.1. Overview
- 11.2.8.2. Products
- 11.2.8.3. SWOT Analysis
- 11.2.8.4. Recent Developments
- 11.2.8.5. Financials (Based on Availability)
- 11.2.9 Vantage DUO
- 11.2.9.1. Overview
- 11.2.9.2. Products
- 11.2.9.3. SWOT Analysis
- 11.2.9.4. Recent Developments
- 11.2.9.5. Financials (Based on Availability)
- 11.2.10 Acro Aircraft Seating
- 11.2.10.1. Overview
- 11.2.10.2. Products
- 11.2.10.3. SWOT Analysis
- 11.2.10.4. Recent Developments
- 11.2.10.5. Financials (Based on Availability)
- 11.2.11 JAMCO Corporation
- 11.2.11.1. Overview
- 11.2.11.2. Products
- 11.2.11.3. SWOT Analysis
- 11.2.11.4. Recent Developments
- 11.2.11.5. Financials (Based on Availability)
- 11.2.12 HAECO
- 11.2.12.1. Overview
- 11.2.12.2. Products
- 11.2.12.3. SWOT Analysis
- 11.2.12.4. Recent Developments
- 11.2.12.5. Financials (Based on Availability)
- 11.2.13 AFI KLM E&M
- 11.2.13.1. Overview
- 11.2.13.2. Products
- 11.2.13.3. SWOT Analysis
- 11.2.13.4. Recent Developments
- 11.2.13.5. Financials (Based on Availability)
- 11.2.14 Adient Aerospace
- 11.2.14.1. Overview
- 11.2.14.2. Products
- 11.2.14.3. SWOT Analysis
- 11.2.14.4. Recent Developments
- 11.2.14.5. Financials (Based on Availability)
- 11.2.15 JPA Design
- 11.2.15.1. Overview
- 11.2.15.2. Products
- 11.2.15.3. SWOT Analysis
- 11.2.15.4. Recent Developments
- 11.2.15.5. Financials (Based on Availability)
- 11.2.16 TSI Seats
- 11.2.16.1. Overview
- 11.2.16.2. Products
- 11.2.16.3. SWOT Analysis
- 11.2.16.4. Recent Developments
- 11.2.16.5. Financials (Based on Availability)
- 11.2.17 Thompson Aero Seating
- 11.2.17.1. Overview
- 11.2.17.2. Products
- 11.2.17.3. SWOT Analysis
- 11.2.17.4. Recent Developments
- 11.2.17.5. Financials (Based on Availability)
- 11.2.18 Mirus Hawk
- 11.2.18.1. Overview
- 11.2.18.2. Products
- 11.2.18.3. SWOT Analysis
- 11.2.18.4. Recent Developments
- 11.2.18.5. Financials (Based on Availability)
- 11.2.19 Ipeco Holdings
- 11.2.19.1. Overview
- 11.2.19.2. Products
- 11.2.19.3. SWOT Analysis
- 11.2.19.4. Recent Developments
- 11.2.19.5. Financials (Based on Availability)
- 11.2.20 Pitch Aircraft Seating Systems
- 11.2.20.1. Overview
- 11.2.20.2. Products
- 11.2.20.3. SWOT Analysis
- 11.2.20.4. Recent Developments
- 11.2.20.5. Financials (Based on Availability)
- 11.2.21 AirGo Design
- 11.2.21.1. Overview
- 11.2.21.2. Products
- 11.2.21.3. SWOT Analysis
- 11.2.21.4. Recent Developments
- 11.2.21.5. Financials (Based on Availability)
- 11.2.22 Iacobucci HF Aerospace
- 11.2.22.1. Overview
- 11.2.22.2. Products
- 11.2.22.3. SWOT Analysis
- 11.2.22.4. Recent Developments
- 11.2.22.5. Financials (Based on Availability)
- 11.2.23 MAC Aero
- 11.2.23.1. Overview
- 11.2.23.2. Products
- 11.2.23.3. SWOT Analysis
- 11.2.23.4. Recent Developments
- 11.2.23.5. Financials (Based on Availability)
- 11.2.1 Safran
List of Figures
- Figure 1: Global Business Class Seats Revenue Breakdown (billion, %) by Region 2025 & 2033
- Figure 2: North America Business Class Seats Revenue (billion), by Application 2025 & 2033
- Figure 3: North America Business Class Seats Revenue Share (%), by Application 2025 & 2033
- Figure 4: North America Business Class Seats Revenue (billion), by Type 2025 & 2033
- Figure 5: North America Business Class Seats Revenue Share (%), by Type 2025 & 2033
- Figure 6: North America Business Class Seats Revenue (billion), by Country 2025 & 2033
- Figure 7: North America Business Class Seats Revenue Share (%), by Country 2025 & 2033
- Figure 8: South America Business Class Seats Revenue (billion), by Application 2025 & 2033
- Figure 9: South America Business Class Seats Revenue Share (%), by Application 2025 & 2033
- Figure 10: South America Business Class Seats Revenue (billion), by Type 2025 & 2033
- Figure 11: South America Business Class Seats Revenue Share (%), by Type 2025 & 2033
- Figure 12: South America Business Class Seats Revenue (billion), by Country 2025 & 2033
- Figure 13: South America Business Class Seats Revenue Share (%), by Country 2025 & 2033
- Figure 14: Europe Business Class Seats Revenue (billion), by Application 2025 & 2033
- Figure 15: Europe Business Class Seats Revenue Share (%), by Application 2025 & 2033
- Figure 16: Europe Business Class Seats Revenue (billion), by Type 2025 & 2033
- Figure 17: Europe Business Class Seats Revenue Share (%), by Type 2025 & 2033
- Figure 18: Europe Business Class Seats Revenue (billion), by Country 2025 & 2033
- Figure 19: Europe Business Class Seats Revenue Share (%), by Country 2025 & 2033
- Figure 20: Middle East & Africa Business Class Seats Revenue (billion), by Application 2025 & 2033
- Figure 21: Middle East & Africa Business Class Seats Revenue Share (%), by Application 2025 & 2033
- Figure 22: Middle East & Africa Business Class Seats Revenue (billion), by Type 2025 & 2033
- Figure 23: Middle East & Africa Business Class Seats Revenue Share (%), by Type 2025 & 2033
- Figure 24: Middle East & Africa Business Class Seats Revenue (billion), by Country 2025 & 2033
- Figure 25: Middle East & Africa Business Class Seats Revenue Share (%), by Country 2025 & 2033
- Figure 26: Asia Pacific Business Class Seats Revenue (billion), by Application 2025 & 2033
- Figure 27: Asia Pacific Business Class Seats Revenue Share (%), by Application 2025 & 2033
- Figure 28: Asia Pacific Business Class Seats Revenue (billion), by Type 2025 & 2033
- Figure 29: Asia Pacific Business Class Seats Revenue Share (%), by Type 2025 & 2033
- Figure 30: Asia Pacific Business Class Seats Revenue (billion), by Country 2025 & 2033
- Figure 31: Asia Pacific Business Class Seats Revenue Share (%), by Country 2025 & 2033
List of Tables
- Table 1: Global Business Class Seats Revenue billion Forecast, by Application 2020 & 2033
- Table 2: Global Business Class Seats Revenue billion Forecast, by Type 2020 & 2033
- Table 3: Global Business Class Seats Revenue billion Forecast, by Region 2020 & 2033
- Table 4: Global Business Class Seats Revenue billion Forecast, by Application 2020 & 2033
- Table 5: Global Business Class Seats Revenue billion Forecast, by Type 2020 & 2033
- Table 6: Global Business Class Seats Revenue billion Forecast, by Country 2020 & 2033
- Table 7: United States Business Class Seats Revenue (billion) Forecast, by Application 2020 & 2033
- Table 8: Canada Business Class Seats Revenue (billion) Forecast, by Application 2020 & 2033
- Table 9: Mexico Business Class Seats Revenue (billion) Forecast, by Application 2020 & 2033
- Table 10: Global Business Class Seats Revenue billion Forecast, by Application 2020 & 2033
- Table 11: Global Business Class Seats Revenue billion Forecast, by Type 2020 & 2033
- Table 12: Global Business Class Seats Revenue billion Forecast, by Country 2020 & 2033
- Table 13: Brazil Business Class Seats Revenue (billion) Forecast, by Application 2020 & 2033
- Table 14: Argentina Business Class Seats Revenue (billion) Forecast, by Application 2020 & 2033
- Table 15: Rest of South America Business Class Seats Revenue (billion) Forecast, by Application 2020 & 2033
- Table 16: Global Business Class Seats Revenue billion Forecast, by Application 2020 & 2033
- Table 17: Global Business Class Seats Revenue billion Forecast, by Type 2020 & 2033
- Table 18: Global Business Class Seats Revenue billion Forecast, by Country 2020 & 2033
- Table 19: United Kingdom Business Class Seats Revenue (billion) Forecast, by Application 2020 & 2033
- Table 20: Germany Business Class Seats Revenue (billion) Forecast, by Application 2020 & 2033
- Table 21: France Business Class Seats Revenue (billion) Forecast, by Application 2020 & 2033
- Table 22: Italy Business Class Seats Revenue (billion) Forecast, by Application 2020 & 2033
- Table 23: Spain Business Class Seats Revenue (billion) Forecast, by Application 2020 & 2033
- Table 24: Russia Business Class Seats Revenue (billion) Forecast, by Application 2020 & 2033
- Table 25: Benelux Business Class Seats Revenue (billion) Forecast, by Application 2020 & 2033
- Table 26: Nordics Business Class Seats Revenue (billion) Forecast, by Application 2020 & 2033
- Table 27: Rest of Europe Business Class Seats Revenue (billion) Forecast, by Application 2020 & 2033
- Table 28: Global Business Class Seats Revenue billion Forecast, by Application 2020 & 2033
- Table 29: Global Business Class Seats Revenue billion Forecast, by Type 2020 & 2033
- Table 30: Global Business Class Seats Revenue billion Forecast, by Country 2020 & 2033
- Table 31: Turkey Business Class Seats Revenue (billion) Forecast, by Application 2020 & 2033
- Table 32: Israel Business Class Seats Revenue (billion) Forecast, by Application 2020 & 2033
- Table 33: GCC Business Class Seats Revenue (billion) Forecast, by Application 2020 & 2033
- Table 34: North Africa Business Class Seats Revenue (billion) Forecast, by Application 2020 & 2033
- Table 35: South Africa Business Class Seats Revenue (billion) Forecast, by Application 2020 & 2033
- Table 36: Rest of Middle East & Africa Business Class Seats Revenue (billion) Forecast, by Application 2020 & 2033
- Table 37: Global Business Class Seats Revenue billion Forecast, by Application 2020 & 2033
- Table 38: Global Business Class Seats Revenue billion Forecast, by Type 2020 & 2033
- Table 39: Global Business Class Seats Revenue billion Forecast, by Country 2020 & 2033
- Table 40: China Business Class Seats Revenue (billion) Forecast, by Application 2020 & 2033
- Table 41: India Business Class Seats Revenue (billion) Forecast, by Application 2020 & 2033
- Table 42: Japan Business Class Seats Revenue (billion) Forecast, by Application 2020 & 2033
- Table 43: South Korea Business Class Seats Revenue (billion) Forecast, by Application 2020 & 2033
- Table 44: ASEAN Business Class Seats Revenue (billion) Forecast, by Application 2020 & 2033
- Table 45: Oceania Business Class Seats Revenue (billion) Forecast, by Application 2020 & 2033
- Table 46: Rest of Asia Pacific Business Class Seats Revenue (billion) Forecast, by Application 2020 & 2033
Frequently Asked Questions
1. What is the projected Compound Annual Growth Rate (CAGR) of the Business Class Seats?
The projected CAGR is approximately 9.86%.
2. Which companies are prominent players in the Business Class Seats?
Key companies in the market include Safran, Collins Aerospace (Raytheon Technologies), STELIA AEROSPACE, RECARO, Unum, Geven S.p.A, ZIM Aircraft Seating, Lufthansa Technik, Vantage DUO, Acro Aircraft Seating, JAMCO Corporation, HAECO, AFI KLM E&M, Adient Aerospace, JPA Design, TSI Seats, Thompson Aero Seating, Mirus Hawk, Ipeco Holdings, Pitch Aircraft Seating Systems, AirGo Design, Iacobucci HF Aerospace, MAC Aero.
3. What are the main segments of the Business Class Seats?
The market segments include Application, Type.
4. Can you provide details about the market size?
The market size is estimated to be USD 6.83 billion as of 2022.
5. What are some drivers contributing to market growth?
N/A
6. What are the notable trends driving market growth?
N/A
7. Are there any restraints impacting market growth?
N/A
8. Can you provide examples of recent developments in the market?
N/A
9. What pricing options are available for accessing the report?
Pricing options include single-user, multi-user, and enterprise licenses priced at USD 4250.00, USD 6375.00, and USD 8500.00 respectively.
10. Is the market size provided in terms of value or volume?
The market size is provided in terms of value, measured in billion.
11. Are there any specific market keywords associated with the report?
Yes, the market keyword associated with the report is "Business Class Seats," which aids in identifying and referencing the specific market segment covered.
12. How do I determine which pricing option suits my needs best?
The pricing options vary based on user requirements and access needs. Individual users may opt for single-user licenses, while businesses requiring broader access may choose multi-user or enterprise licenses for cost-effective access to the report.
13. Are there any additional resources or data provided in the Business Class Seats report?
While the report offers comprehensive insights, it's advisable to review the specific contents or supplementary materials provided to ascertain if additional resources or data are available.
14. How can I stay updated on further developments or reports in the Business Class Seats?
To stay informed about further developments, trends, and reports in the Business Class Seats, consider subscribing to industry newsletters, following relevant companies and organizations, or regularly checking reputable industry news sources and publications.
Methodology
Step 1 - Identification of Relevant Samples Size from Population Database


Step 2 - Approaches for Defining Global Market Size (Value, Volume* & Price*)

Note*: In applicable scenarios
Step 3 - Data Sources
Primary Research
- Web Analytics
- Survey Reports
- Research Institute
- Latest Research Reports
- Opinion Leaders
Secondary Research
- Annual Reports
- White Paper
- Latest Press Release
- Industry Association
- Paid Database
- Investor Presentations

Step 4 - Data Triangulation
Involves using different sources of information in order to increase the validity of a study
These sources are likely to be stakeholders in a program - participants, other researchers, program staff, other community members, and so on.
Then we put all data in single framework & apply various statistical tools to find out the dynamic on the market.
During the analysis stage, feedback from the stakeholder groups would be compared to determine areas of agreement as well as areas of divergence