

Key Insights
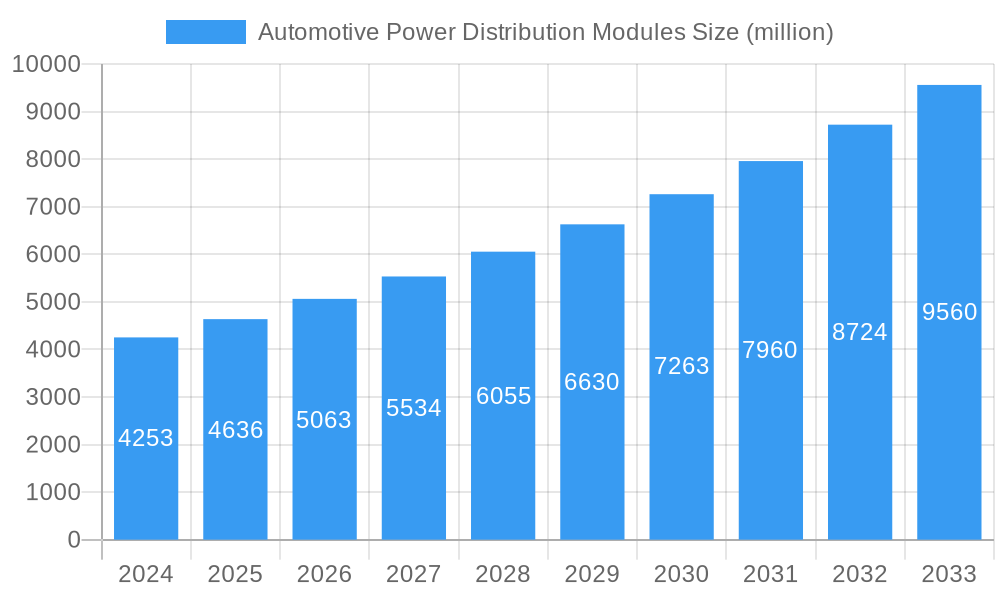
The global Automotive Power Distribution Modules market is poised for substantial growth, projected to reach an estimated market size of approximately $4,636 million by 2025, with a compelling Compound Annual Growth Rate (CAGR) of around 9%. This robust expansion is primarily driven by the escalating demand for advanced vehicle electronics and the increasing integration of sophisticated safety and infotainment systems in both passenger cars and commercial vehicles. As automotive manufacturers continue to prioritize fuel efficiency and emission reduction, there's a concurrent push towards electrification and hybridization, necessitating more complex and efficient power management solutions. This trend, coupled with the growing sophistication of autonomous driving technologies, is further fueling the adoption of advanced power distribution modules that offer enhanced control, reliability, and flexibility. The market is witnessing a clear shift towards configurable modules that can be adapted to a wider range of vehicle architectures and functionalities, offering significant advantages over traditional hardwired solutions in terms of scalability and cost-effectiveness.
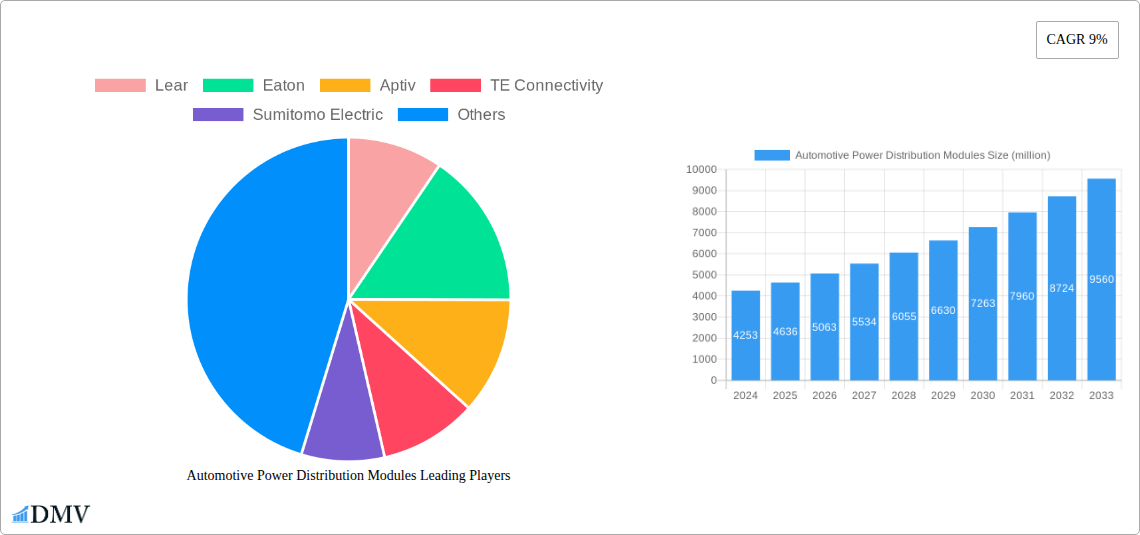
Automotive Power Distribution Modules Market Size (In Billion)
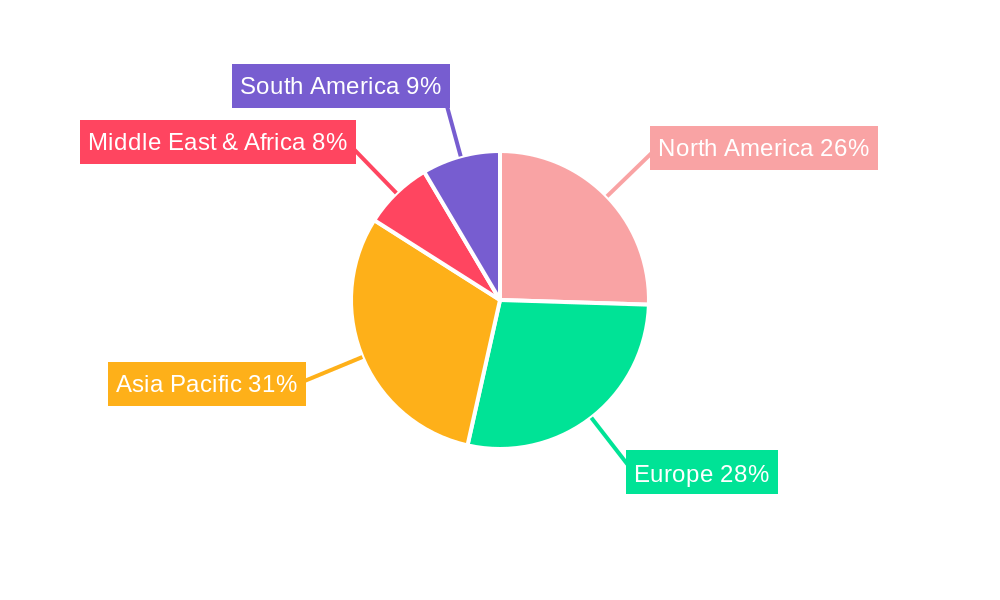
The industry landscape is characterized by intense competition and innovation, with key players like Lear, Eaton, Aptiv, TE Connectivity, and Yazaki leading the charge in developing next-generation power distribution technologies. While the market benefits from strong growth drivers, it also faces certain restraints. The increasing complexity of electrical architectures can lead to higher development costs and longer lead times for new module designs. Furthermore, stringent automotive regulations regarding safety and electromagnetic compatibility (EMC) require rigorous testing and validation, adding to the overall expense. Geographically, North America and Europe are expected to remain dominant markets, driven by their advanced automotive industries and early adoption of new technologies. However, the Asia Pacific region, particularly China and India, is anticipated to exhibit the fastest growth due to its burgeoning automotive production and increasing consumer demand for feature-rich vehicles. The ongoing evolution of electric vehicles (EVs) and the continuous innovation in automotive electronics will continue to shape the trajectory of the power distribution modules market in the coming years.
Automotive Power Distribution Modules Company Market Share
Automotive Power Distribution Modules Market Composition & Trends
The global automotive power distribution module (PDM) market is characterized by a dynamic landscape, shaped by increasing vehicle electrification, stringent safety regulations, and evolving OEM demands for integrated and intelligent electrical systems. Market concentration is moderately fragmented, with key players like Lear, Eaton, Aptiv, TE Connectivity, and Sumitomo Electric holding significant shares. Innovation catalysts are primarily driven by the need for lighter, more compact, and highly configurable PDMs to accommodate the growing complexity of vehicle architectures, particularly in the realm of Advanced Driver-Assistance Systems (ADAS) and electric vehicle (EV) powertrains. Regulatory landscapes, including evolving emissions standards and safety mandates, indirectly influence PDM design by pushing for greater efficiency and reliability in electrical systems. Substitute products are limited, as PDMs serve a fundamental and integrated role in vehicle electrical systems. End-user profiles range from mass-market passenger car manufacturers seeking cost-effective and scalable solutions to premium and commercial vehicle makers demanding high-performance, feature-rich, and highly reliable PDMs. Mergers and acquisitions (M&A) activity is a significant trend, with deal values estimated to exceed $100 million annually, as larger players aim to consolidate their market position, acquire new technologies, and expand their product portfolios. For instance, acquisitions often focus on companies with expertise in high-voltage PDMs for EVs or advanced software integration capabilities for intelligent PDM functionalities.
- Market Share Distribution: Fragmented with major players like Lear, Eaton, Aptiv, TE Connectivity, and Sumitomo Electric dominating significant portions.
- M&A Deal Values: Estimated to exceed $100 million annually, driven by strategic acquisitions for technology and market expansion.
- Innovation Catalysts: Vehicle electrification, ADAS integration, lightweighting initiatives, and demand for smart power management.
- Regulatory Influence: Indirect impact through emissions standards, safety regulations, and EV adoption incentives.
Automotive Power Distribution Modules Industry Evolution
The automotive power distribution module market has undergone a significant transformation throughout the historical period (2019-2024) and is poised for accelerated growth in the forecast period (2025-2033). Driven by the relentless pursuit of vehicle safety, efficiency, and the integration of sophisticated electronic features, PDMs have evolved from simple fuse and relay boxes to complex intelligent modules. During the historical period, the market experienced steady growth, with an estimated CAGR of 6.5%, propelled by increasing vehicle production volumes and the rising content of electronic components per vehicle. The base year (2025) serves as a pivotal point, with market revenues projected to reach $15,000 million. Technological advancements have been a constant theme, moving from basic hardwired solutions towards highly configurable and software-controlled PDMs. The advent of electric vehicles (EVs) has been a major disruptive force, demanding more robust, higher voltage, and intelligently managed power distribution systems. This has led to the development of specialized PDMs for EV powertrains, battery management systems (BMS), and charging infrastructure. Shifting consumer demands for enhanced in-car experiences, seamless connectivity, and advanced driver-assistance systems (ADAS) have further fueled the need for sophisticated power distribution solutions. The adoption of smart PDMs, capable of diagnostics, predictive maintenance, and remote monitoring, is steadily increasing, with adoption metrics for such features projected to rise from approximately 20% in 2024 to over 60% by 2033. The study period (2019-2033) encapsulates this transformative journey, showcasing a market that is not only growing in size but also in technological sophistication and strategic importance within the automotive ecosystem. The estimated year (2025) anticipates a robust market performance, laying the groundwork for sustained expansion driven by innovation and the ongoing evolution of automotive technology. The continued integration of power electronics, advanced sensor networks, and the increasing complexity of vehicle electrical architectures will continue to be primary growth trajectories.
Leading Regions, Countries, or Segments in Automotive Power Distribution Modules
The automotive power distribution module (PDM) market is experiencing dominant growth and innovation across several key regions and segments. From an application perspective, the Passenger Car segment is the largest and most influential, accounting for an estimated 75% of the total market share in 2025, projected to reach $11,250 million. This dominance is driven by higher global production volumes of passenger vehicles and the increasing proliferation of complex electronic features such as infotainment systems, ADAS, and advanced lighting solutions within these vehicles. In terms of PDM types, Configurable modules are rapidly gaining prominence over traditional Hardwired solutions. By 2025, configurable PDMs are expected to capture approximately 60% of the market revenue, valued at $9,000 million. This shift is fueled by the need for greater flexibility and adaptability in vehicle electrical architectures, allowing OEMs to tailor power distribution to specific trim levels and optional features without redesigning the entire module. The Asia-Pacific region stands out as the leading geographical market for automotive PDMs, with an estimated market size of $5,000 million in 2025, projected to grow at a CAGR of 7.8% through 2033. Key countries within this region, particularly China, Japan, and South Korea, are significant automotive manufacturing hubs and early adopters of advanced automotive technologies. Investment trends in this region are heavily focused on R&D for EV components and smart manufacturing processes. Regulatory support, including government incentives for electric vehicle adoption and local content policies, further bolsters the demand for advanced PDMs. The Commercial Vehicle segment, while smaller, is experiencing rapid growth, with an estimated market value of $3,750 million in 2025 and a projected CAGR of 7.2%, driven by increasing electrification of fleets, the adoption of autonomous driving technologies, and the demand for enhanced safety and connectivity features in trucks and buses.
- Dominant Application Segment: Passenger Car, accounting for an estimated 75% of market share in 2025.
- Key Drivers: High global production volumes, increasing electronic content (ADAS, infotainment, lighting).
- Investment Trends: Focus on scalable and cost-effective solutions for mass-market vehicles.
- Dominant PDM Type: Configurable Modules, capturing an estimated 60% of market share in 2025.
- Key Drivers: Flexibility for varying vehicle configurations, quicker development cycles, reduced complexity.
- Technological Advancements: Integration of microcontrollers and software for dynamic power management.
- Leading Geographical Region: Asia-Pacific, with an estimated market size of $5,000 million in 2025.
- Key Drivers: Major automotive manufacturing hubs (China, Japan, South Korea), strong EV adoption, supportive government policies.
- Investment Trends: Significant R&D in EV power electronics and intelligent vehicle systems.
- Emerging Segment Growth: Commercial Vehicles exhibiting strong growth due to fleet electrification and advanced feature integration.
- Key Drivers: Demand for reliable power solutions for heavy-duty applications, fleet efficiency mandates.
Automotive Power Distribution Modules Product Innovations
Automotive Power Distribution Modules (PDMs) are witnessing remarkable product innovations, driven by the relentless pursuit of enhanced efficiency, safety, and integration. Key advancements include the development of highly configurable PDMs that leverage advanced microcontrollers and software algorithms to dynamically manage power distribution, optimize energy usage, and enable remote diagnostics. These intelligent modules offer unique selling propositions such as reduced wiring harness complexity, significant weight savings, and improved fault detection capabilities, contributing to a projected efficiency gain of up to 5% in electrical system power consumption. Innovations in high-voltage PDMs for electric vehicles (EVs) are also prominent, featuring robust thermal management systems and enhanced overcurrent protection to safely handle the demanding power requirements of EV powertrains and battery packs. Performance metrics for these next-generation PDMs include faster switching speeds, higher power density, and extended operational lifespans, with some modules now rated for up to 1000V and 200A continuous current.
Propelling Factors for Automotive Power Distribution Modules Growth
The automotive power distribution module market is experiencing robust growth propelled by a confluence of technological, economic, and regulatory factors. The accelerating trend of vehicle electrification is a primary driver, necessitating more sophisticated and higher-voltage PDMs for battery management, power conversion, and charging systems. The increasing integration of Advanced Driver-Assistance Systems (ADAS) and autonomous driving technologies introduces a growing demand for reliable and intelligent power distribution to support complex sensor arrays and processing units. Furthermore, the ongoing trend of vehicle lightweighting and modular design encourages the adoption of integrated PDMs, reducing the overall wire harness complexity and weight. Government regulations aimed at improving fuel efficiency and reducing emissions indirectly boost PDM demand by pushing for optimized electrical system performance. Economic factors, such as rising disposable incomes and the growing global middle class, are contributing to increased vehicle sales, further fueling market expansion.
Obstacles in the Automotive Power Distribution Modules Market
Despite the strong growth trajectory, the automotive power distribution module market faces several significant obstacles. Regulatory challenges, particularly the complex and evolving safety standards across different global regions, can lead to extended product development cycles and increased compliance costs for manufacturers. Supply chain disruptions, exacerbated by geopolitical instability and shortages of critical raw materials such as rare earth elements and advanced semiconductors, can impact production timelines and increase component costs, potentially leading to price volatility. The highly competitive nature of the market, characterized by established players and new entrants, exerts continuous pricing pressure on manufacturers, impacting profit margins. Furthermore, the increasing complexity of integrated PDMs requires substantial upfront investment in research and development, posing a barrier for smaller companies to compete effectively.
Future Opportunities in Automotive Power Distribution Modules
The automotive power distribution module market is ripe with future opportunities, largely driven by emerging technological trends and evolving consumer preferences. The continued expansion of the electric vehicle (EV) market presents a significant avenue for growth, with a growing demand for specialized PDMs designed for higher voltages, advanced battery management, and efficient power flow. The increasing adoption of connected car technologies and the development of Vehicle-to-Everything (V2X) communication systems will necessitate more sophisticated PDMs with integrated communication capabilities and enhanced cybersecurity features. The burgeoning autonomous driving sector will also drive demand for highly reliable and redundant power distribution solutions to ensure the safe operation of critical vehicle functions. Furthermore, opportunities exist in developing smart PDMs that offer predictive maintenance capabilities, enabling proactive issue identification and reducing vehicle downtime. The growing emphasis on sustainability and circular economy principles may also lead to innovations in modular PDM designs that facilitate easier repair, recycling, and upgradeability.
Major Players in the Automotive Power Distribution Modules Ecosystem
- Lear
- Eaton
- Aptiv
- TE Connectivity
- Sumitomo Electric
- Leoni
- Furukawa Electric
- Draxlmaier Group
- Fujikura Ltd.
- MTA S.p.A.
- Littelfuse
- Yazaki Corporation
- Motherson Group
- MIND Energy
- Continental AG
- Curtiss-Wright
- MOLEAD
Key Developments in Automotive Power Distribution Modules Industry
- 2023/Q4: Aptiv launches new intelligent power distribution modules with advanced cybersecurity features for connected vehicles.
- 2023/Q3: Eaton announces strategic partnership with a leading EV battery manufacturer to co-develop high-voltage PDMs.
- 2023/Q2: TE Connectivity expands its portfolio of configurable PDMs, offering greater flexibility for OEMs.
- 2023/Q1: Lear invests heavily in R&D for next-generation PDMs supporting Level 4 and Level 5 autonomous driving.
- 2022/Q4: Sumitomo Electric showcases innovative lightweight PDMs for mass-market EVs.
- 2022/Q3: Leoni develops advanced thermal management solutions for PDMs in high-performance EVs.
- 2022/Q2: Littelfuse introduces new overcurrent protection solutions integrated into its PDM offerings.
- 2022/Q1: Yazaki Corporation focuses on modular PDM designs for enhanced serviceability and recyclability.
- 2021/Q4: Continental AG announces its entry into the advanced PDM market for commercial vehicles.
- 2021/Q3: Motherson Group expands its manufacturing capabilities for intelligent PDMs.
- 2021/Q2: Fujikura Ltd. highlights its expertise in high-density wiring for compact PDMs.
- 2021/Q1: MTA S.p.A. showcases integrated power distribution solutions for hybrid vehicles.
- 2020/Q4: Furukawa Electric emphasizes the durability and reliability of its PDMs in harsh automotive environments.
- 2020/Q3: Draxlmaier Group integrates advanced diagnostics into its PDM offerings.
- 2020/Q2: Curtiss-Wright focuses on high-reliability PDMs for niche automotive applications.
- 2020/Q1: MOLEAD introduces innovative material solutions for enhanced PDM performance.
Strategic Automotive Power Distribution Modules Market Forecast
The strategic automotive power distribution module market forecast points towards a period of sustained and accelerated growth, driven by the accelerating pace of automotive electrification and the increasing complexity of in-vehicle electronic systems. The widespread adoption of electric vehicles (EVs) will continue to be a primary growth catalyst, demanding sophisticated and robust PDMs capable of handling high-voltage power distribution and advanced battery management. The proliferation of Advanced Driver-Assistance Systems (ADAS) and the move towards autonomous driving will further necessitate intelligent and reliable power solutions, creating significant market potential. The ongoing trend of vehicle lightweighting and modularization, coupled with government initiatives promoting sustainability and emission reductions, will also contribute to the demand for integrated and efficient PDMs. Emerging opportunities in connected car technologies and V2X communication will also drive innovation and market expansion.
Automotive Power Distribution Modules Segmentation
-
1. Application
- 1.1. Passenger Car
- 1.2. Commercial Vehicle
-
2. Types
- 2.1. Hardwired
- 2.2. Configurable
Automotive Power Distribution Modules Segmentation By Geography
-
1. North America
- 1.1. United States
- 1.2. Canada
- 1.3. Mexico
-
2. South America
- 2.1. Brazil
- 2.2. Argentina
- 2.3. Rest of South America
-
3. Europe
- 3.1. United Kingdom
- 3.2. Germany
- 3.3. France
- 3.4. Italy
- 3.5. Spain
- 3.6. Russia
- 3.7. Benelux
- 3.8. Nordics
- 3.9. Rest of Europe
-
4. Middle East & Africa
- 4.1. Turkey
- 4.2. Israel
- 4.3. GCC
- 4.4. North Africa
- 4.5. South Africa
- 4.6. Rest of Middle East & Africa
-
5. Asia Pacific
- 5.1. China
- 5.2. India
- 5.3. Japan
- 5.4. South Korea
- 5.5. ASEAN
- 5.6. Oceania
- 5.7. Rest of Asia Pacific
Automotive Power Distribution Modules Regional Market Share
Geographic Coverage of Automotive Power Distribution Modules
Automotive Power Distribution Modules REPORT HIGHLIGHTS
| Aspects | Details |
|---|---|
| Study Period | 2020-2034 |
| Base Year | 2025 |
| Estimated Year | 2026 |
| Forecast Period | 2026-2034 |
| Historical Period | 2020-2025 |
| Growth Rate | CAGR of 9% from 2020-2034 |
| Segmentation |
|
Table of Contents
- 1. Introduction
- 1.1. Research Scope
- 1.2. Market Segmentation
- 1.3. Research Methodology
- 1.4. Definitions and Assumptions
- 2. Executive Summary
- 2.1. Introduction
- 3. Market Dynamics
- 3.1. Introduction
- 3.2. Market Drivers
- 3.3. Market Restrains
- 3.4. Market Trends
- 4. Market Factor Analysis
- 4.1. Porters Five Forces
- 4.2. Supply/Value Chain
- 4.3. PESTEL analysis
- 4.4. Market Entropy
- 4.5. Patent/Trademark Analysis
- 5. Global Automotive Power Distribution Modules Analysis, Insights and Forecast, 2020-2032
- 5.1. Market Analysis, Insights and Forecast - by Application
- 5.1.1. Passenger Car
- 5.1.2. Commercial Vehicle
- 5.2. Market Analysis, Insights and Forecast - by Types
- 5.2.1. Hardwired
- 5.2.2. Configurable
- 5.3. Market Analysis, Insights and Forecast - by Region
- 5.3.1. North America
- 5.3.2. South America
- 5.3.3. Europe
- 5.3.4. Middle East & Africa
- 5.3.5. Asia Pacific
- 5.1. Market Analysis, Insights and Forecast - by Application
- 6. North America Automotive Power Distribution Modules Analysis, Insights and Forecast, 2020-2032
- 6.1. Market Analysis, Insights and Forecast - by Application
- 6.1.1. Passenger Car
- 6.1.2. Commercial Vehicle
- 6.2. Market Analysis, Insights and Forecast - by Types
- 6.2.1. Hardwired
- 6.2.2. Configurable
- 6.1. Market Analysis, Insights and Forecast - by Application
- 7. South America Automotive Power Distribution Modules Analysis, Insights and Forecast, 2020-2032
- 7.1. Market Analysis, Insights and Forecast - by Application
- 7.1.1. Passenger Car
- 7.1.2. Commercial Vehicle
- 7.2. Market Analysis, Insights and Forecast - by Types
- 7.2.1. Hardwired
- 7.2.2. Configurable
- 7.1. Market Analysis, Insights and Forecast - by Application
- 8. Europe Automotive Power Distribution Modules Analysis, Insights and Forecast, 2020-2032
- 8.1. Market Analysis, Insights and Forecast - by Application
- 8.1.1. Passenger Car
- 8.1.2. Commercial Vehicle
- 8.2. Market Analysis, Insights and Forecast - by Types
- 8.2.1. Hardwired
- 8.2.2. Configurable
- 8.1. Market Analysis, Insights and Forecast - by Application
- 9. Middle East & Africa Automotive Power Distribution Modules Analysis, Insights and Forecast, 2020-2032
- 9.1. Market Analysis, Insights and Forecast - by Application
- 9.1.1. Passenger Car
- 9.1.2. Commercial Vehicle
- 9.2. Market Analysis, Insights and Forecast - by Types
- 9.2.1. Hardwired
- 9.2.2. Configurable
- 9.1. Market Analysis, Insights and Forecast - by Application
- 10. Asia Pacific Automotive Power Distribution Modules Analysis, Insights and Forecast, 2020-2032
- 10.1. Market Analysis, Insights and Forecast - by Application
- 10.1.1. Passenger Car
- 10.1.2. Commercial Vehicle
- 10.2. Market Analysis, Insights and Forecast - by Types
- 10.2.1. Hardwired
- 10.2.2. Configurable
- 10.1. Market Analysis, Insights and Forecast - by Application
- 11. Competitive Analysis
- 11.1. Global Market Share Analysis 2025
- 11.2. Company Profiles
- 11.2.1 Lear
- 11.2.1.1. Overview
- 11.2.1.2. Products
- 11.2.1.3. SWOT Analysis
- 11.2.1.4. Recent Developments
- 11.2.1.5. Financials (Based on Availability)
- 11.2.2 Eaton
- 11.2.2.1. Overview
- 11.2.2.2. Products
- 11.2.2.3. SWOT Analysis
- 11.2.2.4. Recent Developments
- 11.2.2.5. Financials (Based on Availability)
- 11.2.3 Aptiv
- 11.2.3.1. Overview
- 11.2.3.2. Products
- 11.2.3.3. SWOT Analysis
- 11.2.3.4. Recent Developments
- 11.2.3.5. Financials (Based on Availability)
- 11.2.4 TE Connectivity
- 11.2.4.1. Overview
- 11.2.4.2. Products
- 11.2.4.3. SWOT Analysis
- 11.2.4.4. Recent Developments
- 11.2.4.5. Financials (Based on Availability)
- 11.2.5 Sumitomo Electric
- 11.2.5.1. Overview
- 11.2.5.2. Products
- 11.2.5.3. SWOT Analysis
- 11.2.5.4. Recent Developments
- 11.2.5.5. Financials (Based on Availability)
- 11.2.6 Leoni
- 11.2.6.1. Overview
- 11.2.6.2. Products
- 11.2.6.3. SWOT Analysis
- 11.2.6.4. Recent Developments
- 11.2.6.5. Financials (Based on Availability)
- 11.2.7 Furukawa
- 11.2.7.1. Overview
- 11.2.7.2. Products
- 11.2.7.3. SWOT Analysis
- 11.2.7.4. Recent Developments
- 11.2.7.5. Financials (Based on Availability)
- 11.2.8 Draxlmaier
- 11.2.8.1. Overview
- 11.2.8.2. Products
- 11.2.8.3. SWOT Analysis
- 11.2.8.4. Recent Developments
- 11.2.8.5. Financials (Based on Availability)
- 11.2.9 Fujikura
- 11.2.9.1. Overview
- 11.2.9.2. Products
- 11.2.9.3. SWOT Analysis
- 11.2.9.4. Recent Developments
- 11.2.9.5. Financials (Based on Availability)
- 11.2.10 MTA
- 11.2.10.1. Overview
- 11.2.10.2. Products
- 11.2.10.3. SWOT Analysis
- 11.2.10.4. Recent Developments
- 11.2.10.5. Financials (Based on Availability)
- 11.2.11 Littelfuse
- 11.2.11.1. Overview
- 11.2.11.2. Products
- 11.2.11.3. SWOT Analysis
- 11.2.11.4. Recent Developments
- 11.2.11.5. Financials (Based on Availability)
- 11.2.12 Yazaki
- 11.2.12.1. Overview
- 11.2.12.2. Products
- 11.2.12.3. SWOT Analysis
- 11.2.12.4. Recent Developments
- 11.2.12.5. Financials (Based on Availability)
- 11.2.13 Motherson
- 11.2.13.1. Overview
- 11.2.13.2. Products
- 11.2.13.3. SWOT Analysis
- 11.2.13.4. Recent Developments
- 11.2.13.5. Financials (Based on Availability)
- 11.2.14 MIND
- 11.2.14.1. Overview
- 11.2.14.2. Products
- 11.2.14.3. SWOT Analysis
- 11.2.14.4. Recent Developments
- 11.2.14.5. Financials (Based on Availability)
- 11.2.15 Continental AG
- 11.2.15.1. Overview
- 11.2.15.2. Products
- 11.2.15.3. SWOT Analysis
- 11.2.15.4. Recent Developments
- 11.2.15.5. Financials (Based on Availability)
- 11.2.16 Curtiss-Wright
- 11.2.16.1. Overview
- 11.2.16.2. Products
- 11.2.16.3. SWOT Analysis
- 11.2.16.4. Recent Developments
- 11.2.16.5. Financials (Based on Availability)
- 11.2.17 MOLEAD
- 11.2.17.1. Overview
- 11.2.17.2. Products
- 11.2.17.3. SWOT Analysis
- 11.2.17.4. Recent Developments
- 11.2.17.5. Financials (Based on Availability)
- 11.2.1 Lear
List of Figures
- Figure 1: Global Automotive Power Distribution Modules Revenue Breakdown (million, %) by Region 2025 & 2033
- Figure 2: Global Automotive Power Distribution Modules Volume Breakdown (K, %) by Region 2025 & 2033
- Figure 3: North America Automotive Power Distribution Modules Revenue (million), by Application 2025 & 2033
- Figure 4: North America Automotive Power Distribution Modules Volume (K), by Application 2025 & 2033
- Figure 5: North America Automotive Power Distribution Modules Revenue Share (%), by Application 2025 & 2033
- Figure 6: North America Automotive Power Distribution Modules Volume Share (%), by Application 2025 & 2033
- Figure 7: North America Automotive Power Distribution Modules Revenue (million), by Types 2025 & 2033
- Figure 8: North America Automotive Power Distribution Modules Volume (K), by Types 2025 & 2033
- Figure 9: North America Automotive Power Distribution Modules Revenue Share (%), by Types 2025 & 2033
- Figure 10: North America Automotive Power Distribution Modules Volume Share (%), by Types 2025 & 2033
- Figure 11: North America Automotive Power Distribution Modules Revenue (million), by Country 2025 & 2033
- Figure 12: North America Automotive Power Distribution Modules Volume (K), by Country 2025 & 2033
- Figure 13: North America Automotive Power Distribution Modules Revenue Share (%), by Country 2025 & 2033
- Figure 14: North America Automotive Power Distribution Modules Volume Share (%), by Country 2025 & 2033
- Figure 15: South America Automotive Power Distribution Modules Revenue (million), by Application 2025 & 2033
- Figure 16: South America Automotive Power Distribution Modules Volume (K), by Application 2025 & 2033
- Figure 17: South America Automotive Power Distribution Modules Revenue Share (%), by Application 2025 & 2033
- Figure 18: South America Automotive Power Distribution Modules Volume Share (%), by Application 2025 & 2033
- Figure 19: South America Automotive Power Distribution Modules Revenue (million), by Types 2025 & 2033
- Figure 20: South America Automotive Power Distribution Modules Volume (K), by Types 2025 & 2033
- Figure 21: South America Automotive Power Distribution Modules Revenue Share (%), by Types 2025 & 2033
- Figure 22: South America Automotive Power Distribution Modules Volume Share (%), by Types 2025 & 2033
- Figure 23: South America Automotive Power Distribution Modules Revenue (million), by Country 2025 & 2033
- Figure 24: South America Automotive Power Distribution Modules Volume (K), by Country 2025 & 2033
- Figure 25: South America Automotive Power Distribution Modules Revenue Share (%), by Country 2025 & 2033
- Figure 26: South America Automotive Power Distribution Modules Volume Share (%), by Country 2025 & 2033
- Figure 27: Europe Automotive Power Distribution Modules Revenue (million), by Application 2025 & 2033
- Figure 28: Europe Automotive Power Distribution Modules Volume (K), by Application 2025 & 2033
- Figure 29: Europe Automotive Power Distribution Modules Revenue Share (%), by Application 2025 & 2033
- Figure 30: Europe Automotive Power Distribution Modules Volume Share (%), by Application 2025 & 2033
- Figure 31: Europe Automotive Power Distribution Modules Revenue (million), by Types 2025 & 2033
- Figure 32: Europe Automotive Power Distribution Modules Volume (K), by Types 2025 & 2033
- Figure 33: Europe Automotive Power Distribution Modules Revenue Share (%), by Types 2025 & 2033
- Figure 34: Europe Automotive Power Distribution Modules Volume Share (%), by Types 2025 & 2033
- Figure 35: Europe Automotive Power Distribution Modules Revenue (million), by Country 2025 & 2033
- Figure 36: Europe Automotive Power Distribution Modules Volume (K), by Country 2025 & 2033
- Figure 37: Europe Automotive Power Distribution Modules Revenue Share (%), by Country 2025 & 2033
- Figure 38: Europe Automotive Power Distribution Modules Volume Share (%), by Country 2025 & 2033
- Figure 39: Middle East & Africa Automotive Power Distribution Modules Revenue (million), by Application 2025 & 2033
- Figure 40: Middle East & Africa Automotive Power Distribution Modules Volume (K), by Application 2025 & 2033
- Figure 41: Middle East & Africa Automotive Power Distribution Modules Revenue Share (%), by Application 2025 & 2033
- Figure 42: Middle East & Africa Automotive Power Distribution Modules Volume Share (%), by Application 2025 & 2033
- Figure 43: Middle East & Africa Automotive Power Distribution Modules Revenue (million), by Types 2025 & 2033
- Figure 44: Middle East & Africa Automotive Power Distribution Modules Volume (K), by Types 2025 & 2033
- Figure 45: Middle East & Africa Automotive Power Distribution Modules Revenue Share (%), by Types 2025 & 2033
- Figure 46: Middle East & Africa Automotive Power Distribution Modules Volume Share (%), by Types 2025 & 2033
- Figure 47: Middle East & Africa Automotive Power Distribution Modules Revenue (million), by Country 2025 & 2033
- Figure 48: Middle East & Africa Automotive Power Distribution Modules Volume (K), by Country 2025 & 2033
- Figure 49: Middle East & Africa Automotive Power Distribution Modules Revenue Share (%), by Country 2025 & 2033
- Figure 50: Middle East & Africa Automotive Power Distribution Modules Volume Share (%), by Country 2025 & 2033
- Figure 51: Asia Pacific Automotive Power Distribution Modules Revenue (million), by Application 2025 & 2033
- Figure 52: Asia Pacific Automotive Power Distribution Modules Volume (K), by Application 2025 & 2033
- Figure 53: Asia Pacific Automotive Power Distribution Modules Revenue Share (%), by Application 2025 & 2033
- Figure 54: Asia Pacific Automotive Power Distribution Modules Volume Share (%), by Application 2025 & 2033
- Figure 55: Asia Pacific Automotive Power Distribution Modules Revenue (million), by Types 2025 & 2033
- Figure 56: Asia Pacific Automotive Power Distribution Modules Volume (K), by Types 2025 & 2033
- Figure 57: Asia Pacific Automotive Power Distribution Modules Revenue Share (%), by Types 2025 & 2033
- Figure 58: Asia Pacific Automotive Power Distribution Modules Volume Share (%), by Types 2025 & 2033
- Figure 59: Asia Pacific Automotive Power Distribution Modules Revenue (million), by Country 2025 & 2033
- Figure 60: Asia Pacific Automotive Power Distribution Modules Volume (K), by Country 2025 & 2033
- Figure 61: Asia Pacific Automotive Power Distribution Modules Revenue Share (%), by Country 2025 & 2033
- Figure 62: Asia Pacific Automotive Power Distribution Modules Volume Share (%), by Country 2025 & 2033
List of Tables
- Table 1: Global Automotive Power Distribution Modules Revenue million Forecast, by Application 2020 & 2033
- Table 2: Global Automotive Power Distribution Modules Volume K Forecast, by Application 2020 & 2033
- Table 3: Global Automotive Power Distribution Modules Revenue million Forecast, by Types 2020 & 2033
- Table 4: Global Automotive Power Distribution Modules Volume K Forecast, by Types 2020 & 2033
- Table 5: Global Automotive Power Distribution Modules Revenue million Forecast, by Region 2020 & 2033
- Table 6: Global Automotive Power Distribution Modules Volume K Forecast, by Region 2020 & 2033
- Table 7: Global Automotive Power Distribution Modules Revenue million Forecast, by Application 2020 & 2033
- Table 8: Global Automotive Power Distribution Modules Volume K Forecast, by Application 2020 & 2033
- Table 9: Global Automotive Power Distribution Modules Revenue million Forecast, by Types 2020 & 2033
- Table 10: Global Automotive Power Distribution Modules Volume K Forecast, by Types 2020 & 2033
- Table 11: Global Automotive Power Distribution Modules Revenue million Forecast, by Country 2020 & 2033
- Table 12: Global Automotive Power Distribution Modules Volume K Forecast, by Country 2020 & 2033
- Table 13: United States Automotive Power Distribution Modules Revenue (million) Forecast, by Application 2020 & 2033
- Table 14: United States Automotive Power Distribution Modules Volume (K) Forecast, by Application 2020 & 2033
- Table 15: Canada Automotive Power Distribution Modules Revenue (million) Forecast, by Application 2020 & 2033
- Table 16: Canada Automotive Power Distribution Modules Volume (K) Forecast, by Application 2020 & 2033
- Table 17: Mexico Automotive Power Distribution Modules Revenue (million) Forecast, by Application 2020 & 2033
- Table 18: Mexico Automotive Power Distribution Modules Volume (K) Forecast, by Application 2020 & 2033
- Table 19: Global Automotive Power Distribution Modules Revenue million Forecast, by Application 2020 & 2033
- Table 20: Global Automotive Power Distribution Modules Volume K Forecast, by Application 2020 & 2033
- Table 21: Global Automotive Power Distribution Modules Revenue million Forecast, by Types 2020 & 2033
- Table 22: Global Automotive Power Distribution Modules Volume K Forecast, by Types 2020 & 2033
- Table 23: Global Automotive Power Distribution Modules Revenue million Forecast, by Country 2020 & 2033
- Table 24: Global Automotive Power Distribution Modules Volume K Forecast, by Country 2020 & 2033
- Table 25: Brazil Automotive Power Distribution Modules Revenue (million) Forecast, by Application 2020 & 2033
- Table 26: Brazil Automotive Power Distribution Modules Volume (K) Forecast, by Application 2020 & 2033
- Table 27: Argentina Automotive Power Distribution Modules Revenue (million) Forecast, by Application 2020 & 2033
- Table 28: Argentina Automotive Power Distribution Modules Volume (K) Forecast, by Application 2020 & 2033
- Table 29: Rest of South America Automotive Power Distribution Modules Revenue (million) Forecast, by Application 2020 & 2033
- Table 30: Rest of South America Automotive Power Distribution Modules Volume (K) Forecast, by Application 2020 & 2033
- Table 31: Global Automotive Power Distribution Modules Revenue million Forecast, by Application 2020 & 2033
- Table 32: Global Automotive Power Distribution Modules Volume K Forecast, by Application 2020 & 2033
- Table 33: Global Automotive Power Distribution Modules Revenue million Forecast, by Types 2020 & 2033
- Table 34: Global Automotive Power Distribution Modules Volume K Forecast, by Types 2020 & 2033
- Table 35: Global Automotive Power Distribution Modules Revenue million Forecast, by Country 2020 & 2033
- Table 36: Global Automotive Power Distribution Modules Volume K Forecast, by Country 2020 & 2033
- Table 37: United Kingdom Automotive Power Distribution Modules Revenue (million) Forecast, by Application 2020 & 2033
- Table 38: United Kingdom Automotive Power Distribution Modules Volume (K) Forecast, by Application 2020 & 2033
- Table 39: Germany Automotive Power Distribution Modules Revenue (million) Forecast, by Application 2020 & 2033
- Table 40: Germany Automotive Power Distribution Modules Volume (K) Forecast, by Application 2020 & 2033
- Table 41: France Automotive Power Distribution Modules Revenue (million) Forecast, by Application 2020 & 2033
- Table 42: France Automotive Power Distribution Modules Volume (K) Forecast, by Application 2020 & 2033
- Table 43: Italy Automotive Power Distribution Modules Revenue (million) Forecast, by Application 2020 & 2033
- Table 44: Italy Automotive Power Distribution Modules Volume (K) Forecast, by Application 2020 & 2033
- Table 45: Spain Automotive Power Distribution Modules Revenue (million) Forecast, by Application 2020 & 2033
- Table 46: Spain Automotive Power Distribution Modules Volume (K) Forecast, by Application 2020 & 2033
- Table 47: Russia Automotive Power Distribution Modules Revenue (million) Forecast, by Application 2020 & 2033
- Table 48: Russia Automotive Power Distribution Modules Volume (K) Forecast, by Application 2020 & 2033
- Table 49: Benelux Automotive Power Distribution Modules Revenue (million) Forecast, by Application 2020 & 2033
- Table 50: Benelux Automotive Power Distribution Modules Volume (K) Forecast, by Application 2020 & 2033
- Table 51: Nordics Automotive Power Distribution Modules Revenue (million) Forecast, by Application 2020 & 2033
- Table 52: Nordics Automotive Power Distribution Modules Volume (K) Forecast, by Application 2020 & 2033
- Table 53: Rest of Europe Automotive Power Distribution Modules Revenue (million) Forecast, by Application 2020 & 2033
- Table 54: Rest of Europe Automotive Power Distribution Modules Volume (K) Forecast, by Application 2020 & 2033
- Table 55: Global Automotive Power Distribution Modules Revenue million Forecast, by Application 2020 & 2033
- Table 56: Global Automotive Power Distribution Modules Volume K Forecast, by Application 2020 & 2033
- Table 57: Global Automotive Power Distribution Modules Revenue million Forecast, by Types 2020 & 2033
- Table 58: Global Automotive Power Distribution Modules Volume K Forecast, by Types 2020 & 2033
- Table 59: Global Automotive Power Distribution Modules Revenue million Forecast, by Country 2020 & 2033
- Table 60: Global Automotive Power Distribution Modules Volume K Forecast, by Country 2020 & 2033
- Table 61: Turkey Automotive Power Distribution Modules Revenue (million) Forecast, by Application 2020 & 2033
- Table 62: Turkey Automotive Power Distribution Modules Volume (K) Forecast, by Application 2020 & 2033
- Table 63: Israel Automotive Power Distribution Modules Revenue (million) Forecast, by Application 2020 & 2033
- Table 64: Israel Automotive Power Distribution Modules Volume (K) Forecast, by Application 2020 & 2033
- Table 65: GCC Automotive Power Distribution Modules Revenue (million) Forecast, by Application 2020 & 2033
- Table 66: GCC Automotive Power Distribution Modules Volume (K) Forecast, by Application 2020 & 2033
- Table 67: North Africa Automotive Power Distribution Modules Revenue (million) Forecast, by Application 2020 & 2033
- Table 68: North Africa Automotive Power Distribution Modules Volume (K) Forecast, by Application 2020 & 2033
- Table 69: South Africa Automotive Power Distribution Modules Revenue (million) Forecast, by Application 2020 & 2033
- Table 70: South Africa Automotive Power Distribution Modules Volume (K) Forecast, by Application 2020 & 2033
- Table 71: Rest of Middle East & Africa Automotive Power Distribution Modules Revenue (million) Forecast, by Application 2020 & 2033
- Table 72: Rest of Middle East & Africa Automotive Power Distribution Modules Volume (K) Forecast, by Application 2020 & 2033
- Table 73: Global Automotive Power Distribution Modules Revenue million Forecast, by Application 2020 & 2033
- Table 74: Global Automotive Power Distribution Modules Volume K Forecast, by Application 2020 & 2033
- Table 75: Global Automotive Power Distribution Modules Revenue million Forecast, by Types 2020 & 2033
- Table 76: Global Automotive Power Distribution Modules Volume K Forecast, by Types 2020 & 2033
- Table 77: Global Automotive Power Distribution Modules Revenue million Forecast, by Country 2020 & 2033
- Table 78: Global Automotive Power Distribution Modules Volume K Forecast, by Country 2020 & 2033
- Table 79: China Automotive Power Distribution Modules Revenue (million) Forecast, by Application 2020 & 2033
- Table 80: China Automotive Power Distribution Modules Volume (K) Forecast, by Application 2020 & 2033
- Table 81: India Automotive Power Distribution Modules Revenue (million) Forecast, by Application 2020 & 2033
- Table 82: India Automotive Power Distribution Modules Volume (K) Forecast, by Application 2020 & 2033
- Table 83: Japan Automotive Power Distribution Modules Revenue (million) Forecast, by Application 2020 & 2033
- Table 84: Japan Automotive Power Distribution Modules Volume (K) Forecast, by Application 2020 & 2033
- Table 85: South Korea Automotive Power Distribution Modules Revenue (million) Forecast, by Application 2020 & 2033
- Table 86: South Korea Automotive Power Distribution Modules Volume (K) Forecast, by Application 2020 & 2033
- Table 87: ASEAN Automotive Power Distribution Modules Revenue (million) Forecast, by Application 2020 & 2033
- Table 88: ASEAN Automotive Power Distribution Modules Volume (K) Forecast, by Application 2020 & 2033
- Table 89: Oceania Automotive Power Distribution Modules Revenue (million) Forecast, by Application 2020 & 2033
- Table 90: Oceania Automotive Power Distribution Modules Volume (K) Forecast, by Application 2020 & 2033
- Table 91: Rest of Asia Pacific Automotive Power Distribution Modules Revenue (million) Forecast, by Application 2020 & 2033
- Table 92: Rest of Asia Pacific Automotive Power Distribution Modules Volume (K) Forecast, by Application 2020 & 2033
Frequently Asked Questions
1. What is the projected Compound Annual Growth Rate (CAGR) of the Automotive Power Distribution Modules?
The projected CAGR is approximately 9%.
2. Which companies are prominent players in the Automotive Power Distribution Modules?
Key companies in the market include Lear, Eaton, Aptiv, TE Connectivity, Sumitomo Electric, Leoni, Furukawa, Draxlmaier, Fujikura, MTA, Littelfuse, Yazaki, Motherson, MIND, Continental AG, Curtiss-Wright, MOLEAD.
3. What are the main segments of the Automotive Power Distribution Modules?
The market segments include Application, Types.
4. Can you provide details about the market size?
The market size is estimated to be USD 4636 million as of 2022.
5. What are some drivers contributing to market growth?
N/A
6. What are the notable trends driving market growth?
N/A
7. Are there any restraints impacting market growth?
N/A
8. Can you provide examples of recent developments in the market?
N/A
9. What pricing options are available for accessing the report?
Pricing options include single-user, multi-user, and enterprise licenses priced at USD 3950.00, USD 5925.00, and USD 7900.00 respectively.
10. Is the market size provided in terms of value or volume?
The market size is provided in terms of value, measured in million and volume, measured in K.
11. Are there any specific market keywords associated with the report?
Yes, the market keyword associated with the report is "Automotive Power Distribution Modules," which aids in identifying and referencing the specific market segment covered.
12. How do I determine which pricing option suits my needs best?
The pricing options vary based on user requirements and access needs. Individual users may opt for single-user licenses, while businesses requiring broader access may choose multi-user or enterprise licenses for cost-effective access to the report.
13. Are there any additional resources or data provided in the Automotive Power Distribution Modules report?
While the report offers comprehensive insights, it's advisable to review the specific contents or supplementary materials provided to ascertain if additional resources or data are available.
14. How can I stay updated on further developments or reports in the Automotive Power Distribution Modules?
To stay informed about further developments, trends, and reports in the Automotive Power Distribution Modules, consider subscribing to industry newsletters, following relevant companies and organizations, or regularly checking reputable industry news sources and publications.
Methodology
Step 1 - Identification of Relevant Samples Size from Population Database


Step 2 - Approaches for Defining Global Market Size (Value, Volume* & Price*)

Note*: In applicable scenarios
Step 3 - Data Sources
Primary Research
- Web Analytics
- Survey Reports
- Research Institute
- Latest Research Reports
- Opinion Leaders
Secondary Research
- Annual Reports
- White Paper
- Latest Press Release
- Industry Association
- Paid Database
- Investor Presentations

Step 4 - Data Triangulation
Involves using different sources of information in order to increase the validity of a study
These sources are likely to be stakeholders in a program - participants, other researchers, program staff, other community members, and so on.
Then we put all data in single framework & apply various statistical tools to find out the dynamic on the market.
During the analysis stage, feedback from the stakeholder groups would be compared to determine areas of agreement as well as areas of divergence