

Key Insights
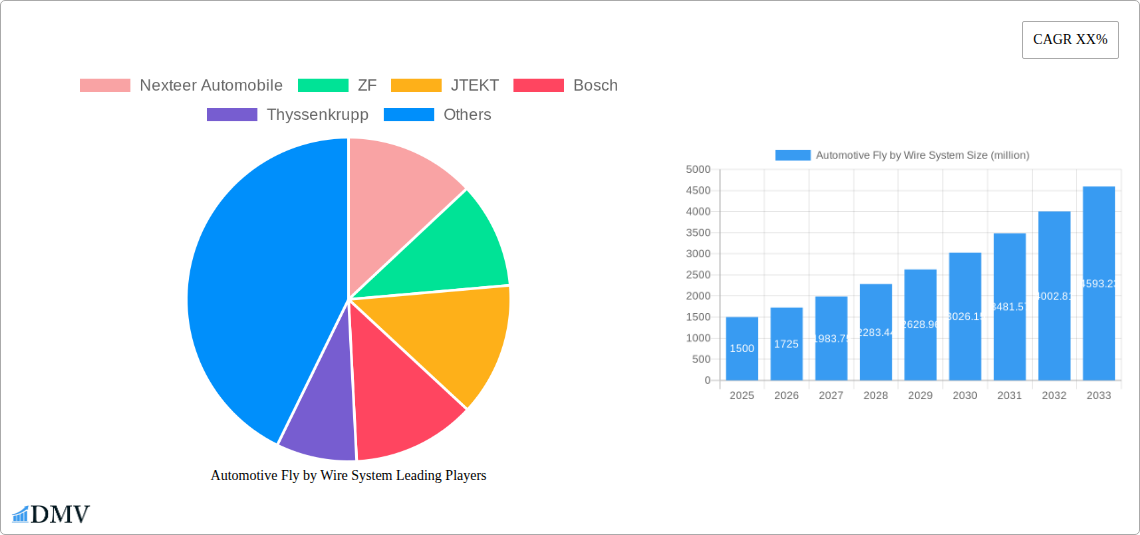
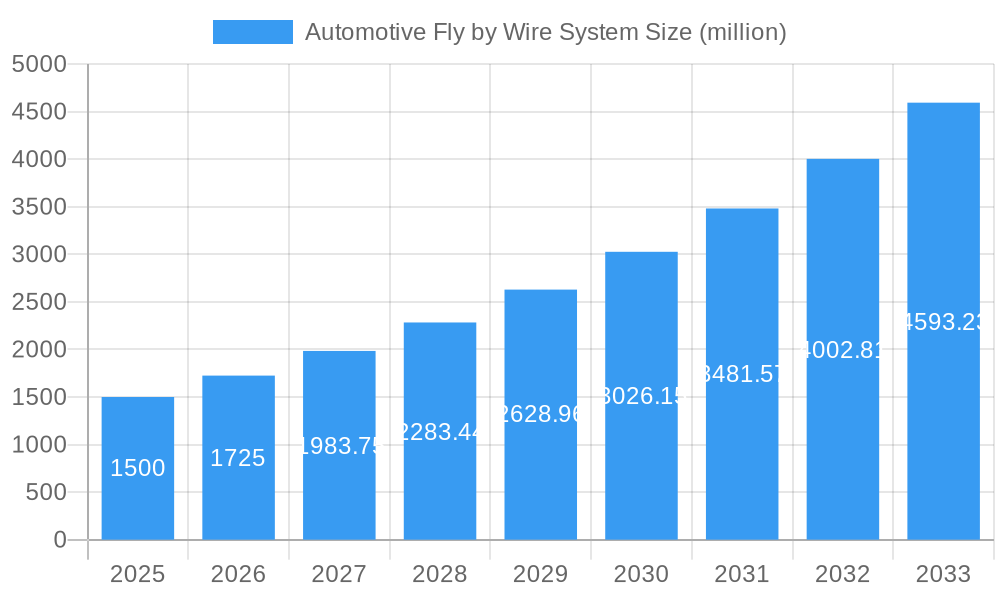
The automotive fly-by-wire system market is poised for significant expansion, driven by escalating demand for advanced safety features, superior fuel efficiency, and the burgeoning autonomous driving revolution. The accelerating adoption of electric and hybrid vehicles further propels this growth, as fly-by-wire systems are integral to optimizing their performance and control. Leading industry innovators, including Nexteer Automotive, ZF, JTEKT, and Bosch, are prioritizing substantial research and development investments, fostering breakthroughs in system design, integration, and functionality. The market is comprehensively analyzed across vehicle types (passenger cars, commercial vehicles), core system components (steering, braking, throttle), and key geographical markets. While cybersecurity and system reliability present ongoing considerations, the long-term forecast for the automotive fly-by-wire system market is exceptionally strong. We project a substantial market size of $15.43 billion by 2025, with a projected Compound Annual Growth Rate (CAGR) of 7.18% from the base year 2025 to 2033, underscoring robust technological advancements and widespread industry adoption. This growth trajectory is particularly pronounced in regions with rapidly evolving automotive sectors and proactive governmental support for Advanced Driver-Assistance Systems (ADAS) and autonomous mobility.
Automotive Fly by Wire System Market Size (In Billion)
Key market growth drivers encompass the pervasive integration of ADAS functionalities, the evolution of sophisticated driver-vehicle interfaces, and the increasing preference for lightweight vehicle designs to enhance fuel economy. Nevertheless, significant initial investment requirements and the inherent complexity of integrating these advanced systems into existing vehicle architectures present notable challenges. Stringent safety mandates and regulatory frameworks also influence market dynamics. Despite these obstacles, persistent innovation, advancements in sensor technology, and the ongoing shift towards electric mobility are anticipated to catalyze substantial market expansion throughout the forecast period. The competitive arena comprises established automotive component manufacturers and dynamic emerging technology firms, fostering a climate of innovation and intense competition.
Automotive Fly by Wire System Company Market Share
Automotive Fly by Wire System Market Report: A Comprehensive Analysis (2019-2033)
This insightful report provides a detailed analysis of the global Automotive Fly by Wire System market, projecting a multi-million dollar valuation by 2033. The study covers the historical period (2019-2024), base year (2025), and forecast period (2025-2033), offering stakeholders invaluable insights into market dynamics, technological advancements, and future growth opportunities. Key players like Nexteer Automobile, ZF, JTEKT, Bosch, Thyssenkrupp, Danfoss, NSK, Hitachi Astemo, Mando, Schaeffler, and Paravan Technologie are meticulously analyzed.
Automotive Fly by Wire System Market Composition & Trends
This section delves into the competitive landscape of the automotive fly-by-wire system market, analyzing market concentration, innovation drivers, regulatory influences, substitute technologies, and end-user preferences. The report assesses the market share distribution among key players, revealing the dominance of certain companies and the level of market consolidation. Furthermore, it examines mergers and acquisitions (M&A) activities within the industry, quantifying deal values in millions of dollars and assessing their impact on market structure. Key aspects covered include:
- Market Concentration: Analysis of market share distribution amongst leading players, revealing the extent of competition and concentration. The xx largest players accounted for approximately xx% of the market in 2024.
- Innovation Catalysts: Examination of technological advancements, R&D investments, and collaborative partnerships driving innovation within the sector. Investment in the sector exceeded $xx million in 2024.
- Regulatory Landscape: Assessment of government regulations, safety standards, and emission norms impacting market growth and technological adoption. xx new regulations are expected by 2030.
- Substitute Products: Evaluation of alternative technologies and their potential to disrupt the automotive fly-by-wire system market. The electric braking systems pose a competitive threat to the market.
- End-User Profiles: Identification of key end-users (OEMs, Tier-1 suppliers, etc.) and their influence on market demand. The automotive sector is expected to account for over xx% of the market.
- M&A Activities: Analysis of significant M&A transactions during the study period, including deal values (in millions of dollars) and their strategic implications. Total M&A deal value for 2019-2024 exceeded $xx million.
Automotive Fly by Wire System Industry Evolution
This section provides a comprehensive overview of the automotive fly-by-wire system industry's evolution, tracing its growth trajectory, technological advancements, and evolving consumer preferences. It examines the historical growth rate and projects future growth based on various market factors. The analysis includes:
- Market growth trajectories, illustrating the expansion of the market across different regions. The CAGR from 2019 to 2024 was xx%, and is projected to be xx% from 2025 to 2033.
- Technological advancements, detailing the key innovations in sensors, actuators, and control algorithms driving market expansion. The adoption of artificial intelligence is boosting the market.
- Shifting consumer demands, emphasizing the influence of autonomous driving, electric vehicles, and enhanced safety features on market growth. Consumer preference for advanced safety features is rising steadily.
- The emergence of new applications beyond traditional passenger vehicles. Applications in commercial vehicles are expected to show significant growth.
- Analysis of technological shifts and their effect on market size and segmentation.
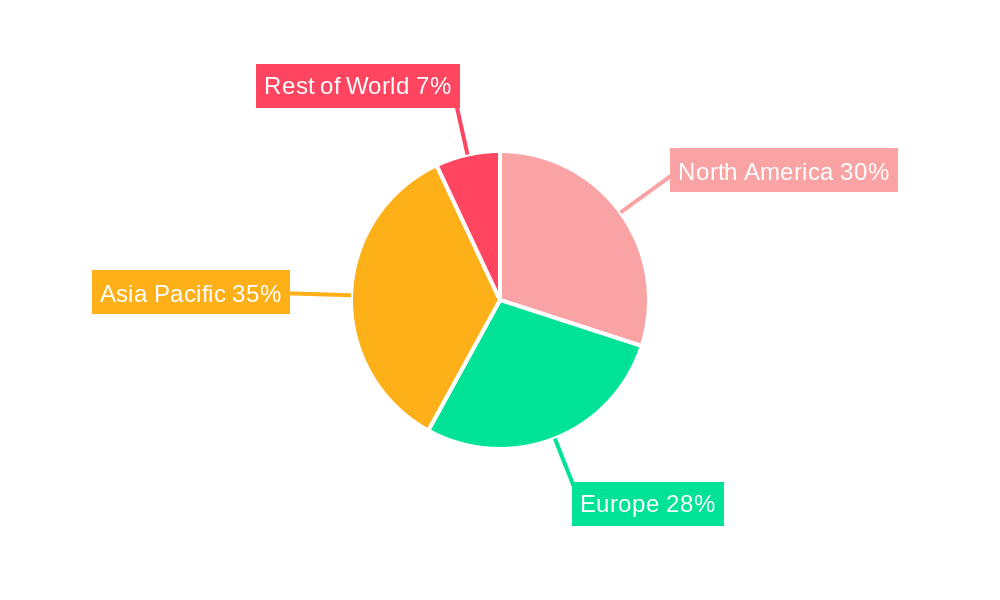
Leading Regions, Countries, or Segments in Automotive Fly by Wire System
This section pinpoints the leading geographical regions and market segments within the automotive fly-by-wire system industry, analyzing their dominant positions and underlying factors. The analysis includes:
- Dominant Region/Country/Segment: Detailed examination of the factors contributing to the market leadership of a specific region, country, or segment. (e.g., North America is projected to maintain its leading position)
- Key Drivers:
- Investment Trends: Significant R&D investment and government funding in specific regions.
- Regulatory Support: Favorable policies and regulations promoting the adoption of fly-by-wire systems.
- Technological Advancements: Presence of strong technological hubs and innovation ecosystems.
- Strong Automotive Industry: Presence of major automotive manufacturers.
- In-depth Analysis: Paragraphs providing detailed explanations of the reasons behind the dominance factors of the leading region/country/segment.
Automotive Fly by Wire System Product Innovations
This section highlights recent product innovations within the automotive fly-by-wire system market, focusing on their features, applications, and performance improvements. The analysis includes examples of enhanced precision, improved reliability, and reduced latency. Advancements in software algorithms and sensor technologies have led to significant improvements in overall system performance and safety. New applications in autonomous driving and advanced driver-assistance systems (ADAS) are also driving innovation.
Propelling Factors for Automotive Fly by Wire System Growth
This section identifies the key factors driving the growth of the automotive fly-by-wire system market. These include:
- Technological advancements in areas like sensor technology and control algorithms.
- Increasing demand for enhanced vehicle safety and autonomous driving features.
- Stringent government regulations promoting the adoption of advanced driver-assistance systems.
- Growing investments in R&D by automotive manufacturers and technology companies.
Obstacles in the Automotive Fly by Wire System Market
This section discusses potential obstacles hindering the growth of the automotive fly-by-wire system market, including:
- High initial investment costs associated with developing and implementing the technology.
- Potential cybersecurity vulnerabilities and concerns regarding data privacy.
- Regulatory uncertainties and potential delays in obtaining approvals for new systems.
- Intense competition among established players and emerging new entrants in the market.
Future Opportunities in Automotive Fly by Wire System
This section explores potential future opportunities for growth in the automotive fly-by-wire system market:
- Expansion into new market segments, such as commercial vehicles and off-road vehicles.
- Development of advanced functionalities, such as haptic feedback and integrated driver monitoring systems.
- Integration of fly-by-wire systems with other advanced technologies, such as autonomous driving and connectivity features.
- Exploring new markets in developing economies.
Major Players in the Automotive Fly by Wire System Ecosystem
- Nexteer Automobile
- ZF
- JTEKT
- Bosch
- Thyssenkrupp
- Danfoss
- NSK
- Hitachi Astemo
- Mando
- Schaeffler
- Paravan Technologie GmbH & Co. KG
Key Developments in Automotive Fly by Wire System Industry
- [Month, Year]: Company X launched a new fly-by-wire system with enhanced safety features.
- [Month, Year]: Companies Y and Z announced a strategic partnership to develop next-generation fly-by-wire technology.
- [Month, Year]: New regulations were implemented in Region A, impacting the adoption of fly-by-wire systems.
- (Add further bullet points with specific dates and impactful details)
Strategic Automotive Fly by Wire System Market Forecast
The automotive fly-by-wire system market is poised for significant growth over the forecast period, driven by technological advancements, increasing demand for advanced driver-assistance systems, and stringent government regulations. The market is expected to reach a valuation of $xx million by 2033. Key growth opportunities lie in the expansion into new market segments, the development of advanced functionalities, and the integration with other advanced technologies. The continued innovation and adoption of fly-by-wire systems will shape the future of automotive technology, enabling safer, more efficient, and autonomous driving experiences.
Automotive Fly by Wire System Segmentation
-
1. Application
- 1.1. Passenger Vehicles
- 1.2. Commercial Vehicles
-
2. Types
- 2.1. C-Fly by Wire System
- 2.2. P-Fly by Wire System
- 2.3. R-Fly by Wire System
Automotive Fly by Wire System Segmentation By Geography
-
1. North America
- 1.1. United States
- 1.2. Canada
- 1.3. Mexico
-
2. South America
- 2.1. Brazil
- 2.2. Argentina
- 2.3. Rest of South America
-
3. Europe
- 3.1. United Kingdom
- 3.2. Germany
- 3.3. France
- 3.4. Italy
- 3.5. Spain
- 3.6. Russia
- 3.7. Benelux
- 3.8. Nordics
- 3.9. Rest of Europe
-
4. Middle East & Africa
- 4.1. Turkey
- 4.2. Israel
- 4.3. GCC
- 4.4. North Africa
- 4.5. South Africa
- 4.6. Rest of Middle East & Africa
-
5. Asia Pacific
- 5.1. China
- 5.2. India
- 5.3. Japan
- 5.4. South Korea
- 5.5. ASEAN
- 5.6. Oceania
- 5.7. Rest of Asia Pacific
Automotive Fly by Wire System Regional Market Share
Geographic Coverage of Automotive Fly by Wire System
Automotive Fly by Wire System REPORT HIGHLIGHTS
| Aspects | Details |
|---|---|
| Study Period | 2020-2034 |
| Base Year | 2025 |
| Estimated Year | 2026 |
| Forecast Period | 2026-2034 |
| Historical Period | 2020-2025 |
| Growth Rate | CAGR of 7.18% from 2020-2034 |
| Segmentation |
|
Table of Contents
- 1. Introduction
- 1.1. Research Scope
- 1.2. Market Segmentation
- 1.3. Research Methodology
- 1.4. Definitions and Assumptions
- 2. Executive Summary
- 2.1. Introduction
- 3. Market Dynamics
- 3.1. Introduction
- 3.2. Market Drivers
- 3.3. Market Restrains
- 3.4. Market Trends
- 4. Market Factor Analysis
- 4.1. Porters Five Forces
- 4.2. Supply/Value Chain
- 4.3. PESTEL analysis
- 4.4. Market Entropy
- 4.5. Patent/Trademark Analysis
- 5. Global Automotive Fly by Wire System Analysis, Insights and Forecast, 2020-2032
- 5.1. Market Analysis, Insights and Forecast - by Application
- 5.1.1. Passenger Vehicles
- 5.1.2. Commercial Vehicles
- 5.2. Market Analysis, Insights and Forecast - by Types
- 5.2.1. C-Fly by Wire System
- 5.2.2. P-Fly by Wire System
- 5.2.3. R-Fly by Wire System
- 5.3. Market Analysis, Insights and Forecast - by Region
- 5.3.1. North America
- 5.3.2. South America
- 5.3.3. Europe
- 5.3.4. Middle East & Africa
- 5.3.5. Asia Pacific
- 5.1. Market Analysis, Insights and Forecast - by Application
- 6. North America Automotive Fly by Wire System Analysis, Insights and Forecast, 2020-2032
- 6.1. Market Analysis, Insights and Forecast - by Application
- 6.1.1. Passenger Vehicles
- 6.1.2. Commercial Vehicles
- 6.2. Market Analysis, Insights and Forecast - by Types
- 6.2.1. C-Fly by Wire System
- 6.2.2. P-Fly by Wire System
- 6.2.3. R-Fly by Wire System
- 6.1. Market Analysis, Insights and Forecast - by Application
- 7. South America Automotive Fly by Wire System Analysis, Insights and Forecast, 2020-2032
- 7.1. Market Analysis, Insights and Forecast - by Application
- 7.1.1. Passenger Vehicles
- 7.1.2. Commercial Vehicles
- 7.2. Market Analysis, Insights and Forecast - by Types
- 7.2.1. C-Fly by Wire System
- 7.2.2. P-Fly by Wire System
- 7.2.3. R-Fly by Wire System
- 7.1. Market Analysis, Insights and Forecast - by Application
- 8. Europe Automotive Fly by Wire System Analysis, Insights and Forecast, 2020-2032
- 8.1. Market Analysis, Insights and Forecast - by Application
- 8.1.1. Passenger Vehicles
- 8.1.2. Commercial Vehicles
- 8.2. Market Analysis, Insights and Forecast - by Types
- 8.2.1. C-Fly by Wire System
- 8.2.2. P-Fly by Wire System
- 8.2.3. R-Fly by Wire System
- 8.1. Market Analysis, Insights and Forecast - by Application
- 9. Middle East & Africa Automotive Fly by Wire System Analysis, Insights and Forecast, 2020-2032
- 9.1. Market Analysis, Insights and Forecast - by Application
- 9.1.1. Passenger Vehicles
- 9.1.2. Commercial Vehicles
- 9.2. Market Analysis, Insights and Forecast - by Types
- 9.2.1. C-Fly by Wire System
- 9.2.2. P-Fly by Wire System
- 9.2.3. R-Fly by Wire System
- 9.1. Market Analysis, Insights and Forecast - by Application
- 10. Asia Pacific Automotive Fly by Wire System Analysis, Insights and Forecast, 2020-2032
- 10.1. Market Analysis, Insights and Forecast - by Application
- 10.1.1. Passenger Vehicles
- 10.1.2. Commercial Vehicles
- 10.2. Market Analysis, Insights and Forecast - by Types
- 10.2.1. C-Fly by Wire System
- 10.2.2. P-Fly by Wire System
- 10.2.3. R-Fly by Wire System
- 10.1. Market Analysis, Insights and Forecast - by Application
- 11. Competitive Analysis
- 11.1. Global Market Share Analysis 2025
- 11.2. Company Profiles
- 11.2.1 Nexteer Automobile
- 11.2.1.1. Overview
- 11.2.1.2. Products
- 11.2.1.3. SWOT Analysis
- 11.2.1.4. Recent Developments
- 11.2.1.5. Financials (Based on Availability)
- 11.2.2 ZF
- 11.2.2.1. Overview
- 11.2.2.2. Products
- 11.2.2.3. SWOT Analysis
- 11.2.2.4. Recent Developments
- 11.2.2.5. Financials (Based on Availability)
- 11.2.3 JTEKT
- 11.2.3.1. Overview
- 11.2.3.2. Products
- 11.2.3.3. SWOT Analysis
- 11.2.3.4. Recent Developments
- 11.2.3.5. Financials (Based on Availability)
- 11.2.4 Bosch
- 11.2.4.1. Overview
- 11.2.4.2. Products
- 11.2.4.3. SWOT Analysis
- 11.2.4.4. Recent Developments
- 11.2.4.5. Financials (Based on Availability)
- 11.2.5 Thyssenkrupp
- 11.2.5.1. Overview
- 11.2.5.2. Products
- 11.2.5.3. SWOT Analysis
- 11.2.5.4. Recent Developments
- 11.2.5.5. Financials (Based on Availability)
- 11.2.6 Danfoss
- 11.2.6.1. Overview
- 11.2.6.2. Products
- 11.2.6.3. SWOT Analysis
- 11.2.6.4. Recent Developments
- 11.2.6.5. Financials (Based on Availability)
- 11.2.7 NSK
- 11.2.7.1. Overview
- 11.2.7.2. Products
- 11.2.7.3. SWOT Analysis
- 11.2.7.4. Recent Developments
- 11.2.7.5. Financials (Based on Availability)
- 11.2.8 Hitachi Astemo
- 11.2.8.1. Overview
- 11.2.8.2. Products
- 11.2.8.3. SWOT Analysis
- 11.2.8.4. Recent Developments
- 11.2.8.5. Financials (Based on Availability)
- 11.2.9 Mando
- 11.2.9.1. Overview
- 11.2.9.2. Products
- 11.2.9.3. SWOT Analysis
- 11.2.9.4. Recent Developments
- 11.2.9.5. Financials (Based on Availability)
- 11.2.10 Schaeffler Paravan Technologie GmbH & Co. KG
- 11.2.10.1. Overview
- 11.2.10.2. Products
- 11.2.10.3. SWOT Analysis
- 11.2.10.4. Recent Developments
- 11.2.10.5. Financials (Based on Availability)
- 11.2.1 Nexteer Automobile
List of Figures
- Figure 1: Global Automotive Fly by Wire System Revenue Breakdown (billion, %) by Region 2025 & 2033
- Figure 2: Global Automotive Fly by Wire System Volume Breakdown (K, %) by Region 2025 & 2033
- Figure 3: North America Automotive Fly by Wire System Revenue (billion), by Application 2025 & 2033
- Figure 4: North America Automotive Fly by Wire System Volume (K), by Application 2025 & 2033
- Figure 5: North America Automotive Fly by Wire System Revenue Share (%), by Application 2025 & 2033
- Figure 6: North America Automotive Fly by Wire System Volume Share (%), by Application 2025 & 2033
- Figure 7: North America Automotive Fly by Wire System Revenue (billion), by Types 2025 & 2033
- Figure 8: North America Automotive Fly by Wire System Volume (K), by Types 2025 & 2033
- Figure 9: North America Automotive Fly by Wire System Revenue Share (%), by Types 2025 & 2033
- Figure 10: North America Automotive Fly by Wire System Volume Share (%), by Types 2025 & 2033
- Figure 11: North America Automotive Fly by Wire System Revenue (billion), by Country 2025 & 2033
- Figure 12: North America Automotive Fly by Wire System Volume (K), by Country 2025 & 2033
- Figure 13: North America Automotive Fly by Wire System Revenue Share (%), by Country 2025 & 2033
- Figure 14: North America Automotive Fly by Wire System Volume Share (%), by Country 2025 & 2033
- Figure 15: South America Automotive Fly by Wire System Revenue (billion), by Application 2025 & 2033
- Figure 16: South America Automotive Fly by Wire System Volume (K), by Application 2025 & 2033
- Figure 17: South America Automotive Fly by Wire System Revenue Share (%), by Application 2025 & 2033
- Figure 18: South America Automotive Fly by Wire System Volume Share (%), by Application 2025 & 2033
- Figure 19: South America Automotive Fly by Wire System Revenue (billion), by Types 2025 & 2033
- Figure 20: South America Automotive Fly by Wire System Volume (K), by Types 2025 & 2033
- Figure 21: South America Automotive Fly by Wire System Revenue Share (%), by Types 2025 & 2033
- Figure 22: South America Automotive Fly by Wire System Volume Share (%), by Types 2025 & 2033
- Figure 23: South America Automotive Fly by Wire System Revenue (billion), by Country 2025 & 2033
- Figure 24: South America Automotive Fly by Wire System Volume (K), by Country 2025 & 2033
- Figure 25: South America Automotive Fly by Wire System Revenue Share (%), by Country 2025 & 2033
- Figure 26: South America Automotive Fly by Wire System Volume Share (%), by Country 2025 & 2033
- Figure 27: Europe Automotive Fly by Wire System Revenue (billion), by Application 2025 & 2033
- Figure 28: Europe Automotive Fly by Wire System Volume (K), by Application 2025 & 2033
- Figure 29: Europe Automotive Fly by Wire System Revenue Share (%), by Application 2025 & 2033
- Figure 30: Europe Automotive Fly by Wire System Volume Share (%), by Application 2025 & 2033
- Figure 31: Europe Automotive Fly by Wire System Revenue (billion), by Types 2025 & 2033
- Figure 32: Europe Automotive Fly by Wire System Volume (K), by Types 2025 & 2033
- Figure 33: Europe Automotive Fly by Wire System Revenue Share (%), by Types 2025 & 2033
- Figure 34: Europe Automotive Fly by Wire System Volume Share (%), by Types 2025 & 2033
- Figure 35: Europe Automotive Fly by Wire System Revenue (billion), by Country 2025 & 2033
- Figure 36: Europe Automotive Fly by Wire System Volume (K), by Country 2025 & 2033
- Figure 37: Europe Automotive Fly by Wire System Revenue Share (%), by Country 2025 & 2033
- Figure 38: Europe Automotive Fly by Wire System Volume Share (%), by Country 2025 & 2033
- Figure 39: Middle East & Africa Automotive Fly by Wire System Revenue (billion), by Application 2025 & 2033
- Figure 40: Middle East & Africa Automotive Fly by Wire System Volume (K), by Application 2025 & 2033
- Figure 41: Middle East & Africa Automotive Fly by Wire System Revenue Share (%), by Application 2025 & 2033
- Figure 42: Middle East & Africa Automotive Fly by Wire System Volume Share (%), by Application 2025 & 2033
- Figure 43: Middle East & Africa Automotive Fly by Wire System Revenue (billion), by Types 2025 & 2033
- Figure 44: Middle East & Africa Automotive Fly by Wire System Volume (K), by Types 2025 & 2033
- Figure 45: Middle East & Africa Automotive Fly by Wire System Revenue Share (%), by Types 2025 & 2033
- Figure 46: Middle East & Africa Automotive Fly by Wire System Volume Share (%), by Types 2025 & 2033
- Figure 47: Middle East & Africa Automotive Fly by Wire System Revenue (billion), by Country 2025 & 2033
- Figure 48: Middle East & Africa Automotive Fly by Wire System Volume (K), by Country 2025 & 2033
- Figure 49: Middle East & Africa Automotive Fly by Wire System Revenue Share (%), by Country 2025 & 2033
- Figure 50: Middle East & Africa Automotive Fly by Wire System Volume Share (%), by Country 2025 & 2033
- Figure 51: Asia Pacific Automotive Fly by Wire System Revenue (billion), by Application 2025 & 2033
- Figure 52: Asia Pacific Automotive Fly by Wire System Volume (K), by Application 2025 & 2033
- Figure 53: Asia Pacific Automotive Fly by Wire System Revenue Share (%), by Application 2025 & 2033
- Figure 54: Asia Pacific Automotive Fly by Wire System Volume Share (%), by Application 2025 & 2033
- Figure 55: Asia Pacific Automotive Fly by Wire System Revenue (billion), by Types 2025 & 2033
- Figure 56: Asia Pacific Automotive Fly by Wire System Volume (K), by Types 2025 & 2033
- Figure 57: Asia Pacific Automotive Fly by Wire System Revenue Share (%), by Types 2025 & 2033
- Figure 58: Asia Pacific Automotive Fly by Wire System Volume Share (%), by Types 2025 & 2033
- Figure 59: Asia Pacific Automotive Fly by Wire System Revenue (billion), by Country 2025 & 2033
- Figure 60: Asia Pacific Automotive Fly by Wire System Volume (K), by Country 2025 & 2033
- Figure 61: Asia Pacific Automotive Fly by Wire System Revenue Share (%), by Country 2025 & 2033
- Figure 62: Asia Pacific Automotive Fly by Wire System Volume Share (%), by Country 2025 & 2033
List of Tables
- Table 1: Global Automotive Fly by Wire System Revenue billion Forecast, by Application 2020 & 2033
- Table 2: Global Automotive Fly by Wire System Volume K Forecast, by Application 2020 & 2033
- Table 3: Global Automotive Fly by Wire System Revenue billion Forecast, by Types 2020 & 2033
- Table 4: Global Automotive Fly by Wire System Volume K Forecast, by Types 2020 & 2033
- Table 5: Global Automotive Fly by Wire System Revenue billion Forecast, by Region 2020 & 2033
- Table 6: Global Automotive Fly by Wire System Volume K Forecast, by Region 2020 & 2033
- Table 7: Global Automotive Fly by Wire System Revenue billion Forecast, by Application 2020 & 2033
- Table 8: Global Automotive Fly by Wire System Volume K Forecast, by Application 2020 & 2033
- Table 9: Global Automotive Fly by Wire System Revenue billion Forecast, by Types 2020 & 2033
- Table 10: Global Automotive Fly by Wire System Volume K Forecast, by Types 2020 & 2033
- Table 11: Global Automotive Fly by Wire System Revenue billion Forecast, by Country 2020 & 2033
- Table 12: Global Automotive Fly by Wire System Volume K Forecast, by Country 2020 & 2033
- Table 13: United States Automotive Fly by Wire System Revenue (billion) Forecast, by Application 2020 & 2033
- Table 14: United States Automotive Fly by Wire System Volume (K) Forecast, by Application 2020 & 2033
- Table 15: Canada Automotive Fly by Wire System Revenue (billion) Forecast, by Application 2020 & 2033
- Table 16: Canada Automotive Fly by Wire System Volume (K) Forecast, by Application 2020 & 2033
- Table 17: Mexico Automotive Fly by Wire System Revenue (billion) Forecast, by Application 2020 & 2033
- Table 18: Mexico Automotive Fly by Wire System Volume (K) Forecast, by Application 2020 & 2033
- Table 19: Global Automotive Fly by Wire System Revenue billion Forecast, by Application 2020 & 2033
- Table 20: Global Automotive Fly by Wire System Volume K Forecast, by Application 2020 & 2033
- Table 21: Global Automotive Fly by Wire System Revenue billion Forecast, by Types 2020 & 2033
- Table 22: Global Automotive Fly by Wire System Volume K Forecast, by Types 2020 & 2033
- Table 23: Global Automotive Fly by Wire System Revenue billion Forecast, by Country 2020 & 2033
- Table 24: Global Automotive Fly by Wire System Volume K Forecast, by Country 2020 & 2033
- Table 25: Brazil Automotive Fly by Wire System Revenue (billion) Forecast, by Application 2020 & 2033
- Table 26: Brazil Automotive Fly by Wire System Volume (K) Forecast, by Application 2020 & 2033
- Table 27: Argentina Automotive Fly by Wire System Revenue (billion) Forecast, by Application 2020 & 2033
- Table 28: Argentina Automotive Fly by Wire System Volume (K) Forecast, by Application 2020 & 2033
- Table 29: Rest of South America Automotive Fly by Wire System Revenue (billion) Forecast, by Application 2020 & 2033
- Table 30: Rest of South America Automotive Fly by Wire System Volume (K) Forecast, by Application 2020 & 2033
- Table 31: Global Automotive Fly by Wire System Revenue billion Forecast, by Application 2020 & 2033
- Table 32: Global Automotive Fly by Wire System Volume K Forecast, by Application 2020 & 2033
- Table 33: Global Automotive Fly by Wire System Revenue billion Forecast, by Types 2020 & 2033
- Table 34: Global Automotive Fly by Wire System Volume K Forecast, by Types 2020 & 2033
- Table 35: Global Automotive Fly by Wire System Revenue billion Forecast, by Country 2020 & 2033
- Table 36: Global Automotive Fly by Wire System Volume K Forecast, by Country 2020 & 2033
- Table 37: United Kingdom Automotive Fly by Wire System Revenue (billion) Forecast, by Application 2020 & 2033
- Table 38: United Kingdom Automotive Fly by Wire System Volume (K) Forecast, by Application 2020 & 2033
- Table 39: Germany Automotive Fly by Wire System Revenue (billion) Forecast, by Application 2020 & 2033
- Table 40: Germany Automotive Fly by Wire System Volume (K) Forecast, by Application 2020 & 2033
- Table 41: France Automotive Fly by Wire System Revenue (billion) Forecast, by Application 2020 & 2033
- Table 42: France Automotive Fly by Wire System Volume (K) Forecast, by Application 2020 & 2033
- Table 43: Italy Automotive Fly by Wire System Revenue (billion) Forecast, by Application 2020 & 2033
- Table 44: Italy Automotive Fly by Wire System Volume (K) Forecast, by Application 2020 & 2033
- Table 45: Spain Automotive Fly by Wire System Revenue (billion) Forecast, by Application 2020 & 2033
- Table 46: Spain Automotive Fly by Wire System Volume (K) Forecast, by Application 2020 & 2033
- Table 47: Russia Automotive Fly by Wire System Revenue (billion) Forecast, by Application 2020 & 2033
- Table 48: Russia Automotive Fly by Wire System Volume (K) Forecast, by Application 2020 & 2033
- Table 49: Benelux Automotive Fly by Wire System Revenue (billion) Forecast, by Application 2020 & 2033
- Table 50: Benelux Automotive Fly by Wire System Volume (K) Forecast, by Application 2020 & 2033
- Table 51: Nordics Automotive Fly by Wire System Revenue (billion) Forecast, by Application 2020 & 2033
- Table 52: Nordics Automotive Fly by Wire System Volume (K) Forecast, by Application 2020 & 2033
- Table 53: Rest of Europe Automotive Fly by Wire System Revenue (billion) Forecast, by Application 2020 & 2033
- Table 54: Rest of Europe Automotive Fly by Wire System Volume (K) Forecast, by Application 2020 & 2033
- Table 55: Global Automotive Fly by Wire System Revenue billion Forecast, by Application 2020 & 2033
- Table 56: Global Automotive Fly by Wire System Volume K Forecast, by Application 2020 & 2033
- Table 57: Global Automotive Fly by Wire System Revenue billion Forecast, by Types 2020 & 2033
- Table 58: Global Automotive Fly by Wire System Volume K Forecast, by Types 2020 & 2033
- Table 59: Global Automotive Fly by Wire System Revenue billion Forecast, by Country 2020 & 2033
- Table 60: Global Automotive Fly by Wire System Volume K Forecast, by Country 2020 & 2033
- Table 61: Turkey Automotive Fly by Wire System Revenue (billion) Forecast, by Application 2020 & 2033
- Table 62: Turkey Automotive Fly by Wire System Volume (K) Forecast, by Application 2020 & 2033
- Table 63: Israel Automotive Fly by Wire System Revenue (billion) Forecast, by Application 2020 & 2033
- Table 64: Israel Automotive Fly by Wire System Volume (K) Forecast, by Application 2020 & 2033
- Table 65: GCC Automotive Fly by Wire System Revenue (billion) Forecast, by Application 2020 & 2033
- Table 66: GCC Automotive Fly by Wire System Volume (K) Forecast, by Application 2020 & 2033
- Table 67: North Africa Automotive Fly by Wire System Revenue (billion) Forecast, by Application 2020 & 2033
- Table 68: North Africa Automotive Fly by Wire System Volume (K) Forecast, by Application 2020 & 2033
- Table 69: South Africa Automotive Fly by Wire System Revenue (billion) Forecast, by Application 2020 & 2033
- Table 70: South Africa Automotive Fly by Wire System Volume (K) Forecast, by Application 2020 & 2033
- Table 71: Rest of Middle East & Africa Automotive Fly by Wire System Revenue (billion) Forecast, by Application 2020 & 2033
- Table 72: Rest of Middle East & Africa Automotive Fly by Wire System Volume (K) Forecast, by Application 2020 & 2033
- Table 73: Global Automotive Fly by Wire System Revenue billion Forecast, by Application 2020 & 2033
- Table 74: Global Automotive Fly by Wire System Volume K Forecast, by Application 2020 & 2033
- Table 75: Global Automotive Fly by Wire System Revenue billion Forecast, by Types 2020 & 2033
- Table 76: Global Automotive Fly by Wire System Volume K Forecast, by Types 2020 & 2033
- Table 77: Global Automotive Fly by Wire System Revenue billion Forecast, by Country 2020 & 2033
- Table 78: Global Automotive Fly by Wire System Volume K Forecast, by Country 2020 & 2033
- Table 79: China Automotive Fly by Wire System Revenue (billion) Forecast, by Application 2020 & 2033
- Table 80: China Automotive Fly by Wire System Volume (K) Forecast, by Application 2020 & 2033
- Table 81: India Automotive Fly by Wire System Revenue (billion) Forecast, by Application 2020 & 2033
- Table 82: India Automotive Fly by Wire System Volume (K) Forecast, by Application 2020 & 2033
- Table 83: Japan Automotive Fly by Wire System Revenue (billion) Forecast, by Application 2020 & 2033
- Table 84: Japan Automotive Fly by Wire System Volume (K) Forecast, by Application 2020 & 2033
- Table 85: South Korea Automotive Fly by Wire System Revenue (billion) Forecast, by Application 2020 & 2033
- Table 86: South Korea Automotive Fly by Wire System Volume (K) Forecast, by Application 2020 & 2033
- Table 87: ASEAN Automotive Fly by Wire System Revenue (billion) Forecast, by Application 2020 & 2033
- Table 88: ASEAN Automotive Fly by Wire System Volume (K) Forecast, by Application 2020 & 2033
- Table 89: Oceania Automotive Fly by Wire System Revenue (billion) Forecast, by Application 2020 & 2033
- Table 90: Oceania Automotive Fly by Wire System Volume (K) Forecast, by Application 2020 & 2033
- Table 91: Rest of Asia Pacific Automotive Fly by Wire System Revenue (billion) Forecast, by Application 2020 & 2033
- Table 92: Rest of Asia Pacific Automotive Fly by Wire System Volume (K) Forecast, by Application 2020 & 2033
Frequently Asked Questions
1. What is the projected Compound Annual Growth Rate (CAGR) of the Automotive Fly by Wire System?
The projected CAGR is approximately 7.18%.
2. Which companies are prominent players in the Automotive Fly by Wire System?
Key companies in the market include Nexteer Automobile, ZF, JTEKT, Bosch, Thyssenkrupp, Danfoss, NSK, Hitachi Astemo, Mando, Schaeffler Paravan Technologie GmbH & Co. KG.
3. What are the main segments of the Automotive Fly by Wire System?
The market segments include Application, Types.
4. Can you provide details about the market size?
The market size is estimated to be USD 15.43 billion as of 2022.
5. What are some drivers contributing to market growth?
N/A
6. What are the notable trends driving market growth?
N/A
7. Are there any restraints impacting market growth?
N/A
8. Can you provide examples of recent developments in the market?
N/A
9. What pricing options are available for accessing the report?
Pricing options include single-user, multi-user, and enterprise licenses priced at USD 3350.00, USD 5025.00, and USD 6700.00 respectively.
10. Is the market size provided in terms of value or volume?
The market size is provided in terms of value, measured in billion and volume, measured in K.
11. Are there any specific market keywords associated with the report?
Yes, the market keyword associated with the report is "Automotive Fly by Wire System," which aids in identifying and referencing the specific market segment covered.
12. How do I determine which pricing option suits my needs best?
The pricing options vary based on user requirements and access needs. Individual users may opt for single-user licenses, while businesses requiring broader access may choose multi-user or enterprise licenses for cost-effective access to the report.
13. Are there any additional resources or data provided in the Automotive Fly by Wire System report?
While the report offers comprehensive insights, it's advisable to review the specific contents or supplementary materials provided to ascertain if additional resources or data are available.
14. How can I stay updated on further developments or reports in the Automotive Fly by Wire System?
To stay informed about further developments, trends, and reports in the Automotive Fly by Wire System, consider subscribing to industry newsletters, following relevant companies and organizations, or regularly checking reputable industry news sources and publications.
Methodology
Step 1 - Identification of Relevant Samples Size from Population Database


Step 2 - Approaches for Defining Global Market Size (Value, Volume* & Price*)

Note*: In applicable scenarios
Step 3 - Data Sources
Primary Research
- Web Analytics
- Survey Reports
- Research Institute
- Latest Research Reports
- Opinion Leaders
Secondary Research
- Annual Reports
- White Paper
- Latest Press Release
- Industry Association
- Paid Database
- Investor Presentations

Step 4 - Data Triangulation
Involves using different sources of information in order to increase the validity of a study
These sources are likely to be stakeholders in a program - participants, other researchers, program staff, other community members, and so on.
Then we put all data in single framework & apply various statistical tools to find out the dynamic on the market.
During the analysis stage, feedback from the stakeholder groups would be compared to determine areas of agreement as well as areas of divergence