

Key Insights
The automotive cockpit multi-screen market is poised for significant expansion, propelled by escalating consumer demand for advanced in-vehicle infotainment and driver-assistance systems. Key growth drivers include the proliferation of connected cars, the integration of advanced driver-assistance systems (ADAS), and the increasing preference for personalized user experiences. Technological innovations, such as the development of high-resolution displays, intuitive user interfaces, and seamless smartphone integration, are further stimulating market momentum. The market is segmented by screen type (e.g., LCD, OLED), size, vehicle type (passenger cars, commercial vehicles), and geographical region. Leading industry participants include Visteon, Harman, FORVIA, Marelli, Aptiv, Bosch, Continental, Denso, Panasonic, BOE Technology, LG Display, and several prominent Chinese manufacturers. The accelerating adoption of electric and autonomous vehicles is anticipated to further boost market growth, as these vehicles typically feature more sophisticated and integrated multi-screen cockpits.
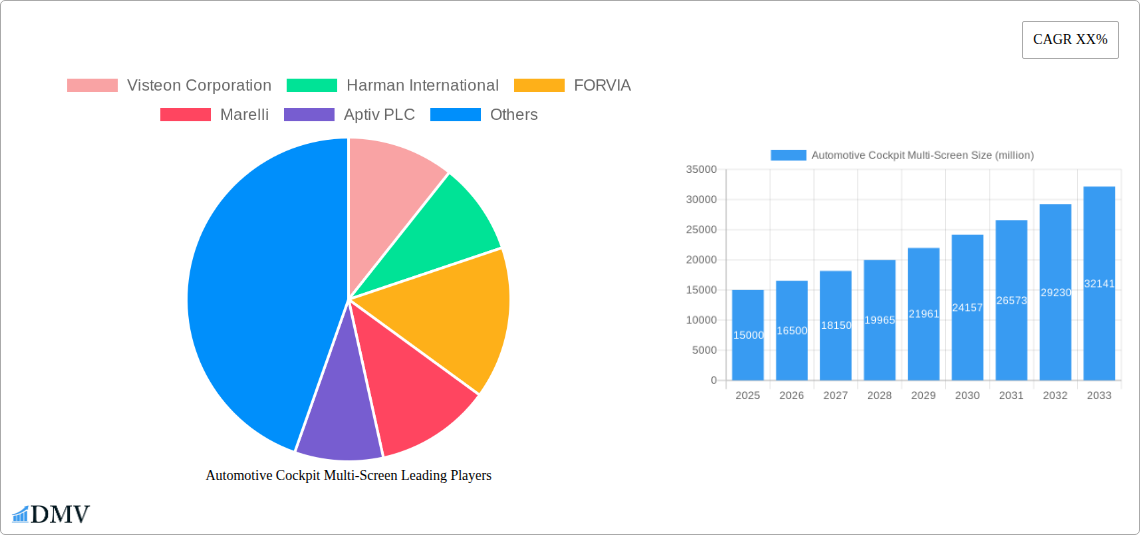
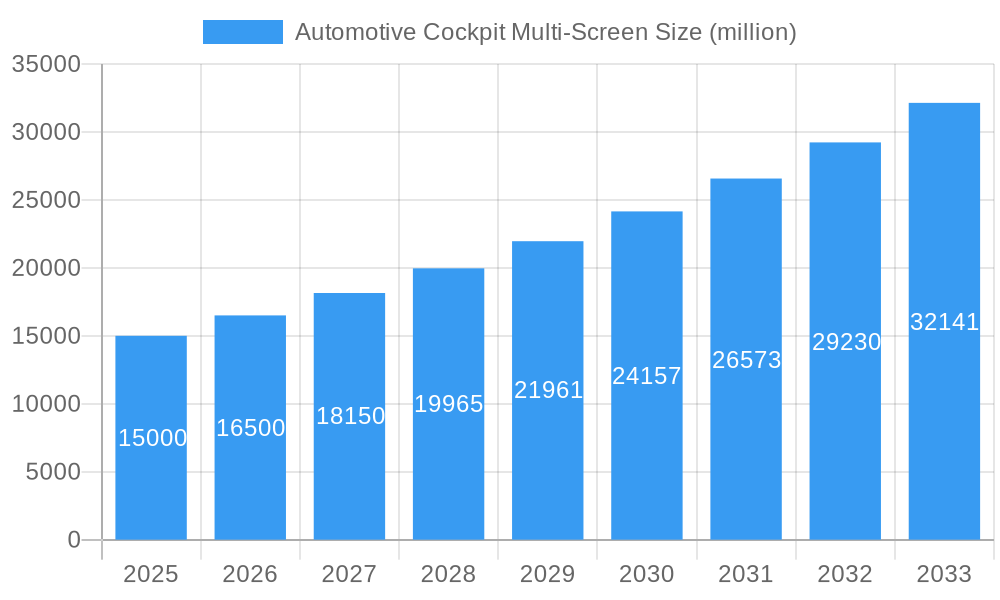
Automotive Cockpit Multi-Screen Market Size (In Billion)
Competition within the automotive cockpit multi-screen sector is robust, with established automotive suppliers and technology firms actively pursuing market share. Competitive advantage is derived from technological innovation, cost-efficiency, and the capacity to address evolving automaker requirements. While the market demonstrates considerable growth, challenges such as substantial initial investment in advanced display technologies and cybersecurity concerns exist. However, continuous technological advancements and strategic industry collaborations are expected to alleviate these obstacles. The forecast period, spanning from 2025 to 2033, is projected to witness substantial market expansion, particularly within emerging economies characterized by rising vehicle ownership and increasing disposable incomes. We forecast the market size to reach $27.76 billion by 2033, driven by an estimated Compound Annual Growth Rate (CAGR) of 8.85% and influenced by technological progress, heightened consumer demand, and expanding adoption across diverse vehicle segments.
Automotive Cockpit Multi-Screen Company Market Share
Automotive Cockpit Multi-Screen Market: A Comprehensive Report (2019-2033)
This insightful report provides a detailed analysis of the global Automotive Cockpit Multi-Screen market, projecting a market value exceeding $xx million by 2033. The study period covers 2019-2033, with 2025 as the base and estimated year. This comprehensive document offers a deep dive into market trends, competitive landscapes, technological advancements, and future growth opportunities, providing invaluable insights for stakeholders across the automotive industry.
Automotive Cockpit Multi-Screen Market Composition & Trends
The automotive cockpit multi-screen market is experiencing dynamic growth, driven by increasing consumer demand for enhanced in-vehicle infotainment and driver assistance systems. Market concentration is moderate, with key players like Visteon Corporation, Harman International, and Continental AG holding significant but not dominant market share. The xx million market in 2025 is expected to be distributed roughly as follows: Visteon (xx%), Harman (xx%), Continental (xx%), others (xx%). Innovation is spurred by advancements in display technologies (OLED, mini-LED), software integration (AI, cloud connectivity), and the rising adoption of advanced driver-assistance systems (ADAS). Stringent safety and emissions regulations are shaping the market, pushing for advanced features and user-friendly interfaces. Substitute products are limited, primarily consisting of simpler single-screen or analog instrument clusters. End-users include automotive OEMs and Tier-1 suppliers, predominantly targeting premium and luxury vehicle segments. Recent M&A activity indicates a consolidation trend, with deal values totaling an estimated $xx million in the past five years, mainly focused on strengthening technology portfolios and expanding global reach.
- Market Share Distribution (2025): Visteon (xx%), Harman (xx%), Continental (xx%), Others (xx%)
- M&A Deal Value (2019-2024): $xx million
- Key Innovation Catalysts: OLED displays, AI integration, ADAS features
- Regulatory Landscape: Stringent safety and emissions standards
Automotive Cockpit Multi-Screen Industry Evolution
The automotive cockpit multi-screen market has witnessed exponential growth over the past five years (2019-2024), exhibiting a CAGR of xx%. This growth is fueled by several key factors. Firstly, the increasing affordability and availability of advanced display technologies such as AMOLED and mini-LED are driving down the cost of implementation for automakers. Secondly, the integration of sophisticated software and AI is enabling more personalized and intuitive user experiences, significantly enhancing consumer satisfaction. The rising demand for connected car features, including seamless smartphone integration and over-the-air updates, further boosts market growth. Consumer preferences are shifting towards larger, higher-resolution displays with improved ergonomics and intuitive interfaces. The adoption rate of multi-screen cockpits is rapidly increasing across vehicle segments, with a significant uptake in the luxury and premium car segments and a gradual adoption in mass-market vehicles. By 2033, we anticipate a xx% penetration rate of multi-screen cockpits across all vehicle segments.
- CAGR (2019-2024): xx%
- Projected Market Value (2033): $xx million
- Adoption Rate (2033): xx%
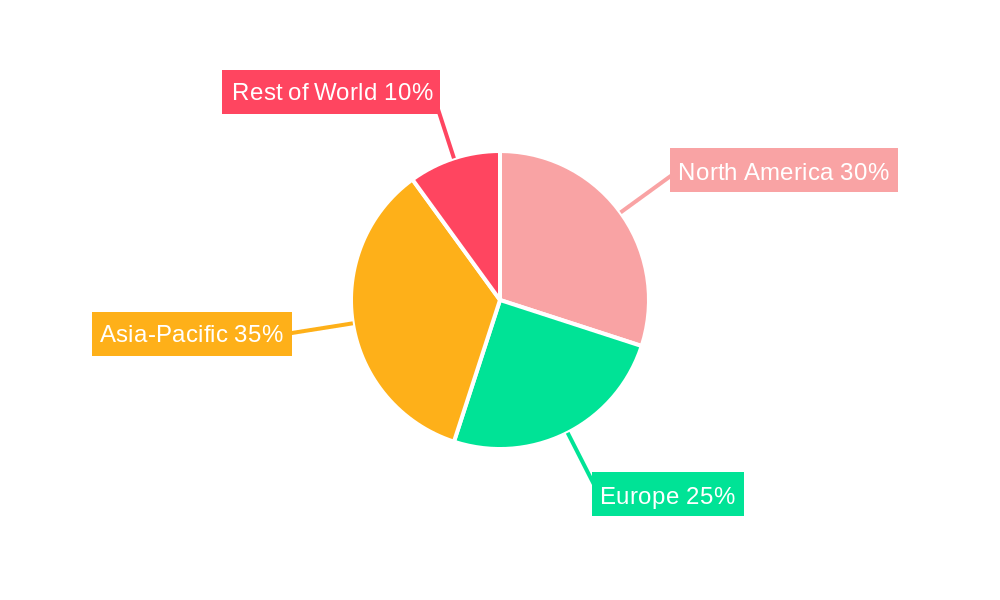
Leading Regions, Countries, or Segments in Automotive Cockpit Multi-Screen
The North American market currently leads in the adoption of automotive cockpit multi-screen systems, driven by robust economic conditions, a strong emphasis on vehicle technology, and government support for innovation. This dominance is further reinforced by the presence of major automakers and technology suppliers within the region.
- Key Drivers in North America: High consumer disposable income, advanced technology adoption, government incentives for innovation, presence of key players.
Other regions, such as Europe and Asia-Pacific, are exhibiting significant growth potential, driven by expanding vehicle production and increasing consumer demand for advanced in-vehicle technologies. However, the penetration rate in these regions is currently lower compared to North America, primarily due to factors like lower per capita income and varied regulatory landscapes. The luxury and premium vehicle segments demonstrate the highest adoption rates for multi-screen cockpits, primarily due to higher consumer willingness to pay for premium features and advanced technology.
Automotive Cockpit Multi-Screen Product Innovations
Recent innovations focus on improving display quality (higher resolution, wider color gamut), enhancing user interface (AI-powered personalization, gesture control), and improving safety features (integrated ADAS displays). Curved displays, transparent OLEDs, and augmented reality (AR) head-up displays are gaining traction, offering more immersive and information-rich driving experiences. These advancements contribute to unique selling propositions, such as improved driver safety, increased comfort, and enhanced personalization, driving market demand.
Propelling Factors for Automotive Cockpit Multi-Screen Growth
The growth of the automotive cockpit multi-screen market is propelled by several key factors. Technological advancements, including the development of higher-resolution displays and more sophisticated software, are driving the adoption of advanced in-vehicle infotainment and driver assistance systems. Increased consumer demand for personalized and intuitive user interfaces also plays a major role. Government regulations and safety standards are creating demand for more advanced driver-assistance systems, which typically incorporate multi-screen cockpits. Furthermore, the growing trend of connected cars and the increasing integration of smartphones with vehicles are further stimulating demand.
Obstacles in the Automotive Cockpit Multi-Screen Market
Challenges include the high initial investment costs associated with implementing multi-screen cockpits, which can be a barrier for mass-market vehicle manufacturers. Supply chain disruptions and the availability of key components, especially semiconductors, can also impact production and lead to delays. Intense competition among established and emerging players further complicates the market landscape. Finally, regulatory compliance across different regions and evolving standards can pose a challenge.
Future Opportunities in Automotive Cockpit Multi-Screen
Emerging opportunities lie in the integration of advanced technologies such as augmented reality (AR) and virtual reality (VR) into the automotive cockpit. The expansion into new markets, particularly in developing economies, offers substantial growth potential. Furthermore, the integration of personalized and customized user interfaces, driven by AI and machine learning, will enhance user experience and drive demand.
Major Players in the Automotive Cockpit Multi-Screen Ecosystem
- Visteon Corporation
- Harman International
- FORVIA
- Marelli
- Aptiv PLC
- Bosch
- Continental AG
- Denso Corporation
- Panasonic
- BOE Technology Group
- LG Display
- Huizhou Desay SV Automotive
- Foryou Group
- Huawei
- Ningbo Joyson Electronic
- Nobo Automotive Systems
- Huayu Automotive Systems
Key Developments in Automotive Cockpit Multi-Screen Industry
- 2022 Q4: Visteon launched its new SmartCore cockpit domain controller, integrating multiple screens and advanced features.
- 2023 Q1: Harman announced a strategic partnership with a major automotive OEM to develop a next-generation multi-screen cockpit system.
- 2023 Q2: Continental unveiled its advanced digital cockpit platform featuring AR-HUD technology. (Further developments to be added as available)
Strategic Automotive Cockpit Multi-Screen Market Forecast
The automotive cockpit multi-screen market is poised for sustained growth over the next decade. Technological advancements, increasing consumer demand, and supportive regulatory landscapes will continue to fuel market expansion. New opportunities in connected car technologies, AI-powered user interfaces, and expanded geographic markets will drive significant market potential, leading to a projected market value exceeding $xx million by 2033.
Automotive Cockpit Multi-Screen Segmentation
-
1. Application
- 1.1. Passenger Vehicles
- 1.2. Commercial Vehicles
-
2. Types
- 2.1. One Core Dual Screen
- 2.2. One Core 3 Screens
- 2.3. One Core 7 Screens
- 2.4. One Core 8 Screens
- 2.5. One Core 12 Screens
- 2.6. Other
Automotive Cockpit Multi-Screen Segmentation By Geography
-
1. North America
- 1.1. United States
- 1.2. Canada
- 1.3. Mexico
-
2. South America
- 2.1. Brazil
- 2.2. Argentina
- 2.3. Rest of South America
-
3. Europe
- 3.1. United Kingdom
- 3.2. Germany
- 3.3. France
- 3.4. Italy
- 3.5. Spain
- 3.6. Russia
- 3.7. Benelux
- 3.8. Nordics
- 3.9. Rest of Europe
-
4. Middle East & Africa
- 4.1. Turkey
- 4.2. Israel
- 4.3. GCC
- 4.4. North Africa
- 4.5. South Africa
- 4.6. Rest of Middle East & Africa
-
5. Asia Pacific
- 5.1. China
- 5.2. India
- 5.3. Japan
- 5.4. South Korea
- 5.5. ASEAN
- 5.6. Oceania
- 5.7. Rest of Asia Pacific
Automotive Cockpit Multi-Screen Regional Market Share
Geographic Coverage of Automotive Cockpit Multi-Screen
Automotive Cockpit Multi-Screen REPORT HIGHLIGHTS
| Aspects | Details |
|---|---|
| Study Period | 2020-2034 |
| Base Year | 2025 |
| Estimated Year | 2026 |
| Forecast Period | 2026-2034 |
| Historical Period | 2020-2025 |
| Growth Rate | CAGR of 8.85% from 2020-2034 |
| Segmentation |
|
Table of Contents
- 1. Introduction
- 1.1. Research Scope
- 1.2. Market Segmentation
- 1.3. Research Methodology
- 1.4. Definitions and Assumptions
- 2. Executive Summary
- 2.1. Introduction
- 3. Market Dynamics
- 3.1. Introduction
- 3.2. Market Drivers
- 3.3. Market Restrains
- 3.4. Market Trends
- 4. Market Factor Analysis
- 4.1. Porters Five Forces
- 4.2. Supply/Value Chain
- 4.3. PESTEL analysis
- 4.4. Market Entropy
- 4.5. Patent/Trademark Analysis
- 5. Global Automotive Cockpit Multi-Screen Analysis, Insights and Forecast, 2020-2032
- 5.1. Market Analysis, Insights and Forecast - by Application
- 5.1.1. Passenger Vehicles
- 5.1.2. Commercial Vehicles
- 5.2. Market Analysis, Insights and Forecast - by Types
- 5.2.1. One Core Dual Screen
- 5.2.2. One Core 3 Screens
- 5.2.3. One Core 7 Screens
- 5.2.4. One Core 8 Screens
- 5.2.5. One Core 12 Screens
- 5.2.6. Other
- 5.3. Market Analysis, Insights and Forecast - by Region
- 5.3.1. North America
- 5.3.2. South America
- 5.3.3. Europe
- 5.3.4. Middle East & Africa
- 5.3.5. Asia Pacific
- 5.1. Market Analysis, Insights and Forecast - by Application
- 6. North America Automotive Cockpit Multi-Screen Analysis, Insights and Forecast, 2020-2032
- 6.1. Market Analysis, Insights and Forecast - by Application
- 6.1.1. Passenger Vehicles
- 6.1.2. Commercial Vehicles
- 6.2. Market Analysis, Insights and Forecast - by Types
- 6.2.1. One Core Dual Screen
- 6.2.2. One Core 3 Screens
- 6.2.3. One Core 7 Screens
- 6.2.4. One Core 8 Screens
- 6.2.5. One Core 12 Screens
- 6.2.6. Other
- 6.1. Market Analysis, Insights and Forecast - by Application
- 7. South America Automotive Cockpit Multi-Screen Analysis, Insights and Forecast, 2020-2032
- 7.1. Market Analysis, Insights and Forecast - by Application
- 7.1.1. Passenger Vehicles
- 7.1.2. Commercial Vehicles
- 7.2. Market Analysis, Insights and Forecast - by Types
- 7.2.1. One Core Dual Screen
- 7.2.2. One Core 3 Screens
- 7.2.3. One Core 7 Screens
- 7.2.4. One Core 8 Screens
- 7.2.5. One Core 12 Screens
- 7.2.6. Other
- 7.1. Market Analysis, Insights and Forecast - by Application
- 8. Europe Automotive Cockpit Multi-Screen Analysis, Insights and Forecast, 2020-2032
- 8.1. Market Analysis, Insights and Forecast - by Application
- 8.1.1. Passenger Vehicles
- 8.1.2. Commercial Vehicles
- 8.2. Market Analysis, Insights and Forecast - by Types
- 8.2.1. One Core Dual Screen
- 8.2.2. One Core 3 Screens
- 8.2.3. One Core 7 Screens
- 8.2.4. One Core 8 Screens
- 8.2.5. One Core 12 Screens
- 8.2.6. Other
- 8.1. Market Analysis, Insights and Forecast - by Application
- 9. Middle East & Africa Automotive Cockpit Multi-Screen Analysis, Insights and Forecast, 2020-2032
- 9.1. Market Analysis, Insights and Forecast - by Application
- 9.1.1. Passenger Vehicles
- 9.1.2. Commercial Vehicles
- 9.2. Market Analysis, Insights and Forecast - by Types
- 9.2.1. One Core Dual Screen
- 9.2.2. One Core 3 Screens
- 9.2.3. One Core 7 Screens
- 9.2.4. One Core 8 Screens
- 9.2.5. One Core 12 Screens
- 9.2.6. Other
- 9.1. Market Analysis, Insights and Forecast - by Application
- 10. Asia Pacific Automotive Cockpit Multi-Screen Analysis, Insights and Forecast, 2020-2032
- 10.1. Market Analysis, Insights and Forecast - by Application
- 10.1.1. Passenger Vehicles
- 10.1.2. Commercial Vehicles
- 10.2. Market Analysis, Insights and Forecast - by Types
- 10.2.1. One Core Dual Screen
- 10.2.2. One Core 3 Screens
- 10.2.3. One Core 7 Screens
- 10.2.4. One Core 8 Screens
- 10.2.5. One Core 12 Screens
- 10.2.6. Other
- 10.1. Market Analysis, Insights and Forecast - by Application
- 11. Competitive Analysis
- 11.1. Global Market Share Analysis 2025
- 11.2. Company Profiles
- 11.2.1 Visteon Corporation
- 11.2.1.1. Overview
- 11.2.1.2. Products
- 11.2.1.3. SWOT Analysis
- 11.2.1.4. Recent Developments
- 11.2.1.5. Financials (Based on Availability)
- 11.2.2 Harman International
- 11.2.2.1. Overview
- 11.2.2.2. Products
- 11.2.2.3. SWOT Analysis
- 11.2.2.4. Recent Developments
- 11.2.2.5. Financials (Based on Availability)
- 11.2.3 FORVIA
- 11.2.3.1. Overview
- 11.2.3.2. Products
- 11.2.3.3. SWOT Analysis
- 11.2.3.4. Recent Developments
- 11.2.3.5. Financials (Based on Availability)
- 11.2.4 Marelli
- 11.2.4.1. Overview
- 11.2.4.2. Products
- 11.2.4.3. SWOT Analysis
- 11.2.4.4. Recent Developments
- 11.2.4.5. Financials (Based on Availability)
- 11.2.5 Aptiv PLC
- 11.2.5.1. Overview
- 11.2.5.2. Products
- 11.2.5.3. SWOT Analysis
- 11.2.5.4. Recent Developments
- 11.2.5.5. Financials (Based on Availability)
- 11.2.6 Bosch
- 11.2.6.1. Overview
- 11.2.6.2. Products
- 11.2.6.3. SWOT Analysis
- 11.2.6.4. Recent Developments
- 11.2.6.5. Financials (Based on Availability)
- 11.2.7 Continental AG
- 11.2.7.1. Overview
- 11.2.7.2. Products
- 11.2.7.3. SWOT Analysis
- 11.2.7.4. Recent Developments
- 11.2.7.5. Financials (Based on Availability)
- 11.2.8 Denso Corporation
- 11.2.8.1. Overview
- 11.2.8.2. Products
- 11.2.8.3. SWOT Analysis
- 11.2.8.4. Recent Developments
- 11.2.8.5. Financials (Based on Availability)
- 11.2.9 Panasonic
- 11.2.9.1. Overview
- 11.2.9.2. Products
- 11.2.9.3. SWOT Analysis
- 11.2.9.4. Recent Developments
- 11.2.9.5. Financials (Based on Availability)
- 11.2.10 BOE Technology Group
- 11.2.10.1. Overview
- 11.2.10.2. Products
- 11.2.10.3. SWOT Analysis
- 11.2.10.4. Recent Developments
- 11.2.10.5. Financials (Based on Availability)
- 11.2.11 LG Display
- 11.2.11.1. Overview
- 11.2.11.2. Products
- 11.2.11.3. SWOT Analysis
- 11.2.11.4. Recent Developments
- 11.2.11.5. Financials (Based on Availability)
- 11.2.12 Huizhou Desay SV Automotive
- 11.2.12.1. Overview
- 11.2.12.2. Products
- 11.2.12.3. SWOT Analysis
- 11.2.12.4. Recent Developments
- 11.2.12.5. Financials (Based on Availability)
- 11.2.13 Foryou Group
- 11.2.13.1. Overview
- 11.2.13.2. Products
- 11.2.13.3. SWOT Analysis
- 11.2.13.4. Recent Developments
- 11.2.13.5. Financials (Based on Availability)
- 11.2.14 Huawei
- 11.2.14.1. Overview
- 11.2.14.2. Products
- 11.2.14.3. SWOT Analysis
- 11.2.14.4. Recent Developments
- 11.2.14.5. Financials (Based on Availability)
- 11.2.15 Ningbo Joyson Electronic
- 11.2.15.1. Overview
- 11.2.15.2. Products
- 11.2.15.3. SWOT Analysis
- 11.2.15.4. Recent Developments
- 11.2.15.5. Financials (Based on Availability)
- 11.2.16 Nobo Automotive Systems
- 11.2.16.1. Overview
- 11.2.16.2. Products
- 11.2.16.3. SWOT Analysis
- 11.2.16.4. Recent Developments
- 11.2.16.5. Financials (Based on Availability)
- 11.2.17 Huayu Automotive Systems
- 11.2.17.1. Overview
- 11.2.17.2. Products
- 11.2.17.3. SWOT Analysis
- 11.2.17.4. Recent Developments
- 11.2.17.5. Financials (Based on Availability)
- 11.2.1 Visteon Corporation
List of Figures
- Figure 1: Global Automotive Cockpit Multi-Screen Revenue Breakdown (billion, %) by Region 2025 & 2033
- Figure 2: Global Automotive Cockpit Multi-Screen Volume Breakdown (K, %) by Region 2025 & 2033
- Figure 3: North America Automotive Cockpit Multi-Screen Revenue (billion), by Application 2025 & 2033
- Figure 4: North America Automotive Cockpit Multi-Screen Volume (K), by Application 2025 & 2033
- Figure 5: North America Automotive Cockpit Multi-Screen Revenue Share (%), by Application 2025 & 2033
- Figure 6: North America Automotive Cockpit Multi-Screen Volume Share (%), by Application 2025 & 2033
- Figure 7: North America Automotive Cockpit Multi-Screen Revenue (billion), by Types 2025 & 2033
- Figure 8: North America Automotive Cockpit Multi-Screen Volume (K), by Types 2025 & 2033
- Figure 9: North America Automotive Cockpit Multi-Screen Revenue Share (%), by Types 2025 & 2033
- Figure 10: North America Automotive Cockpit Multi-Screen Volume Share (%), by Types 2025 & 2033
- Figure 11: North America Automotive Cockpit Multi-Screen Revenue (billion), by Country 2025 & 2033
- Figure 12: North America Automotive Cockpit Multi-Screen Volume (K), by Country 2025 & 2033
- Figure 13: North America Automotive Cockpit Multi-Screen Revenue Share (%), by Country 2025 & 2033
- Figure 14: North America Automotive Cockpit Multi-Screen Volume Share (%), by Country 2025 & 2033
- Figure 15: South America Automotive Cockpit Multi-Screen Revenue (billion), by Application 2025 & 2033
- Figure 16: South America Automotive Cockpit Multi-Screen Volume (K), by Application 2025 & 2033
- Figure 17: South America Automotive Cockpit Multi-Screen Revenue Share (%), by Application 2025 & 2033
- Figure 18: South America Automotive Cockpit Multi-Screen Volume Share (%), by Application 2025 & 2033
- Figure 19: South America Automotive Cockpit Multi-Screen Revenue (billion), by Types 2025 & 2033
- Figure 20: South America Automotive Cockpit Multi-Screen Volume (K), by Types 2025 & 2033
- Figure 21: South America Automotive Cockpit Multi-Screen Revenue Share (%), by Types 2025 & 2033
- Figure 22: South America Automotive Cockpit Multi-Screen Volume Share (%), by Types 2025 & 2033
- Figure 23: South America Automotive Cockpit Multi-Screen Revenue (billion), by Country 2025 & 2033
- Figure 24: South America Automotive Cockpit Multi-Screen Volume (K), by Country 2025 & 2033
- Figure 25: South America Automotive Cockpit Multi-Screen Revenue Share (%), by Country 2025 & 2033
- Figure 26: South America Automotive Cockpit Multi-Screen Volume Share (%), by Country 2025 & 2033
- Figure 27: Europe Automotive Cockpit Multi-Screen Revenue (billion), by Application 2025 & 2033
- Figure 28: Europe Automotive Cockpit Multi-Screen Volume (K), by Application 2025 & 2033
- Figure 29: Europe Automotive Cockpit Multi-Screen Revenue Share (%), by Application 2025 & 2033
- Figure 30: Europe Automotive Cockpit Multi-Screen Volume Share (%), by Application 2025 & 2033
- Figure 31: Europe Automotive Cockpit Multi-Screen Revenue (billion), by Types 2025 & 2033
- Figure 32: Europe Automotive Cockpit Multi-Screen Volume (K), by Types 2025 & 2033
- Figure 33: Europe Automotive Cockpit Multi-Screen Revenue Share (%), by Types 2025 & 2033
- Figure 34: Europe Automotive Cockpit Multi-Screen Volume Share (%), by Types 2025 & 2033
- Figure 35: Europe Automotive Cockpit Multi-Screen Revenue (billion), by Country 2025 & 2033
- Figure 36: Europe Automotive Cockpit Multi-Screen Volume (K), by Country 2025 & 2033
- Figure 37: Europe Automotive Cockpit Multi-Screen Revenue Share (%), by Country 2025 & 2033
- Figure 38: Europe Automotive Cockpit Multi-Screen Volume Share (%), by Country 2025 & 2033
- Figure 39: Middle East & Africa Automotive Cockpit Multi-Screen Revenue (billion), by Application 2025 & 2033
- Figure 40: Middle East & Africa Automotive Cockpit Multi-Screen Volume (K), by Application 2025 & 2033
- Figure 41: Middle East & Africa Automotive Cockpit Multi-Screen Revenue Share (%), by Application 2025 & 2033
- Figure 42: Middle East & Africa Automotive Cockpit Multi-Screen Volume Share (%), by Application 2025 & 2033
- Figure 43: Middle East & Africa Automotive Cockpit Multi-Screen Revenue (billion), by Types 2025 & 2033
- Figure 44: Middle East & Africa Automotive Cockpit Multi-Screen Volume (K), by Types 2025 & 2033
- Figure 45: Middle East & Africa Automotive Cockpit Multi-Screen Revenue Share (%), by Types 2025 & 2033
- Figure 46: Middle East & Africa Automotive Cockpit Multi-Screen Volume Share (%), by Types 2025 & 2033
- Figure 47: Middle East & Africa Automotive Cockpit Multi-Screen Revenue (billion), by Country 2025 & 2033
- Figure 48: Middle East & Africa Automotive Cockpit Multi-Screen Volume (K), by Country 2025 & 2033
- Figure 49: Middle East & Africa Automotive Cockpit Multi-Screen Revenue Share (%), by Country 2025 & 2033
- Figure 50: Middle East & Africa Automotive Cockpit Multi-Screen Volume Share (%), by Country 2025 & 2033
- Figure 51: Asia Pacific Automotive Cockpit Multi-Screen Revenue (billion), by Application 2025 & 2033
- Figure 52: Asia Pacific Automotive Cockpit Multi-Screen Volume (K), by Application 2025 & 2033
- Figure 53: Asia Pacific Automotive Cockpit Multi-Screen Revenue Share (%), by Application 2025 & 2033
- Figure 54: Asia Pacific Automotive Cockpit Multi-Screen Volume Share (%), by Application 2025 & 2033
- Figure 55: Asia Pacific Automotive Cockpit Multi-Screen Revenue (billion), by Types 2025 & 2033
- Figure 56: Asia Pacific Automotive Cockpit Multi-Screen Volume (K), by Types 2025 & 2033
- Figure 57: Asia Pacific Automotive Cockpit Multi-Screen Revenue Share (%), by Types 2025 & 2033
- Figure 58: Asia Pacific Automotive Cockpit Multi-Screen Volume Share (%), by Types 2025 & 2033
- Figure 59: Asia Pacific Automotive Cockpit Multi-Screen Revenue (billion), by Country 2025 & 2033
- Figure 60: Asia Pacific Automotive Cockpit Multi-Screen Volume (K), by Country 2025 & 2033
- Figure 61: Asia Pacific Automotive Cockpit Multi-Screen Revenue Share (%), by Country 2025 & 2033
- Figure 62: Asia Pacific Automotive Cockpit Multi-Screen Volume Share (%), by Country 2025 & 2033
List of Tables
- Table 1: Global Automotive Cockpit Multi-Screen Revenue billion Forecast, by Application 2020 & 2033
- Table 2: Global Automotive Cockpit Multi-Screen Volume K Forecast, by Application 2020 & 2033
- Table 3: Global Automotive Cockpit Multi-Screen Revenue billion Forecast, by Types 2020 & 2033
- Table 4: Global Automotive Cockpit Multi-Screen Volume K Forecast, by Types 2020 & 2033
- Table 5: Global Automotive Cockpit Multi-Screen Revenue billion Forecast, by Region 2020 & 2033
- Table 6: Global Automotive Cockpit Multi-Screen Volume K Forecast, by Region 2020 & 2033
- Table 7: Global Automotive Cockpit Multi-Screen Revenue billion Forecast, by Application 2020 & 2033
- Table 8: Global Automotive Cockpit Multi-Screen Volume K Forecast, by Application 2020 & 2033
- Table 9: Global Automotive Cockpit Multi-Screen Revenue billion Forecast, by Types 2020 & 2033
- Table 10: Global Automotive Cockpit Multi-Screen Volume K Forecast, by Types 2020 & 2033
- Table 11: Global Automotive Cockpit Multi-Screen Revenue billion Forecast, by Country 2020 & 2033
- Table 12: Global Automotive Cockpit Multi-Screen Volume K Forecast, by Country 2020 & 2033
- Table 13: United States Automotive Cockpit Multi-Screen Revenue (billion) Forecast, by Application 2020 & 2033
- Table 14: United States Automotive Cockpit Multi-Screen Volume (K) Forecast, by Application 2020 & 2033
- Table 15: Canada Automotive Cockpit Multi-Screen Revenue (billion) Forecast, by Application 2020 & 2033
- Table 16: Canada Automotive Cockpit Multi-Screen Volume (K) Forecast, by Application 2020 & 2033
- Table 17: Mexico Automotive Cockpit Multi-Screen Revenue (billion) Forecast, by Application 2020 & 2033
- Table 18: Mexico Automotive Cockpit Multi-Screen Volume (K) Forecast, by Application 2020 & 2033
- Table 19: Global Automotive Cockpit Multi-Screen Revenue billion Forecast, by Application 2020 & 2033
- Table 20: Global Automotive Cockpit Multi-Screen Volume K Forecast, by Application 2020 & 2033
- Table 21: Global Automotive Cockpit Multi-Screen Revenue billion Forecast, by Types 2020 & 2033
- Table 22: Global Automotive Cockpit Multi-Screen Volume K Forecast, by Types 2020 & 2033
- Table 23: Global Automotive Cockpit Multi-Screen Revenue billion Forecast, by Country 2020 & 2033
- Table 24: Global Automotive Cockpit Multi-Screen Volume K Forecast, by Country 2020 & 2033
- Table 25: Brazil Automotive Cockpit Multi-Screen Revenue (billion) Forecast, by Application 2020 & 2033
- Table 26: Brazil Automotive Cockpit Multi-Screen Volume (K) Forecast, by Application 2020 & 2033
- Table 27: Argentina Automotive Cockpit Multi-Screen Revenue (billion) Forecast, by Application 2020 & 2033
- Table 28: Argentina Automotive Cockpit Multi-Screen Volume (K) Forecast, by Application 2020 & 2033
- Table 29: Rest of South America Automotive Cockpit Multi-Screen Revenue (billion) Forecast, by Application 2020 & 2033
- Table 30: Rest of South America Automotive Cockpit Multi-Screen Volume (K) Forecast, by Application 2020 & 2033
- Table 31: Global Automotive Cockpit Multi-Screen Revenue billion Forecast, by Application 2020 & 2033
- Table 32: Global Automotive Cockpit Multi-Screen Volume K Forecast, by Application 2020 & 2033
- Table 33: Global Automotive Cockpit Multi-Screen Revenue billion Forecast, by Types 2020 & 2033
- Table 34: Global Automotive Cockpit Multi-Screen Volume K Forecast, by Types 2020 & 2033
- Table 35: Global Automotive Cockpit Multi-Screen Revenue billion Forecast, by Country 2020 & 2033
- Table 36: Global Automotive Cockpit Multi-Screen Volume K Forecast, by Country 2020 & 2033
- Table 37: United Kingdom Automotive Cockpit Multi-Screen Revenue (billion) Forecast, by Application 2020 & 2033
- Table 38: United Kingdom Automotive Cockpit Multi-Screen Volume (K) Forecast, by Application 2020 & 2033
- Table 39: Germany Automotive Cockpit Multi-Screen Revenue (billion) Forecast, by Application 2020 & 2033
- Table 40: Germany Automotive Cockpit Multi-Screen Volume (K) Forecast, by Application 2020 & 2033
- Table 41: France Automotive Cockpit Multi-Screen Revenue (billion) Forecast, by Application 2020 & 2033
- Table 42: France Automotive Cockpit Multi-Screen Volume (K) Forecast, by Application 2020 & 2033
- Table 43: Italy Automotive Cockpit Multi-Screen Revenue (billion) Forecast, by Application 2020 & 2033
- Table 44: Italy Automotive Cockpit Multi-Screen Volume (K) Forecast, by Application 2020 & 2033
- Table 45: Spain Automotive Cockpit Multi-Screen Revenue (billion) Forecast, by Application 2020 & 2033
- Table 46: Spain Automotive Cockpit Multi-Screen Volume (K) Forecast, by Application 2020 & 2033
- Table 47: Russia Automotive Cockpit Multi-Screen Revenue (billion) Forecast, by Application 2020 & 2033
- Table 48: Russia Automotive Cockpit Multi-Screen Volume (K) Forecast, by Application 2020 & 2033
- Table 49: Benelux Automotive Cockpit Multi-Screen Revenue (billion) Forecast, by Application 2020 & 2033
- Table 50: Benelux Automotive Cockpit Multi-Screen Volume (K) Forecast, by Application 2020 & 2033
- Table 51: Nordics Automotive Cockpit Multi-Screen Revenue (billion) Forecast, by Application 2020 & 2033
- Table 52: Nordics Automotive Cockpit Multi-Screen Volume (K) Forecast, by Application 2020 & 2033
- Table 53: Rest of Europe Automotive Cockpit Multi-Screen Revenue (billion) Forecast, by Application 2020 & 2033
- Table 54: Rest of Europe Automotive Cockpit Multi-Screen Volume (K) Forecast, by Application 2020 & 2033
- Table 55: Global Automotive Cockpit Multi-Screen Revenue billion Forecast, by Application 2020 & 2033
- Table 56: Global Automotive Cockpit Multi-Screen Volume K Forecast, by Application 2020 & 2033
- Table 57: Global Automotive Cockpit Multi-Screen Revenue billion Forecast, by Types 2020 & 2033
- Table 58: Global Automotive Cockpit Multi-Screen Volume K Forecast, by Types 2020 & 2033
- Table 59: Global Automotive Cockpit Multi-Screen Revenue billion Forecast, by Country 2020 & 2033
- Table 60: Global Automotive Cockpit Multi-Screen Volume K Forecast, by Country 2020 & 2033
- Table 61: Turkey Automotive Cockpit Multi-Screen Revenue (billion) Forecast, by Application 2020 & 2033
- Table 62: Turkey Automotive Cockpit Multi-Screen Volume (K) Forecast, by Application 2020 & 2033
- Table 63: Israel Automotive Cockpit Multi-Screen Revenue (billion) Forecast, by Application 2020 & 2033
- Table 64: Israel Automotive Cockpit Multi-Screen Volume (K) Forecast, by Application 2020 & 2033
- Table 65: GCC Automotive Cockpit Multi-Screen Revenue (billion) Forecast, by Application 2020 & 2033
- Table 66: GCC Automotive Cockpit Multi-Screen Volume (K) Forecast, by Application 2020 & 2033
- Table 67: North Africa Automotive Cockpit Multi-Screen Revenue (billion) Forecast, by Application 2020 & 2033
- Table 68: North Africa Automotive Cockpit Multi-Screen Volume (K) Forecast, by Application 2020 & 2033
- Table 69: South Africa Automotive Cockpit Multi-Screen Revenue (billion) Forecast, by Application 2020 & 2033
- Table 70: South Africa Automotive Cockpit Multi-Screen Volume (K) Forecast, by Application 2020 & 2033
- Table 71: Rest of Middle East & Africa Automotive Cockpit Multi-Screen Revenue (billion) Forecast, by Application 2020 & 2033
- Table 72: Rest of Middle East & Africa Automotive Cockpit Multi-Screen Volume (K) Forecast, by Application 2020 & 2033
- Table 73: Global Automotive Cockpit Multi-Screen Revenue billion Forecast, by Application 2020 & 2033
- Table 74: Global Automotive Cockpit Multi-Screen Volume K Forecast, by Application 2020 & 2033
- Table 75: Global Automotive Cockpit Multi-Screen Revenue billion Forecast, by Types 2020 & 2033
- Table 76: Global Automotive Cockpit Multi-Screen Volume K Forecast, by Types 2020 & 2033
- Table 77: Global Automotive Cockpit Multi-Screen Revenue billion Forecast, by Country 2020 & 2033
- Table 78: Global Automotive Cockpit Multi-Screen Volume K Forecast, by Country 2020 & 2033
- Table 79: China Automotive Cockpit Multi-Screen Revenue (billion) Forecast, by Application 2020 & 2033
- Table 80: China Automotive Cockpit Multi-Screen Volume (K) Forecast, by Application 2020 & 2033
- Table 81: India Automotive Cockpit Multi-Screen Revenue (billion) Forecast, by Application 2020 & 2033
- Table 82: India Automotive Cockpit Multi-Screen Volume (K) Forecast, by Application 2020 & 2033
- Table 83: Japan Automotive Cockpit Multi-Screen Revenue (billion) Forecast, by Application 2020 & 2033
- Table 84: Japan Automotive Cockpit Multi-Screen Volume (K) Forecast, by Application 2020 & 2033
- Table 85: South Korea Automotive Cockpit Multi-Screen Revenue (billion) Forecast, by Application 2020 & 2033
- Table 86: South Korea Automotive Cockpit Multi-Screen Volume (K) Forecast, by Application 2020 & 2033
- Table 87: ASEAN Automotive Cockpit Multi-Screen Revenue (billion) Forecast, by Application 2020 & 2033
- Table 88: ASEAN Automotive Cockpit Multi-Screen Volume (K) Forecast, by Application 2020 & 2033
- Table 89: Oceania Automotive Cockpit Multi-Screen Revenue (billion) Forecast, by Application 2020 & 2033
- Table 90: Oceania Automotive Cockpit Multi-Screen Volume (K) Forecast, by Application 2020 & 2033
- Table 91: Rest of Asia Pacific Automotive Cockpit Multi-Screen Revenue (billion) Forecast, by Application 2020 & 2033
- Table 92: Rest of Asia Pacific Automotive Cockpit Multi-Screen Volume (K) Forecast, by Application 2020 & 2033
Frequently Asked Questions
1. What is the projected Compound Annual Growth Rate (CAGR) of the Automotive Cockpit Multi-Screen?
The projected CAGR is approximately 8.85%.
2. Which companies are prominent players in the Automotive Cockpit Multi-Screen?
Key companies in the market include Visteon Corporation, Harman International, FORVIA, Marelli, Aptiv PLC, Bosch, Continental AG, Denso Corporation, Panasonic, BOE Technology Group, LG Display, Huizhou Desay SV Automotive, Foryou Group, Huawei, Ningbo Joyson Electronic, Nobo Automotive Systems, Huayu Automotive Systems.
3. What are the main segments of the Automotive Cockpit Multi-Screen?
The market segments include Application, Types.
4. Can you provide details about the market size?
The market size is estimated to be USD 27.76 billion as of 2022.
5. What are some drivers contributing to market growth?
N/A
6. What are the notable trends driving market growth?
N/A
7. Are there any restraints impacting market growth?
N/A
8. Can you provide examples of recent developments in the market?
N/A
9. What pricing options are available for accessing the report?
Pricing options include single-user, multi-user, and enterprise licenses priced at USD 4350.00, USD 6525.00, and USD 8700.00 respectively.
10. Is the market size provided in terms of value or volume?
The market size is provided in terms of value, measured in billion and volume, measured in K.
11. Are there any specific market keywords associated with the report?
Yes, the market keyword associated with the report is "Automotive Cockpit Multi-Screen," which aids in identifying and referencing the specific market segment covered.
12. How do I determine which pricing option suits my needs best?
The pricing options vary based on user requirements and access needs. Individual users may opt for single-user licenses, while businesses requiring broader access may choose multi-user or enterprise licenses for cost-effective access to the report.
13. Are there any additional resources or data provided in the Automotive Cockpit Multi-Screen report?
While the report offers comprehensive insights, it's advisable to review the specific contents or supplementary materials provided to ascertain if additional resources or data are available.
14. How can I stay updated on further developments or reports in the Automotive Cockpit Multi-Screen?
To stay informed about further developments, trends, and reports in the Automotive Cockpit Multi-Screen, consider subscribing to industry newsletters, following relevant companies and organizations, or regularly checking reputable industry news sources and publications.
Methodology
Step 1 - Identification of Relevant Samples Size from Population Database


Step 2 - Approaches for Defining Global Market Size (Value, Volume* & Price*)

Note*: In applicable scenarios
Step 3 - Data Sources
Primary Research
- Web Analytics
- Survey Reports
- Research Institute
- Latest Research Reports
- Opinion Leaders
Secondary Research
- Annual Reports
- White Paper
- Latest Press Release
- Industry Association
- Paid Database
- Investor Presentations

Step 4 - Data Triangulation
Involves using different sources of information in order to increase the validity of a study
These sources are likely to be stakeholders in a program - participants, other researchers, program staff, other community members, and so on.
Then we put all data in single framework & apply various statistical tools to find out the dynamic on the market.
During the analysis stage, feedback from the stakeholder groups would be compared to determine areas of agreement as well as areas of divergence