

Key Insights
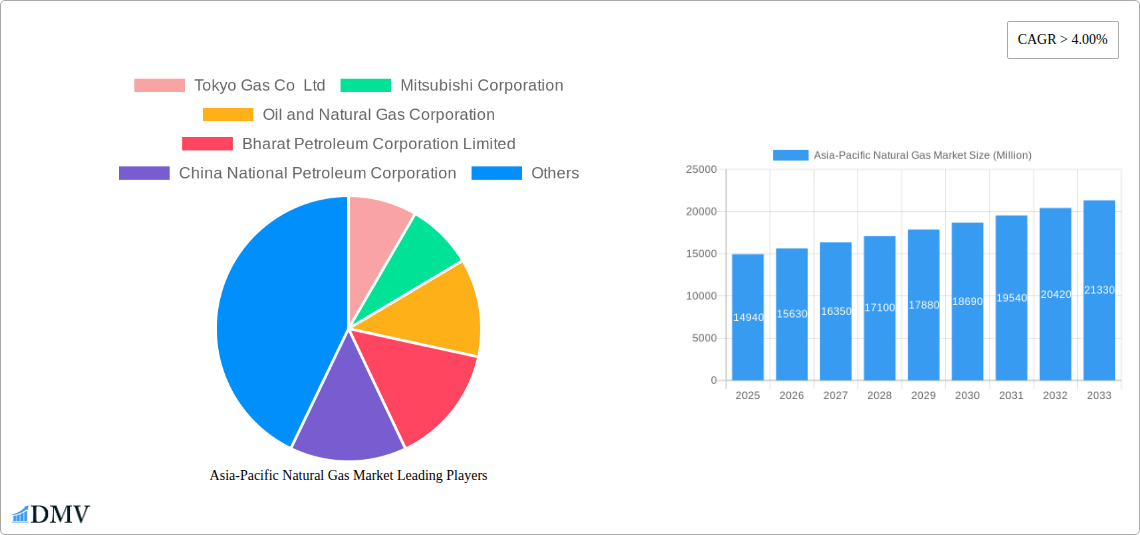
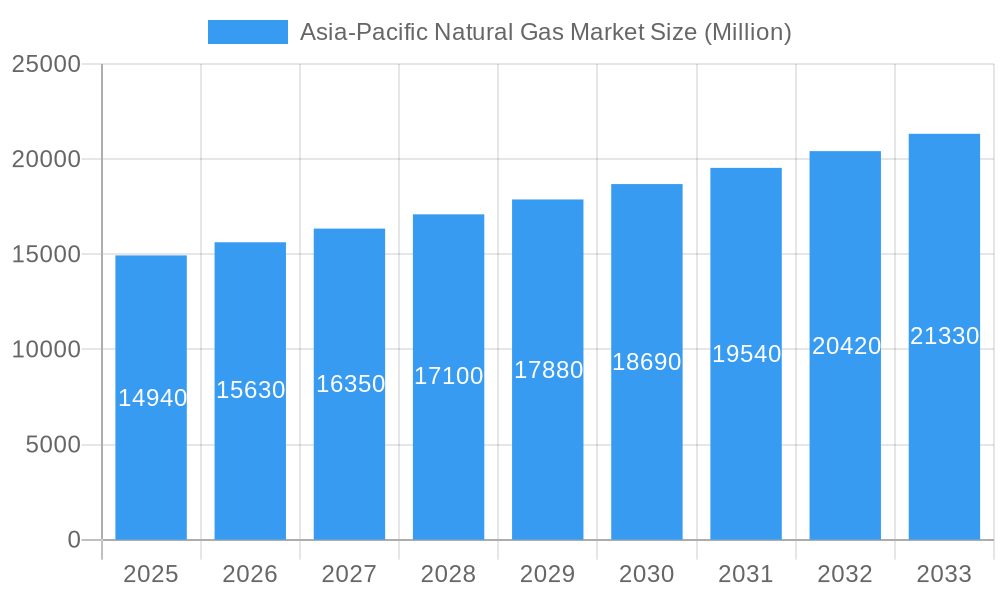
The Asia-Pacific Natural Gas Market, valued at $14,940 million in 2025, is projected for robust growth, exhibiting a Compound Annual Growth Rate (CAGR) exceeding 4% from 2025 to 2033. This expansion is fueled by several key factors. Firstly, the region's burgeoning economies, particularly in China, India, and South Korea, are driving increased energy demand, with natural gas emerging as a cleaner alternative to coal for power generation and industrial processes. Secondly, government initiatives promoting energy diversification and cleaner energy sources are incentivizing natural gas consumption. Thirdly, advancements in unconventional natural gas extraction technologies, such as shale gas, are increasing supply and lowering costs. The market is segmented by type (conventional, unconventional, LNG), application (power generation, industrial, residential, transportation), and end-user industry (utilities, industrial, residential, transportation). While the dominance of power generation and industrial applications is expected to continue, growth in the residential and transportation sectors will contribute significantly to overall market expansion. Competition among major players like Tokyo Gas Co Ltd, Mitsubishi Corporation, and GAIL Limited, coupled with strategic partnerships and investments in infrastructure, is shaping the market landscape. However, price volatility of natural gas and potential geopolitical risks could pose challenges to the market's sustained growth.
Asia-Pacific Natural Gas Market Market Size (In Billion)
The Asia-Pacific region's dominance in the global natural gas market is driven by its high population density, rapid industrialization, and growing energy needs. Despite challenges like infrastructure limitations in certain areas and potential environmental concerns, the region's long-term growth prospects remain positive. The shift towards cleaner energy sources, the increasing affordability of natural gas, and the expanding LNG import infrastructure are expected to collectively bolster market expansion. Furthermore, ongoing technological advancements and increased investment in exploration and production activities will further fuel market growth over the forecast period. The market's segmentation provides opportunities for tailored product offerings and service provision, leading to further specialization and competition amongst market players.
Asia-Pacific Natural Gas Market Company Market Share
Asia-Pacific Natural Gas Market: A Comprehensive Market Analysis (2019-2033)
This insightful report delivers a comprehensive analysis of the Asia-Pacific natural gas market, encompassing market size, trends, leading players, and future projections from 2019 to 2033. The study period covers historical data (2019-2024), a base year (2025), an estimated year (2025), and a forecast period (2025-2033). This report is essential for stakeholders seeking to understand the dynamics of this rapidly evolving energy sector. Expect detailed segmentations by type (conventional, unconventional, LNG), application (power generation, industrial, residential, transportation), and end-user industry (utilities, industrial, residential, transportation), providing a granular view of the market landscape.
Asia-Pacific Natural Gas Market Market Composition & Trends
This section analyzes the competitive landscape of the Asia-Pacific natural gas market, evaluating market concentration, innovation, regulatory frameworks, substitute products, end-user profiles, and mergers & acquisitions (M&A) activity. We delve into market share distribution amongst key players like Tokyo Gas Co Ltd, Mitsubishi Corporation, Oil and Natural Gas Corporation, Bharat Petroleum Corporation Limited, China National Petroleum Corporation, Korea Gas Corporation, China Petroleum & Chemical Corporation, Chevron Corporation, GAIL Limited, and ENN Energy Holdings Limited (list not exhaustive). The report also quantifies the influence of regulatory changes on market dynamics and explores the impact of substitute energy sources. We examine M&A activity, providing insights into deal values and their effects on market consolidation. The analysis considers innovation catalysts within the sector, assessing their influence on growth and market share.
- Market Concentration: XX% market share held by the top 5 players in 2024, expected to increase/decrease to XX% by 2033.
- Innovation Catalysts: Focus on LNG import infrastructure, pipeline expansion, and the development of unconventional gas resources.
- Regulatory Landscape: Analysis of government policies promoting natural gas adoption and carbon emission reduction targets.
- Substitute Products: Evaluation of the impact of renewable energy sources (solar, wind) and competition from other fuels.
- End-User Profiles: Detailed breakdown of consumption patterns across different sectors (power generation, industrial, residential).
- M&A Activity: Analysis of significant M&A deals and their impact on market structure, including deal values (in Million USD). Total M&A deal value in 2024: XX Million USD.
Asia-Pacific Natural Gas Market Industry Evolution
This section provides a comprehensive analysis of the Asia-Pacific natural gas market's evolution. It details the growth trajectory from 2019 to 2033, examining factors influencing the market's expansion. We examine the influence of technological advancements, including improvements in gas extraction, processing, and transportation, and their impact on market growth. The analysis also considers shifting consumer demands and their influence on the market. We include data points such as compound annual growth rates (CAGR) for different segments and adoption rates of new technologies. For example, the report will show the market growth rate from 2019 to 2024 and project a growth rate from 2025 to 2033 with estimations for 2033 market value. We will also cover the increasing demand for cleaner energy sources and the transition towards a more sustainable energy mix, analyzing the implications for the natural gas sector.
Leading Regions, Countries, or Segments in Asia-Pacific Natural Gas Market
This section identifies the leading regions, countries, and segments within the Asia-Pacific natural gas market. We examine dominance factors in detail, providing in-depth analysis based on market share, growth rates, and investment trends across various segments (by type, application, and end-user industry). Key drivers for each dominant region/segment are highlighted using bullet points.
By Type:
- LNG (Liquefied Natural Gas): Dominant due to XX. Key drivers: increased LNG imports, expanding infrastructure, and government support for LNG projects.
- Conventional Natural Gas: Significant presence but facing challenges due to XX. Key drivers: existing infrastructure and established production bases.
- Unconventional Natural Gas: Growing but constrained by XX. Key drivers: technological advancements in shale gas exploration and production.
By Application:
- Power Generation: Largest segment due to XX. Key drivers: rising electricity demand, cost competitiveness, and relatively low emissions compared to coal.
- Industrial Use: Significant share due to XX. Key drivers: reliance on natural gas in various industrial processes.
- Residential Use: Growing segment but constrained by XX. Key drivers: increasing urbanization and rising living standards.
- Transportation: Emerging segment with significant growth potential due to XX. Key drivers: government initiatives to promote CNG vehicles and growing environmental concerns.
By End-User Industry:
- Utilities: Dominant due to XX. Key drivers: natural gas distribution and supply networks.
- Industrial: Significant share due to XX. Key drivers: industrial processes and manufacturing.
- Residential: Growing but constrained by XX. Key drivers: piped natural gas connections and growing urbanization.
- Transportation: High growth potential due to XX. Key drivers: expansion of CNG infrastructure and government policies promoting cleaner transportation fuels.
Asia-Pacific Natural Gas Market Product Innovations
Recent innovations in the Asia-Pacific natural gas market include advancements in gas extraction technologies (e.g., hydraulic fracturing for unconventional gas), the development of efficient gas-to-power plants, and the introduction of hydrogen-blended natural gas for cleaner transportation and residential applications. These innovations provide better efficiency, cost-effectiveness, and reduced environmental impacts, driving market expansion. The unique selling propositions include cleaner burning capabilities, enhanced energy efficiency, and improved infrastructure for transportation and distribution.
Propelling Factors for Asia-Pacific Natural Gas Market Growth
The Asia-Pacific natural gas market's growth is fueled by several factors. Firstly, increasing energy demand in rapidly developing economies drives the need for reliable and relatively clean energy sources. Secondly, government policies promoting natural gas adoption as a transition fuel, coupled with significant investments in LNG infrastructure, are key drivers. Thirdly, technological advancements such as improved extraction methods and efficient power generation technology further enhance market growth. Finally, the relative cost-competitiveness of natural gas compared to other fossil fuels also contributes to its increased adoption.
Obstacles in the Asia-Pacific Natural Gas Market Market
The Asia-Pacific natural gas market faces several challenges. Firstly, regulatory uncertainty and fluctuating energy prices introduce volatility. Secondly, supply chain disruptions, particularly in global LNG markets, can affect availability and cost. Thirdly, the rising adoption of renewable energy sources presents competitive pressure, demanding a strategic response from natural gas players. Fourthly, environmental concerns associated with methane emissions and exploration methods also present a significant obstacle. The quantified impact of these factors on the market growth is projected to be XX% reduction in the next 5 years.
Future Opportunities in Asia-Pacific Natural Gas Market
Future opportunities lie in expanding natural gas infrastructure, particularly in less developed regions. The increasing adoption of gas-based power generation and transportation fuels, coupled with the growing role of natural gas in industrial applications, presents substantial growth potential. Furthermore, innovations in gas extraction and processing techniques will continue to unlock new resources. The development of hydrogen-blended natural gas offers a pathway towards cleaner energy solutions, opening up new avenues for expansion.
Major Players in the Asia-Pacific Natural Gas Market Ecosystem
- Tokyo Gas Co Ltd
- Mitsubishi Corporation
- Oil and Natural Gas Corporation
- Bharat Petroleum Corporation Limited
- China National Petroleum Corporation
- Korea Gas Corporation
- China Petroleum & Chemical Corporation
- Chevron Corporation
- GAIL Limited
- ENN Energy Holdings Limited
- *List Not Exhaustive
Key Developments in Asia-Pacific Natural Gas Market Industry
- July 2022: The Indian government targets a 15% share of natural gas in its energy mix by 2030, up from 6.3%, driving increased domestic consumption. 95.21 lakh PNG (domestic) connections and 4531 CNG (transport) stations were established by May 31st, 2022.
- May 2022: CNOOC awards USD 2.42 Billion contracts for 12 LNG tankers, boosting LNG import capacity and potentially impacting market pricing.
- January 2022: GAIL (India) Ltd commences India's first hydrogen-blended natural gas project, signifying a step towards cleaner fuel solutions and potentially influencing future market trends towards low-carbon natural gas.
Strategic Asia-Pacific Natural Gas Market Market Forecast
The Asia-Pacific natural gas market exhibits substantial growth potential driven by robust energy demand, supportive government policies, and continuous technological advancements. The forecast period (2025-2033) indicates significant market expansion, particularly in regions with rapidly developing economies and expanding energy infrastructure. The increasing adoption of LNG, coupled with the growth of unconventional gas resources, will further propel market growth. Emerging opportunities in hydrogen-blended natural gas and sustainable energy solutions will continue to shape the market landscape, presenting new avenues for growth and investment. The predicted market size for 2033 is expected to be XX Million USD.
Asia-Pacific Natural Gas Market Segmentation
- 1. China
- 2. India
- 3. Japan
- 4. South Korea
- 5. Rest of Asia-Pacific
Asia-Pacific Natural Gas Market Segmentation By Geography
-
1. Asia Pacific
- 1.1. China
- 1.2. Japan
- 1.3. South Korea
- 1.4. India
- 1.5. Australia
- 1.6. New Zealand
- 1.7. Indonesia
- 1.8. Malaysia
- 1.9. Singapore
- 1.10. Thailand
- 1.11. Vietnam
- 1.12. Philippines
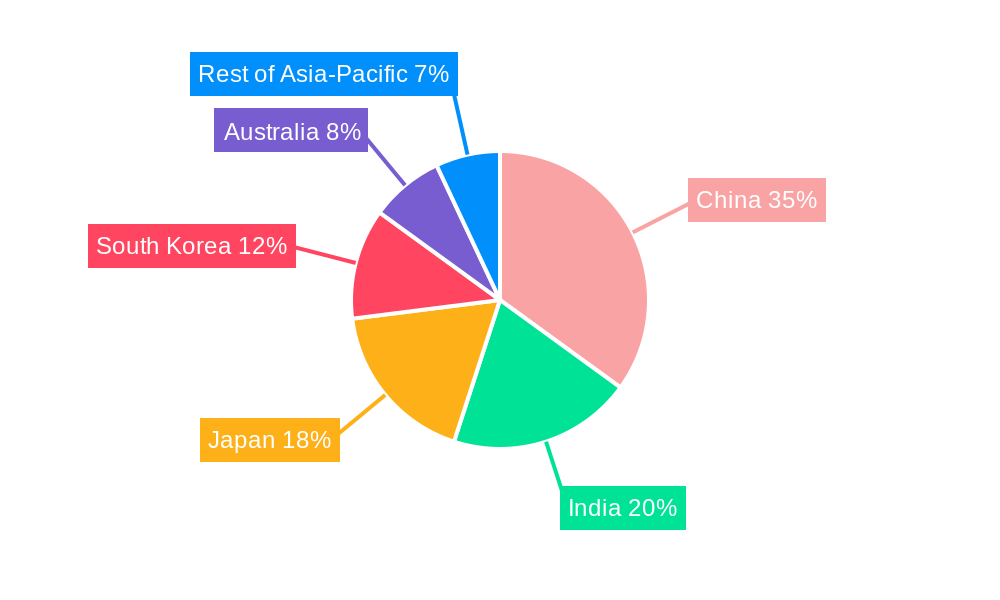
Asia-Pacific Natural Gas Market Regional Market Share
Geographic Coverage of Asia-Pacific Natural Gas Market
Asia-Pacific Natural Gas Market REPORT HIGHLIGHTS
| Aspects | Details |
|---|---|
| Study Period | 2020-2034 |
| Base Year | 2025 |
| Estimated Year | 2026 |
| Forecast Period | 2026-2034 |
| Historical Period | 2020-2025 |
| Growth Rate | CAGR of > 4.00% from 2020-2034 |
| Segmentation |
|
Table of Contents
- 1. Introduction
- 1.1. Research Scope
- 1.2. Market Segmentation
- 1.3. Research Objective
- 1.4. Definitions and Assumptions
- 2. Executive Summary
- 2.1. Market Snapshot
- 3. Market Dynamics
- 3.1. Market Drivers
- 3.2. Market Restrains
- 3.3. Market Trends
- 3.4. Market Opportunities
- 4. Market Factor Analysis
- 4.1. Porters Five Forces
- 4.1.1. Bargaining Power of Suppliers
- 4.1.2. Bargaining Power of Buyers
- 4.1.3. Threat of New Entrants
- 4.1.4. Threat of Substitutes
- 4.1.5. Competitive Rivalry
- 4.2. PESTEL analysis
- 4.3. BCG Analysis
- 4.3.1. Stars (High Growth, High Market Share)
- 4.3.2. Cash Cows (Low Growth, High Market Share)
- 4.3.3. Question Mark (High Growth, Low Market Share)
- 4.3.4. Dogs (Low Growth, Low Market Share)
- 4.4. Ansoff Matrix Analysis
- 4.5. Supply Chain Analysis
- 4.6. Regulatory Landscape
- 4.7. Current Market Potential and Opportunity Assessment (TAM–SAM–SOM Framework)
- 4.8. DMV Analyst Note
- 4.1. Porters Five Forces
- 5. Market Analysis, Insights and Forecast 2021-2033
- 5.1. Market Analysis, Insights and Forecast - by China
- 5.2. Market Analysis, Insights and Forecast - by India
- 5.3. Market Analysis, Insights and Forecast - by Japan
- 5.4. Market Analysis, Insights and Forecast - by South Korea
- 5.5. Market Analysis, Insights and Forecast - by Rest of Asia-Pacific
- 5.6. Market Analysis, Insights and Forecast - by Region
- 5.6.1. Asia Pacific
- 6. Asia-Pacific Natural Gas Market Analysis, Insights and Forecast, 2021-2033
- 6.1. Market Analysis, Insights and Forecast - by China
- 6.2. Market Analysis, Insights and Forecast - by India
- 6.3. Market Analysis, Insights and Forecast - by Japan
- 6.4. Market Analysis, Insights and Forecast - by South Korea
- 6.5. Market Analysis, Insights and Forecast - by Rest of Asia-Pacific
- 7. Competitive Analysis
- 7.1. Company Profiles
- 7.1.1 Tokyo Gas Co Ltd
- 7.1.1.1. Company Overview
- 7.1.1.2. Products
- 7.1.1.3. Company Financials
- 7.1.1.4. SWOT Analysis
- 7.1.2 Mitsubishi Corporation
- 7.1.2.1. Company Overview
- 7.1.2.2. Products
- 7.1.2.3. Company Financials
- 7.1.2.4. SWOT Analysis
- 7.1.3 Oil and Natural Gas Corporation
- 7.1.3.1. Company Overview
- 7.1.3.2. Products
- 7.1.3.3. Company Financials
- 7.1.3.4. SWOT Analysis
- 7.1.4 Bharat Petroleum Corporation Limited
- 7.1.4.1. Company Overview
- 7.1.4.2. Products
- 7.1.4.3. Company Financials
- 7.1.4.4. SWOT Analysis
- 7.1.5 China National Petroleum Corporation
- 7.1.5.1. Company Overview
- 7.1.5.2. Products
- 7.1.5.3. Company Financials
- 7.1.5.4. SWOT Analysis
- 7.1.6 Korea Gas Corporation
- 7.1.6.1. Company Overview
- 7.1.6.2. Products
- 7.1.6.3. Company Financials
- 7.1.6.4. SWOT Analysis
- 7.1.7 China Petroleum & Chemical Corporation
- 7.1.7.1. Company Overview
- 7.1.7.2. Products
- 7.1.7.3. Company Financials
- 7.1.7.4. SWOT Analysis
- 7.1.8 Chevron Corporation
- 7.1.8.1. Company Overview
- 7.1.8.2. Products
- 7.1.8.3. Company Financials
- 7.1.8.4. SWOT Analysis
- 7.1.9 GAIL Limited
- 7.1.9.1. Company Overview
- 7.1.9.2. Products
- 7.1.9.3. Company Financials
- 7.1.9.4. SWOT Analysis
- 7.1.10 ENN Energy Holdings Limited*List Not Exhaustive
- 7.1.10.1. Company Overview
- 7.1.10.2. Products
- 7.1.10.3. Company Financials
- 7.1.10.4. SWOT Analysis
- 7.1.1 Tokyo Gas Co Ltd
- 7.2. Market Entropy
- 7.2.1 Company's Key Areas Served
- 7.2.2 Recent Developments
- 7.3. Company Market Share Analysis 2025
- 7.3.1 Top 5 Companies Market Share Analysis
- 7.3.2 Top 3 Companies Market Share Analysis
- 7.4. List of Potential Customers
- 8. Research Methodology
List of Figures
- Figure 1: Asia-Pacific Natural Gas Market Revenue Breakdown (Million, %) by Product 2025 & 2033
- Figure 2: Asia-Pacific Natural Gas Market Share (%) by Company 2025
List of Tables
- Table 1: Asia-Pacific Natural Gas Market Revenue Million Forecast, by China 2020 & 2033
- Table 2: Asia-Pacific Natural Gas Market Volume K Tons Forecast, by China 2020 & 2033
- Table 3: Asia-Pacific Natural Gas Market Revenue Million Forecast, by India 2020 & 2033
- Table 4: Asia-Pacific Natural Gas Market Volume K Tons Forecast, by India 2020 & 2033
- Table 5: Asia-Pacific Natural Gas Market Revenue Million Forecast, by Japan 2020 & 2033
- Table 6: Asia-Pacific Natural Gas Market Volume K Tons Forecast, by Japan 2020 & 2033
- Table 7: Asia-Pacific Natural Gas Market Revenue Million Forecast, by South Korea 2020 & 2033
- Table 8: Asia-Pacific Natural Gas Market Volume K Tons Forecast, by South Korea 2020 & 2033
- Table 9: Asia-Pacific Natural Gas Market Revenue Million Forecast, by Rest of Asia-Pacific 2020 & 2033
- Table 10: Asia-Pacific Natural Gas Market Volume K Tons Forecast, by Rest of Asia-Pacific 2020 & 2033
- Table 11: Asia-Pacific Natural Gas Market Revenue Million Forecast, by Region 2020 & 2033
- Table 12: Asia-Pacific Natural Gas Market Volume K Tons Forecast, by Region 2020 & 2033
- Table 13: Asia-Pacific Natural Gas Market Revenue Million Forecast, by China 2020 & 2033
- Table 14: Asia-Pacific Natural Gas Market Volume K Tons Forecast, by China 2020 & 2033
- Table 15: Asia-Pacific Natural Gas Market Revenue Million Forecast, by India 2020 & 2033
- Table 16: Asia-Pacific Natural Gas Market Volume K Tons Forecast, by India 2020 & 2033
- Table 17: Asia-Pacific Natural Gas Market Revenue Million Forecast, by Japan 2020 & 2033
- Table 18: Asia-Pacific Natural Gas Market Volume K Tons Forecast, by Japan 2020 & 2033
- Table 19: Asia-Pacific Natural Gas Market Revenue Million Forecast, by South Korea 2020 & 2033
- Table 20: Asia-Pacific Natural Gas Market Volume K Tons Forecast, by South Korea 2020 & 2033
- Table 21: Asia-Pacific Natural Gas Market Revenue Million Forecast, by Rest of Asia-Pacific 2020 & 2033
- Table 22: Asia-Pacific Natural Gas Market Volume K Tons Forecast, by Rest of Asia-Pacific 2020 & 2033
- Table 23: Asia-Pacific Natural Gas Market Revenue Million Forecast, by Country 2020 & 2033
- Table 24: Asia-Pacific Natural Gas Market Volume K Tons Forecast, by Country 2020 & 2033
- Table 25: China Asia-Pacific Natural Gas Market Revenue (Million) Forecast, by Application 2020 & 2033
- Table 26: China Asia-Pacific Natural Gas Market Volume (K Tons) Forecast, by Application 2020 & 2033
- Table 27: Japan Asia-Pacific Natural Gas Market Revenue (Million) Forecast, by Application 2020 & 2033
- Table 28: Japan Asia-Pacific Natural Gas Market Volume (K Tons) Forecast, by Application 2020 & 2033
- Table 29: South Korea Asia-Pacific Natural Gas Market Revenue (Million) Forecast, by Application 2020 & 2033
- Table 30: South Korea Asia-Pacific Natural Gas Market Volume (K Tons) Forecast, by Application 2020 & 2033
- Table 31: India Asia-Pacific Natural Gas Market Revenue (Million) Forecast, by Application 2020 & 2033
- Table 32: India Asia-Pacific Natural Gas Market Volume (K Tons) Forecast, by Application 2020 & 2033
- Table 33: Australia Asia-Pacific Natural Gas Market Revenue (Million) Forecast, by Application 2020 & 2033
- Table 34: Australia Asia-Pacific Natural Gas Market Volume (K Tons) Forecast, by Application 2020 & 2033
- Table 35: New Zealand Asia-Pacific Natural Gas Market Revenue (Million) Forecast, by Application 2020 & 2033
- Table 36: New Zealand Asia-Pacific Natural Gas Market Volume (K Tons) Forecast, by Application 2020 & 2033
- Table 37: Indonesia Asia-Pacific Natural Gas Market Revenue (Million) Forecast, by Application 2020 & 2033
- Table 38: Indonesia Asia-Pacific Natural Gas Market Volume (K Tons) Forecast, by Application 2020 & 2033
- Table 39: Malaysia Asia-Pacific Natural Gas Market Revenue (Million) Forecast, by Application 2020 & 2033
- Table 40: Malaysia Asia-Pacific Natural Gas Market Volume (K Tons) Forecast, by Application 2020 & 2033
- Table 41: Singapore Asia-Pacific Natural Gas Market Revenue (Million) Forecast, by Application 2020 & 2033
- Table 42: Singapore Asia-Pacific Natural Gas Market Volume (K Tons) Forecast, by Application 2020 & 2033
- Table 43: Thailand Asia-Pacific Natural Gas Market Revenue (Million) Forecast, by Application 2020 & 2033
- Table 44: Thailand Asia-Pacific Natural Gas Market Volume (K Tons) Forecast, by Application 2020 & 2033
- Table 45: Vietnam Asia-Pacific Natural Gas Market Revenue (Million) Forecast, by Application 2020 & 2033
- Table 46: Vietnam Asia-Pacific Natural Gas Market Volume (K Tons) Forecast, by Application 2020 & 2033
- Table 47: Philippines Asia-Pacific Natural Gas Market Revenue (Million) Forecast, by Application 2020 & 2033
- Table 48: Philippines Asia-Pacific Natural Gas Market Volume (K Tons) Forecast, by Application 2020 & 2033
Frequently Asked Questions
1. What is the projected Compound Annual Growth Rate (CAGR) of the Asia-Pacific Natural Gas Market?
The projected CAGR is approximately > 4.00%.
2. Which companies are prominent players in the Asia-Pacific Natural Gas Market?
Key companies in the market include Tokyo Gas Co Ltd, Mitsubishi Corporation, Oil and Natural Gas Corporation, Bharat Petroleum Corporation Limited, China National Petroleum Corporation, Korea Gas Corporation, China Petroleum & Chemical Corporation, Chevron Corporation, GAIL Limited, ENN Energy Holdings Limited*List Not Exhaustive.
3. What are the main segments of the Asia-Pacific Natural Gas Market?
The market segments include China, India, Japan, South Korea, Rest of Asia-Pacific.
4. Can you provide details about the market size?
The market size is estimated to be USD 14940 Million as of 2022.
5. What are some drivers contributing to market growth?
4.; Increasing Electricity Demand4.; Rsing Investments in the Coal Industry.
6. What are the notable trends driving market growth?
Increasing Investments in Natural Gas Production to Drive the Market.
7. Are there any restraints impacting market growth?
4.; Increasing Installation of Renewable Energy Sources.
8. Can you provide examples of recent developments in the market?
July 2022: The Indian government announced that it had set a target to raise the share of natural gas in the energy mix to 15% by 2030 from the current 6.3%. According to the data demonstrated by the Ministry of Petroleum & Natural Gas, 95.21 lakh PNG (Domestic) connections have been provided, and the authorized entities have established 4531 CNG (Transport) stations as of 31 May 2022.
9. What pricing options are available for accessing the report?
Pricing options include single-user, multi-user, and enterprise licenses priced at USD 4750, USD 5250, and USD 8750 respectively.
10. Is the market size provided in terms of value or volume?
The market size is provided in terms of value, measured in Million and volume, measured in K Tons.
11. Are there any specific market keywords associated with the report?
Yes, the market keyword associated with the report is "Asia-Pacific Natural Gas Market," which aids in identifying and referencing the specific market segment covered.
12. How do I determine which pricing option suits my needs best?
The pricing options vary based on user requirements and access needs. Individual users may opt for single-user licenses, while businesses requiring broader access may choose multi-user or enterprise licenses for cost-effective access to the report.
13. Are there any additional resources or data provided in the Asia-Pacific Natural Gas Market report?
While the report offers comprehensive insights, it's advisable to review the specific contents or supplementary materials provided to ascertain if additional resources or data are available.
14. How can I stay updated on further developments or reports in the Asia-Pacific Natural Gas Market?
To stay informed about further developments, trends, and reports in the Asia-Pacific Natural Gas Market, consider subscribing to industry newsletters, following relevant companies and organizations, or regularly checking reputable industry news sources and publications.
Methodology
Step 1 - Identification of Relevant Samples Size from Population Database


Step 2 - Approaches for Defining Global Market Size (Value, Volume* & Price*)

Note*: In applicable scenarios
Step 3 - Data Sources
Primary Research
- Web Analytics
- Survey Reports
- Research Institute
- Latest Research Reports
- Opinion Leaders
Secondary Research
- Annual Reports
- White Paper
- Latest Press Release
- Industry Association
- Paid Database
- Investor Presentations

Step 4 - Data Triangulation
Involves using different sources of information in order to increase the validity of a study
These sources are likely to be stakeholders in a program - participants, other researchers, program staff, other community members, and so on.
Then we put all data in single framework & apply various statistical tools to find out the dynamic on the market.
During the analysis stage, feedback from the stakeholder groups would be compared to determine areas of agreement as well as areas of divergence