

Key Insights
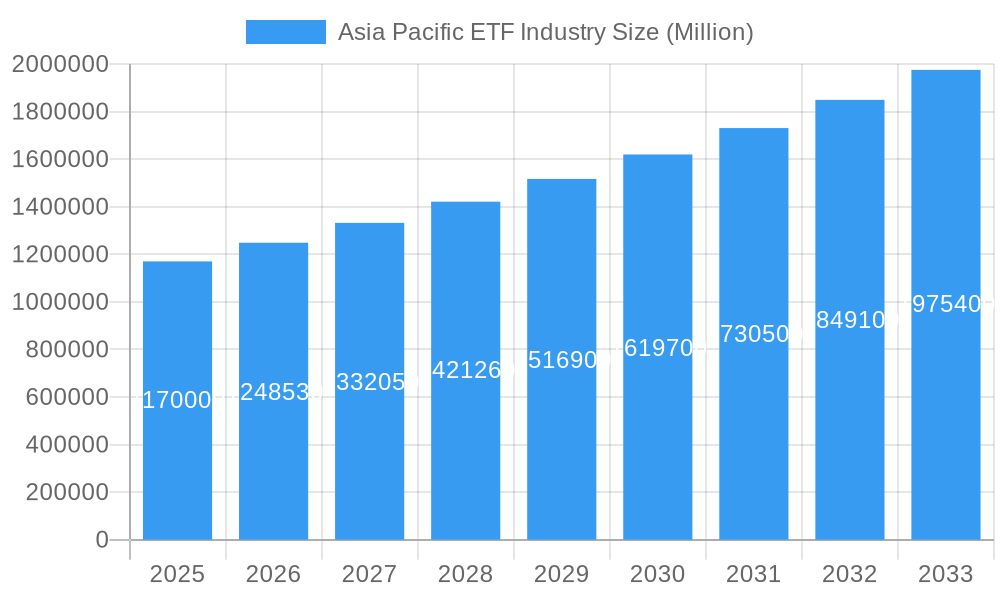
The Asia Pacific exchange-traded fund (ETF) industry is experiencing robust growth, projected to reach a market size of $1.17 trillion in 2025, with a compound annual growth rate (CAGR) of 6.59% from 2019 to 2033. This expansion is fueled by several key drivers. Increasing investor sophistication and a growing preference for passive investment strategies are driving demand for ETFs as a cost-effective and diversified investment vehicle. Furthermore, the rising middle class in several Asian economies, coupled with increased financial literacy, is expanding the investor base significantly. Regulatory reforms promoting ETF development and the increasing availability of diverse ETF products catering to specific market segments also contribute to this growth trajectory. Competition among major players like BlackRock's iShares, Nikko Asset Management, and others fuels innovation and product development, further boosting market expansion. However, factors such as market volatility and geopolitical uncertainties could act as potential restraints, although the overall outlook remains positive.
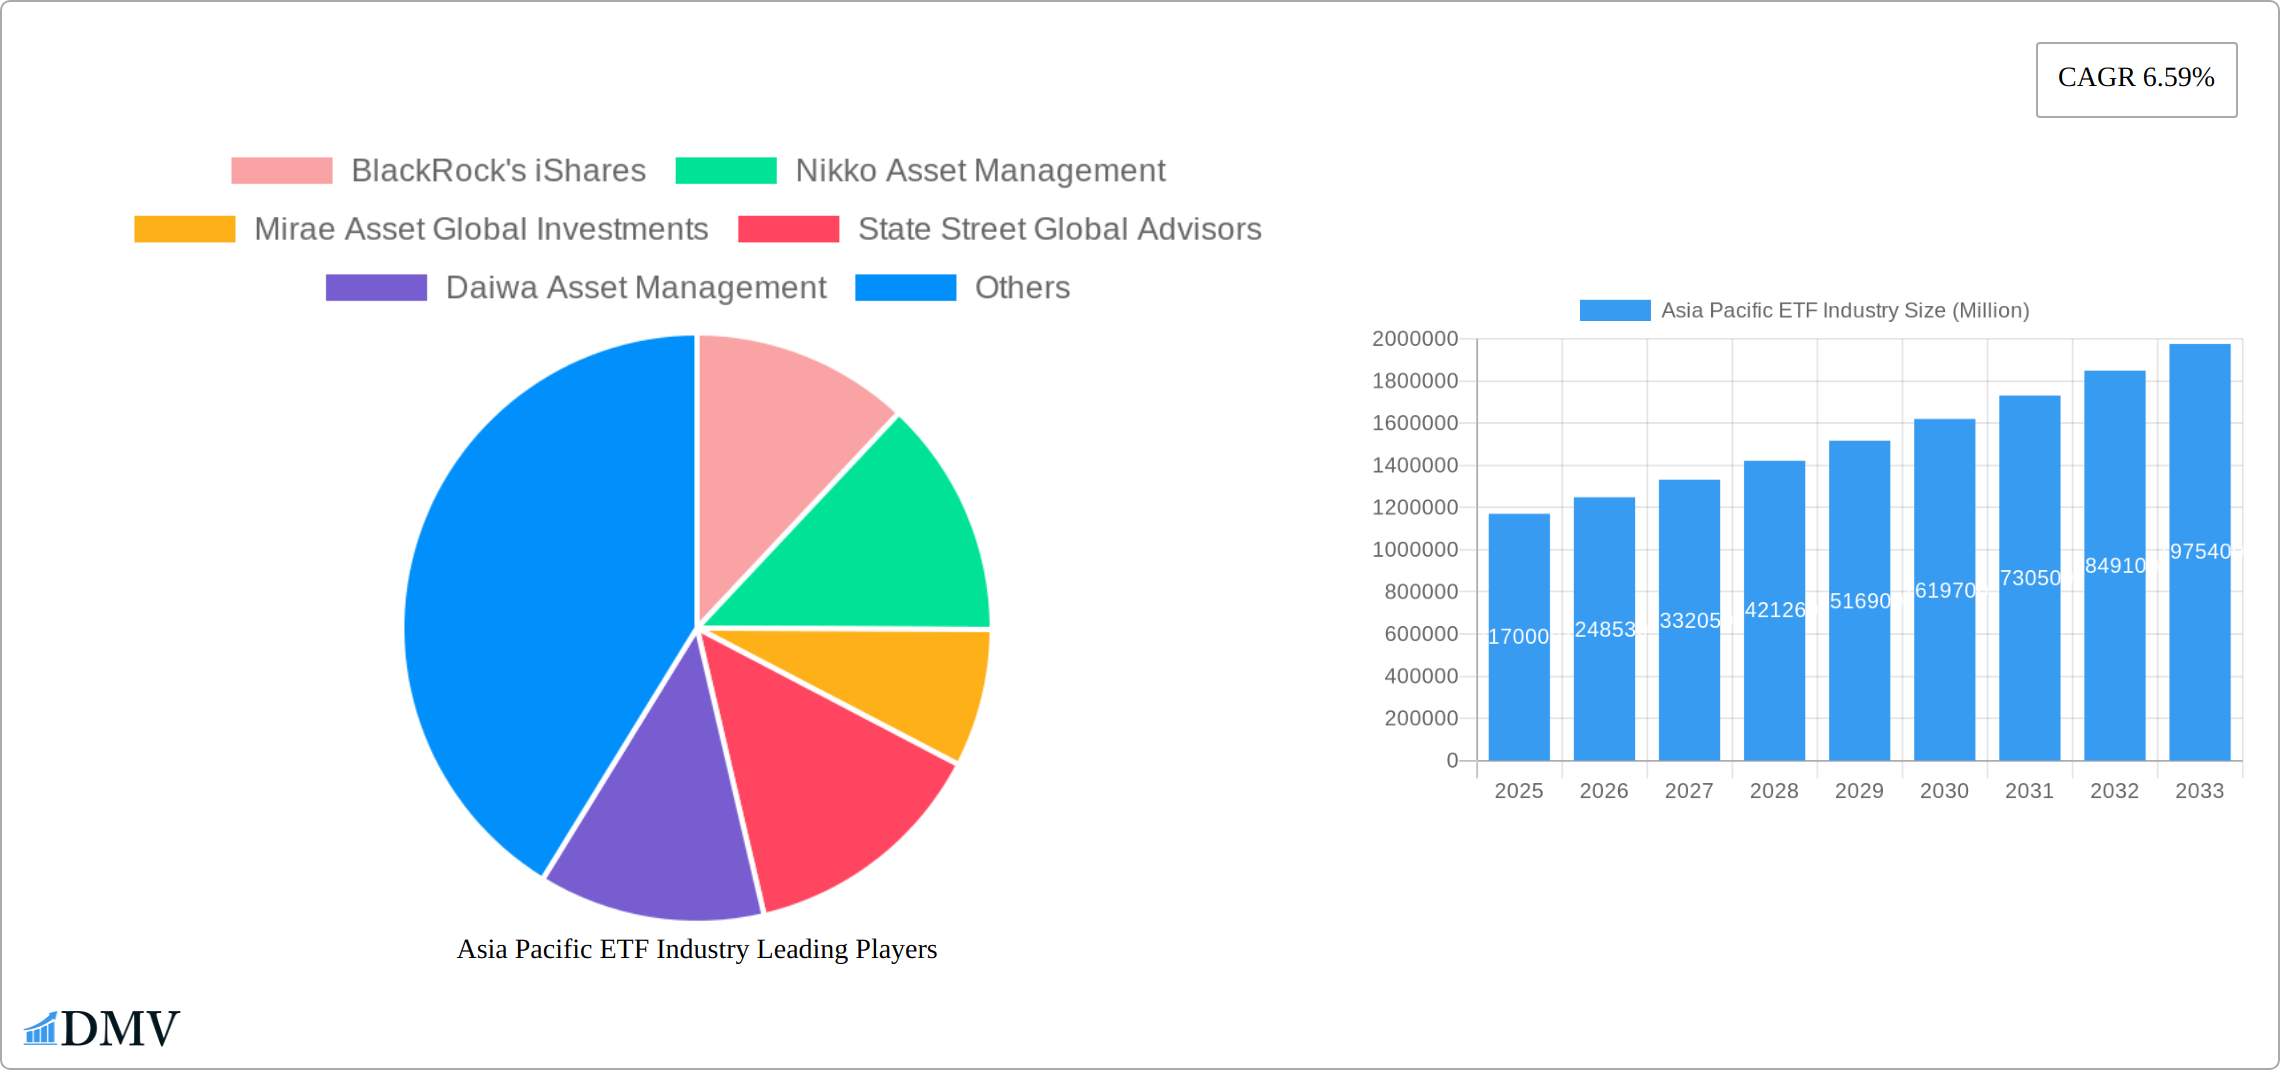
Asia Pacific ETF Industry Market Size (In Million)
Looking ahead, the Asia Pacific ETF market is expected to witness considerable diversification, with growth driven by thematic ETFs focused on sectors like technology, sustainable investing, and emerging markets. The increasing integration of financial technology (FinTech) is streamlining investment processes, making ETFs more accessible to a wider range of investors. Regional variations in growth will be influenced by factors such as economic development, regulatory frameworks, and investor sentiment within individual countries. China, India, and Japan are likely to be key contributors to overall market growth given their substantial economies and expanding investor bases. Continued focus on innovation, investor education, and regulatory support will be crucial in shaping the future trajectory of the Asia Pacific ETF industry.
Asia Pacific ETF Industry Company Market Share
Asia Pacific ETF Industry: A Comprehensive Market Report (2019-2033)
This insightful report provides a comprehensive analysis of the Asia Pacific Exchange-Traded Funds (ETF) industry, covering the period from 2019 to 2033, with a focus on 2025. It delves into market composition, evolution, key players, and future growth projections, offering invaluable insights for stakeholders, investors, and industry professionals. The report meticulously examines the dynamic landscape, including significant developments and challenges, providing a robust framework for strategic decision-making. The total market value in 2025 is estimated at USD xx Million.
Asia Pacific ETF Industry Market Composition & Trends
This section analyzes the competitive landscape of the Asia Pacific ETF market, focusing on market concentration, innovation, regulations, and M&A activity. The report examines the market share distribution among key players, including BlackRock's iShares, Nikko Asset Management, Mirae Asset Global Investments, State Street Global Advisors, Daiwa Asset Management, Mitsubishi UFJ Financial Group, Samsung Asset Management, Fortune SG Fund Management, China Asset Management, and Nomura Asset Management Co Ltd (list not exhaustive).
- Market Concentration: The market exhibits a [High/Medium/Low - choose one based on data] level of concentration, with the top five players holding an estimated xx% market share in 2025.
- Innovation Catalysts: Technological advancements, such as the rise of thematic ETFs and the integration of fintech, are driving innovation.
- Regulatory Landscape: Varying regulatory frameworks across different countries within the Asia Pacific region influence market growth and player strategies.
- Substitute Products: Mutual funds and other investment vehicles compete with ETFs for investor attention.
- End-User Profiles: The report segments end-users by investor type (institutional, retail, etc.), analyzing their investment preferences and behaviors.
- M&A Activities: The report tracks significant M&A deals in the industry during the historical period (2019-2024), providing insights into deal values and strategic implications. For example, in 2024, the combined value of M&A deals was estimated to be USD xx Million.
Asia Pacific ETF Industry Industry Evolution
The Asia Pacific ETF industry has experienced a dynamic transformation, charting a robust growth path from 2019 and projecting continued expansion through 2033. This evolution is intrinsically linked to rapid technological advancements that have democratized access and enhanced trading efficiency. Simultaneously, a notable shift in consumer demands, with a growing appetite for diversified and accessible investment solutions, has been a significant catalyst. Emerging trends such as the increasing preference for passive investing and the rise of ESG-focused strategies are fundamentally reshaping the market landscape. For the forecast period of 2025-2033, the compound annual growth rate (CAGR) is anticipated to reach approximately [Insert Specific CAGR Here]%. This impressive growth is underpinned by a confluence of factors including heightened investor awareness across the region, increasingly supportive regulatory frameworks that foster innovation and investor protection, and a notable diversification of ETF product offerings catering to a wider spectrum of investment objectives. The report further delves into the adoption rates of ETFs across various investor segments, confirming their escalating popularity as a preferred investment vehicle. Technological breakthroughs, particularly in areas like advanced algorithmic trading, sophisticated data analytics for risk assessment and portfolio management, and the development of user-friendly trading platforms, have demonstrably improved ETF trading efficiency and expanded accessibility for both retail and institutional investors.
Leading Regions, Countries, or Segments in Asia Pacific ETF Industry
This section identifies the dominant regions, countries, or segments within the Asia Pacific ETF market.
- Key Drivers of Dominance:
- Strong investor interest in specific asset classes (e.g., technology, real estate).
- Favorable regulatory environments promoting ETF growth.
- Well-developed financial infrastructure.
- High levels of financial literacy and sophistication amongst investors.
The dominance of [Region/Country/Segment] is further analyzed, detailing factors such as robust regulatory frameworks, high investor participation, a well-established market infrastructure, and the availability of a diverse range of ETF products catering to specific investor needs and risk appetites.
Asia Pacific ETF Industry Product Innovations
The Asia Pacific ETF market is a vibrant hub of continuous product innovation, consistently introducing novel investment vehicles to meet evolving investor needs. A steady stream of new ETFs is being launched, strategically targeting niche segments and burgeoning thematic investment areas. These include, but are not limited to, ETFs focused on sustainable energy solutions, the cutting-edge advancements in artificial intelligence, the rapidly expanding digital asset space, and increasingly, sectors aligned with strong ESG principles. These pioneering products often integrate sophisticated investment strategies and leverage cutting-edge technologies to deliver enhanced risk management capabilities and improved performance metrics. The key differentiating factors and unique selling propositions of these innovative ETFs frequently encompass highly competitive, lower expense ratios, superior index tracking accuracy, and distinct investment methodologies meticulously designed to align with specific investor goals and risk appetites. The proliferation of these specialized ETFs allows investors to gain precise and efficient exposure to coveted asset classes and forward-looking themes.
Propelling Factors for Asia Pacific ETF Industry Growth
A multifaceted array of factors is collectively propelling the significant growth trajectory of the Asia Pacific ETF industry. Paramount among these are rapid technological advancements, which have revolutionized trading platforms, introduced powerful data analytics tools, and significantly improved overall market accessibility and operational efficiency. Concurrently, robust economic growth observed across numerous Asian economies is creating a more fertile ground for investment activity, leading to increased capital deployment. Furthermore, the establishment and refinement of supportive regulatory frameworks, characterized by policies actively promoting ETF development, enhancing investor protection, and streamlining listing processes, are playing a crucial role in stimulating industry expansion and fostering investor confidence. The growing sophistication of financial markets and the increasing availability of diverse investment options further contribute to this dynamic growth.
Obstacles in the Asia Pacific ETF Industry Market
Despite significant growth, the Asia Pacific ETF market faces challenges. Regulatory complexities across different jurisdictions create hurdles for issuers and investors. Supply chain disruptions, particularly impactful during periods of global uncertainty, can affect market liquidity and stability. Intense competition among existing players limits pricing power and profit margins. These factors impact overall growth, although the effect is expected to be [minimal/moderate/significant - choose one based on your data] over the forecast period.
Future Opportunities in Asia Pacific ETF Industry
The Asia Pacific ETF industry is brimming with substantial future potential, offering a landscape ripe for further expansion and innovation. Significant growth opportunities lie within untapped markets in emerging Asian economies, where increasing disposable incomes and a burgeoning middle class are creating a demand for accessible investment products. Technological advancements continue to pave new avenues for innovation and market penetration. The integration of disruptive technologies such as blockchain for enhanced transparency and security in trading, and the continued rise and sophistication of robo-advisors, offer powerful tools for product development and personalized investment solutions. Furthermore, a palpable shift in investor preferences, most notably the escalating demand for ESG (Environmental, Social, and Governance) compliant investments, is creating substantial new product segments and investment mandates. This growing awareness and desire for sustainable and responsible investing present a significant opportunity for ETF providers to develop specialized and impactful products.
Major Players in the Asia Pacific ETF Industry Ecosystem
- BlackRock's iShares
- Nikko Asset Management
- Mirae Asset Global Investments
- State Street Global Advisors
- Daiwa Asset Management
- Mitsubishi UFJ Financial Group
- Samsung Asset Management
- Fortune SG Fund Management
- China Asset Management
- Nomura Asset Management Co Ltd
Key Developments in Asia Pacific ETF Industry Industry
- December 2022: Nikko Asset Management Co. Ltd launched a new ETF-listed index fund, US Equity (Dow Average), on the Tokyo Stock Exchange, with no currency hedge.
- May 2023: Nomura Investor Relations Co. Ltd and Nomura Securities Co. Ltd partnered with QUICK Corp. to operate a sponsored research company.
Strategic Asia Pacific ETF Industry Market Forecast
The Asia Pacific ETF market is strategically positioned for sustained and accelerated growth, fueled by a widening investor base, continuous technological innovation, and an increasingly favorable regulatory environment. The projected forecast period, spanning from 2025 to 2033, anticipates substantial market expansion, marked by considerable potential for the development of new, sophisticated products and deeper market penetration across a diverse array of geographical regions and asset classes. The industry is expected to benefit significantly from the rising adoption of ETFs among both retail and institutional investors, with particular emphasis on the untapped potential within emerging economies. This projected growth is anticipated to be driven by a combination of factors including enhanced financial literacy across the population, the expansion of the investable universe through increased product variety, and ongoing advancements in trading technology and investor-centric platforms, making ETFs an increasingly attractive and accessible investment solution for a broader audience.
Asia Pacific ETF Industry Segmentation
-
1. Types of ETFs
- 1.1. Fixed Income ETFs
- 1.2. Equity ETFs
- 1.3. Commodity ETFs
- 1.4. Currency ETFs
- 1.5. Real Estate ETFs
- 1.6. Specialty ETFs
Asia Pacific ETF Industry Segmentation By Geography
-
1. Asia Pacific
- 1.1. China
- 1.2. Japan
- 1.3. South Korea
- 1.4. India
- 1.5. Australia
- 1.6. New Zealand
- 1.7. Indonesia
- 1.8. Malaysia
- 1.9. Singapore
- 1.10. Thailand
- 1.11. Vietnam
- 1.12. Philippines
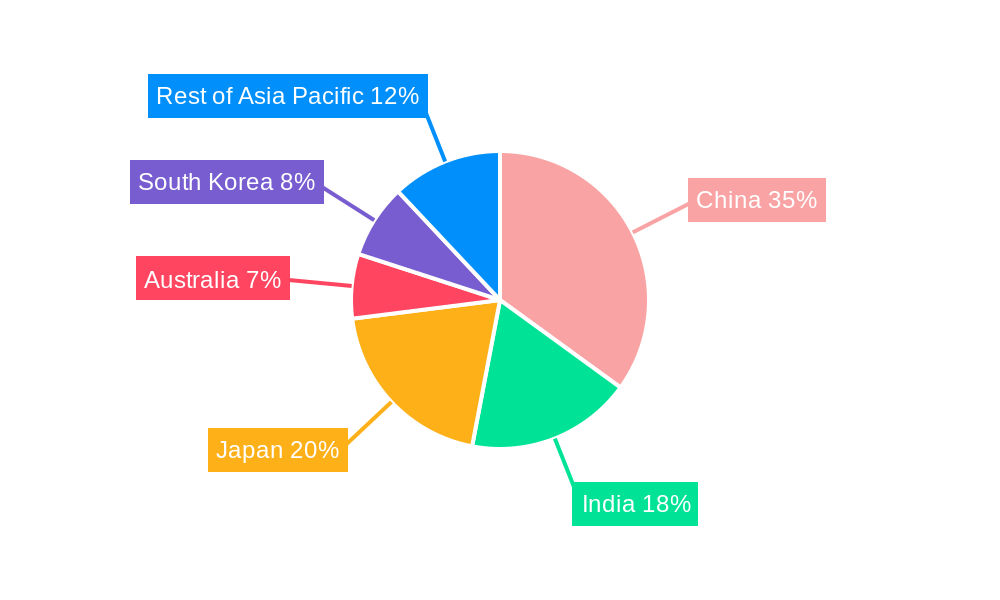
Asia Pacific ETF Industry Regional Market Share
Geographic Coverage of Asia Pacific ETF Industry
Asia Pacific ETF Industry REPORT HIGHLIGHTS
| Aspects | Details |
|---|---|
| Study Period | 2020-2034 |
| Base Year | 2025 |
| Estimated Year | 2026 |
| Forecast Period | 2026-2034 |
| Historical Period | 2020-2025 |
| Growth Rate | CAGR of 6.59% from 2020-2034 |
| Segmentation |
|
Table of Contents
- 1. Introduction
- 1.1. Research Scope
- 1.2. Market Segmentation
- 1.3. Research Objective
- 1.4. Definitions and Assumptions
- 2. Executive Summary
- 2.1. Market Snapshot
- 3. Market Dynamics
- 3.1. Market Drivers
- 3.2. Market Restrains
- 3.3. Market Trends
- 3.4. Market Opportunities
- 4. Market Factor Analysis
- 4.1. Porters Five Forces
- 4.1.1. Bargaining Power of Suppliers
- 4.1.2. Bargaining Power of Buyers
- 4.1.3. Threat of New Entrants
- 4.1.4. Threat of Substitutes
- 4.1.5. Competitive Rivalry
- 4.2. PESTEL analysis
- 4.3. BCG Analysis
- 4.3.1. Stars (High Growth, High Market Share)
- 4.3.2. Cash Cows (Low Growth, High Market Share)
- 4.3.3. Question Mark (High Growth, Low Market Share)
- 4.3.4. Dogs (Low Growth, Low Market Share)
- 4.4. Ansoff Matrix Analysis
- 4.5. Supply Chain Analysis
- 4.6. Regulatory Landscape
- 4.7. Current Market Potential and Opportunity Assessment (TAM–SAM–SOM Framework)
- 4.8. DMV Analyst Note
- 4.1. Porters Five Forces
- 5. Market Analysis, Insights and Forecast 2021-2033
- 5.1. Market Analysis, Insights and Forecast - by Types of ETFs
- 5.1.1. Fixed Income ETFs
- 5.1.2. Equity ETFs
- 5.1.3. Commodity ETFs
- 5.1.4. Currency ETFs
- 5.1.5. Real Estate ETFs
- 5.1.6. Specialty ETFs
- 5.2. Market Analysis, Insights and Forecast - by Region
- 5.2.1. Asia Pacific
- 5.1. Market Analysis, Insights and Forecast - by Types of ETFs
- 6. Asia Pacific ETF Industry Analysis, Insights and Forecast, 2021-2033
- 6.1. Market Analysis, Insights and Forecast - by Types of ETFs
- 6.1.1. Fixed Income ETFs
- 6.1.2. Equity ETFs
- 6.1.3. Commodity ETFs
- 6.1.4. Currency ETFs
- 6.1.5. Real Estate ETFs
- 6.1.6. Specialty ETFs
- 6.1. Market Analysis, Insights and Forecast - by Types of ETFs
- 7. Competitive Analysis
- 7.1. Company Profiles
- 7.1.1 BlackRock's iShares
- 7.1.1.1. Company Overview
- 7.1.1.2. Products
- 7.1.1.3. Company Financials
- 7.1.1.4. SWOT Analysis
- 7.1.2 Nikko Asset Management
- 7.1.2.1. Company Overview
- 7.1.2.2. Products
- 7.1.2.3. Company Financials
- 7.1.2.4. SWOT Analysis
- 7.1.3 Mirae Asset Global Investments
- 7.1.3.1. Company Overview
- 7.1.3.2. Products
- 7.1.3.3. Company Financials
- 7.1.3.4. SWOT Analysis
- 7.1.4 State Street Global Advisors
- 7.1.4.1. Company Overview
- 7.1.4.2. Products
- 7.1.4.3. Company Financials
- 7.1.4.4. SWOT Analysis
- 7.1.5 Daiwa Asset Management
- 7.1.5.1. Company Overview
- 7.1.5.2. Products
- 7.1.5.3. Company Financials
- 7.1.5.4. SWOT Analysis
- 7.1.6 Mitsubishi UFJ Financial Group
- 7.1.6.1. Company Overview
- 7.1.6.2. Products
- 7.1.6.3. Company Financials
- 7.1.6.4. SWOT Analysis
- 7.1.7 Samsung Asset Management
- 7.1.7.1. Company Overview
- 7.1.7.2. Products
- 7.1.7.3. Company Financials
- 7.1.7.4. SWOT Analysis
- 7.1.8 Fortune SG Fund Management
- 7.1.8.1. Company Overview
- 7.1.8.2. Products
- 7.1.8.3. Company Financials
- 7.1.8.4. SWOT Analysis
- 7.1.9 China Asset Management
- 7.1.9.1. Company Overview
- 7.1.9.2. Products
- 7.1.9.3. Company Financials
- 7.1.9.4. SWOT Analysis
- 7.1.10 Nomura Asset Management Co Ltd**List Not Exhaustive
- 7.1.10.1. Company Overview
- 7.1.10.2. Products
- 7.1.10.3. Company Financials
- 7.1.10.4. SWOT Analysis
- 7.1.1 BlackRock's iShares
- 7.2. Market Entropy
- 7.2.1 Company's Key Areas Served
- 7.2.2 Recent Developments
- 7.3. Company Market Share Analysis 2025
- 7.3.1 Top 5 Companies Market Share Analysis
- 7.3.2 Top 3 Companies Market Share Analysis
- 7.4. List of Potential Customers
- 8. Research Methodology
List of Figures
- Figure 1: Asia Pacific ETF Industry Revenue Breakdown (Million, %) by Product 2025 & 2033
- Figure 2: Asia Pacific ETF Industry Share (%) by Company 2025
List of Tables
- Table 1: Asia Pacific ETF Industry Revenue Million Forecast, by Types of ETFs 2020 & 2033
- Table 2: Asia Pacific ETF Industry Volume Trillion Forecast, by Types of ETFs 2020 & 2033
- Table 3: Asia Pacific ETF Industry Revenue Million Forecast, by Region 2020 & 2033
- Table 4: Asia Pacific ETF Industry Volume Trillion Forecast, by Region 2020 & 2033
- Table 5: Asia Pacific ETF Industry Revenue Million Forecast, by Types of ETFs 2020 & 2033
- Table 6: Asia Pacific ETF Industry Volume Trillion Forecast, by Types of ETFs 2020 & 2033
- Table 7: Asia Pacific ETF Industry Revenue Million Forecast, by Country 2020 & 2033
- Table 8: Asia Pacific ETF Industry Volume Trillion Forecast, by Country 2020 & 2033
- Table 9: China Asia Pacific ETF Industry Revenue (Million) Forecast, by Application 2020 & 2033
- Table 10: China Asia Pacific ETF Industry Volume (Trillion) Forecast, by Application 2020 & 2033
- Table 11: Japan Asia Pacific ETF Industry Revenue (Million) Forecast, by Application 2020 & 2033
- Table 12: Japan Asia Pacific ETF Industry Volume (Trillion) Forecast, by Application 2020 & 2033
- Table 13: South Korea Asia Pacific ETF Industry Revenue (Million) Forecast, by Application 2020 & 2033
- Table 14: South Korea Asia Pacific ETF Industry Volume (Trillion) Forecast, by Application 2020 & 2033
- Table 15: India Asia Pacific ETF Industry Revenue (Million) Forecast, by Application 2020 & 2033
- Table 16: India Asia Pacific ETF Industry Volume (Trillion) Forecast, by Application 2020 & 2033
- Table 17: Australia Asia Pacific ETF Industry Revenue (Million) Forecast, by Application 2020 & 2033
- Table 18: Australia Asia Pacific ETF Industry Volume (Trillion) Forecast, by Application 2020 & 2033
- Table 19: New Zealand Asia Pacific ETF Industry Revenue (Million) Forecast, by Application 2020 & 2033
- Table 20: New Zealand Asia Pacific ETF Industry Volume (Trillion) Forecast, by Application 2020 & 2033
- Table 21: Indonesia Asia Pacific ETF Industry Revenue (Million) Forecast, by Application 2020 & 2033
- Table 22: Indonesia Asia Pacific ETF Industry Volume (Trillion) Forecast, by Application 2020 & 2033
- Table 23: Malaysia Asia Pacific ETF Industry Revenue (Million) Forecast, by Application 2020 & 2033
- Table 24: Malaysia Asia Pacific ETF Industry Volume (Trillion) Forecast, by Application 2020 & 2033
- Table 25: Singapore Asia Pacific ETF Industry Revenue (Million) Forecast, by Application 2020 & 2033
- Table 26: Singapore Asia Pacific ETF Industry Volume (Trillion) Forecast, by Application 2020 & 2033
- Table 27: Thailand Asia Pacific ETF Industry Revenue (Million) Forecast, by Application 2020 & 2033
- Table 28: Thailand Asia Pacific ETF Industry Volume (Trillion) Forecast, by Application 2020 & 2033
- Table 29: Vietnam Asia Pacific ETF Industry Revenue (Million) Forecast, by Application 2020 & 2033
- Table 30: Vietnam Asia Pacific ETF Industry Volume (Trillion) Forecast, by Application 2020 & 2033
- Table 31: Philippines Asia Pacific ETF Industry Revenue (Million) Forecast, by Application 2020 & 2033
- Table 32: Philippines Asia Pacific ETF Industry Volume (Trillion) Forecast, by Application 2020 & 2033
Frequently Asked Questions
1. What is the projected Compound Annual Growth Rate (CAGR) of the Asia Pacific ETF Industry?
The projected CAGR is approximately 6.59%.
2. Which companies are prominent players in the Asia Pacific ETF Industry?
Key companies in the market include BlackRock's iShares, Nikko Asset Management, Mirae Asset Global Investments, State Street Global Advisors, Daiwa Asset Management, Mitsubishi UFJ Financial Group, Samsung Asset Management, Fortune SG Fund Management, China Asset Management, Nomura Asset Management Co Ltd**List Not Exhaustive.
3. What are the main segments of the Asia Pacific ETF Industry?
The market segments include Types of ETFs.
4. Can you provide details about the market size?
The market size is estimated to be USD 1.17 Million as of 2022.
5. What are some drivers contributing to market growth?
Accessible Investment Platforms; Growing Culture of Financial Investment.
6. What are the notable trends driving market growth?
Equity ETFs Dominate the ETF Market.
7. Are there any restraints impacting market growth?
Accessible Investment Platforms; Growing Culture of Financial Investment.
8. Can you provide examples of recent developments in the market?
May 2023: Nomura Investor Relations Co. Ltd ("Nomura IR") and Nomura Securities Co. Ltd ("Nomura Securities") partnered with QUICK Corp. to run a sponsored research company.
9. What pricing options are available for accessing the report?
Pricing options include single-user, multi-user, and enterprise licenses priced at USD 4750, USD 4950, and USD 6800 respectively.
10. Is the market size provided in terms of value or volume?
The market size is provided in terms of value, measured in Million and volume, measured in Trillion.
11. Are there any specific market keywords associated with the report?
Yes, the market keyword associated with the report is "Asia Pacific ETF Industry," which aids in identifying and referencing the specific market segment covered.
12. How do I determine which pricing option suits my needs best?
The pricing options vary based on user requirements and access needs. Individual users may opt for single-user licenses, while businesses requiring broader access may choose multi-user or enterprise licenses for cost-effective access to the report.
13. Are there any additional resources or data provided in the Asia Pacific ETF Industry report?
While the report offers comprehensive insights, it's advisable to review the specific contents or supplementary materials provided to ascertain if additional resources or data are available.
14. How can I stay updated on further developments or reports in the Asia Pacific ETF Industry?
To stay informed about further developments, trends, and reports in the Asia Pacific ETF Industry, consider subscribing to industry newsletters, following relevant companies and organizations, or regularly checking reputable industry news sources and publications.
Methodology
Step 1 - Identification of Relevant Samples Size from Population Database


Step 2 - Approaches for Defining Global Market Size (Value, Volume* & Price*)

Note*: In applicable scenarios
Step 3 - Data Sources
Primary Research
- Web Analytics
- Survey Reports
- Research Institute
- Latest Research Reports
- Opinion Leaders
Secondary Research
- Annual Reports
- White Paper
- Latest Press Release
- Industry Association
- Paid Database
- Investor Presentations

Step 4 - Data Triangulation
Involves using different sources of information in order to increase the validity of a study
These sources are likely to be stakeholders in a program - participants, other researchers, program staff, other community members, and so on.
Then we put all data in single framework & apply various statistical tools to find out the dynamic on the market.
During the analysis stage, feedback from the stakeholder groups would be compared to determine areas of agreement as well as areas of divergence