

Key Insights
The global taxi industry is experiencing robust expansion, projected to reach a substantial $278.65 million by 2025, driven by an impressive compound annual growth rate (CAGR) of 9.01% during the forecast period of 2025-2033. This dynamic growth is fueled by a confluence of factors, primarily the escalating adoption of online booking platforms and the increasing demand for convenient and efficient ride-hailing services. Consumers are increasingly gravitating towards digital solutions for their transportation needs, seeking real-time tracking, cashless payments, and a wider selection of vehicle options. The proliferation of smartphones and widespread internet connectivity across both developed and developing economies has significantly lowered the barrier to entry for digital taxi services, making them an integral part of urban mobility. Furthermore, the evolving urban landscapes, characterized by increasing population density and traffic congestion, have amplified the need for accessible and on-demand taxi services, positioning them as a vital component of daily commutes and travel.
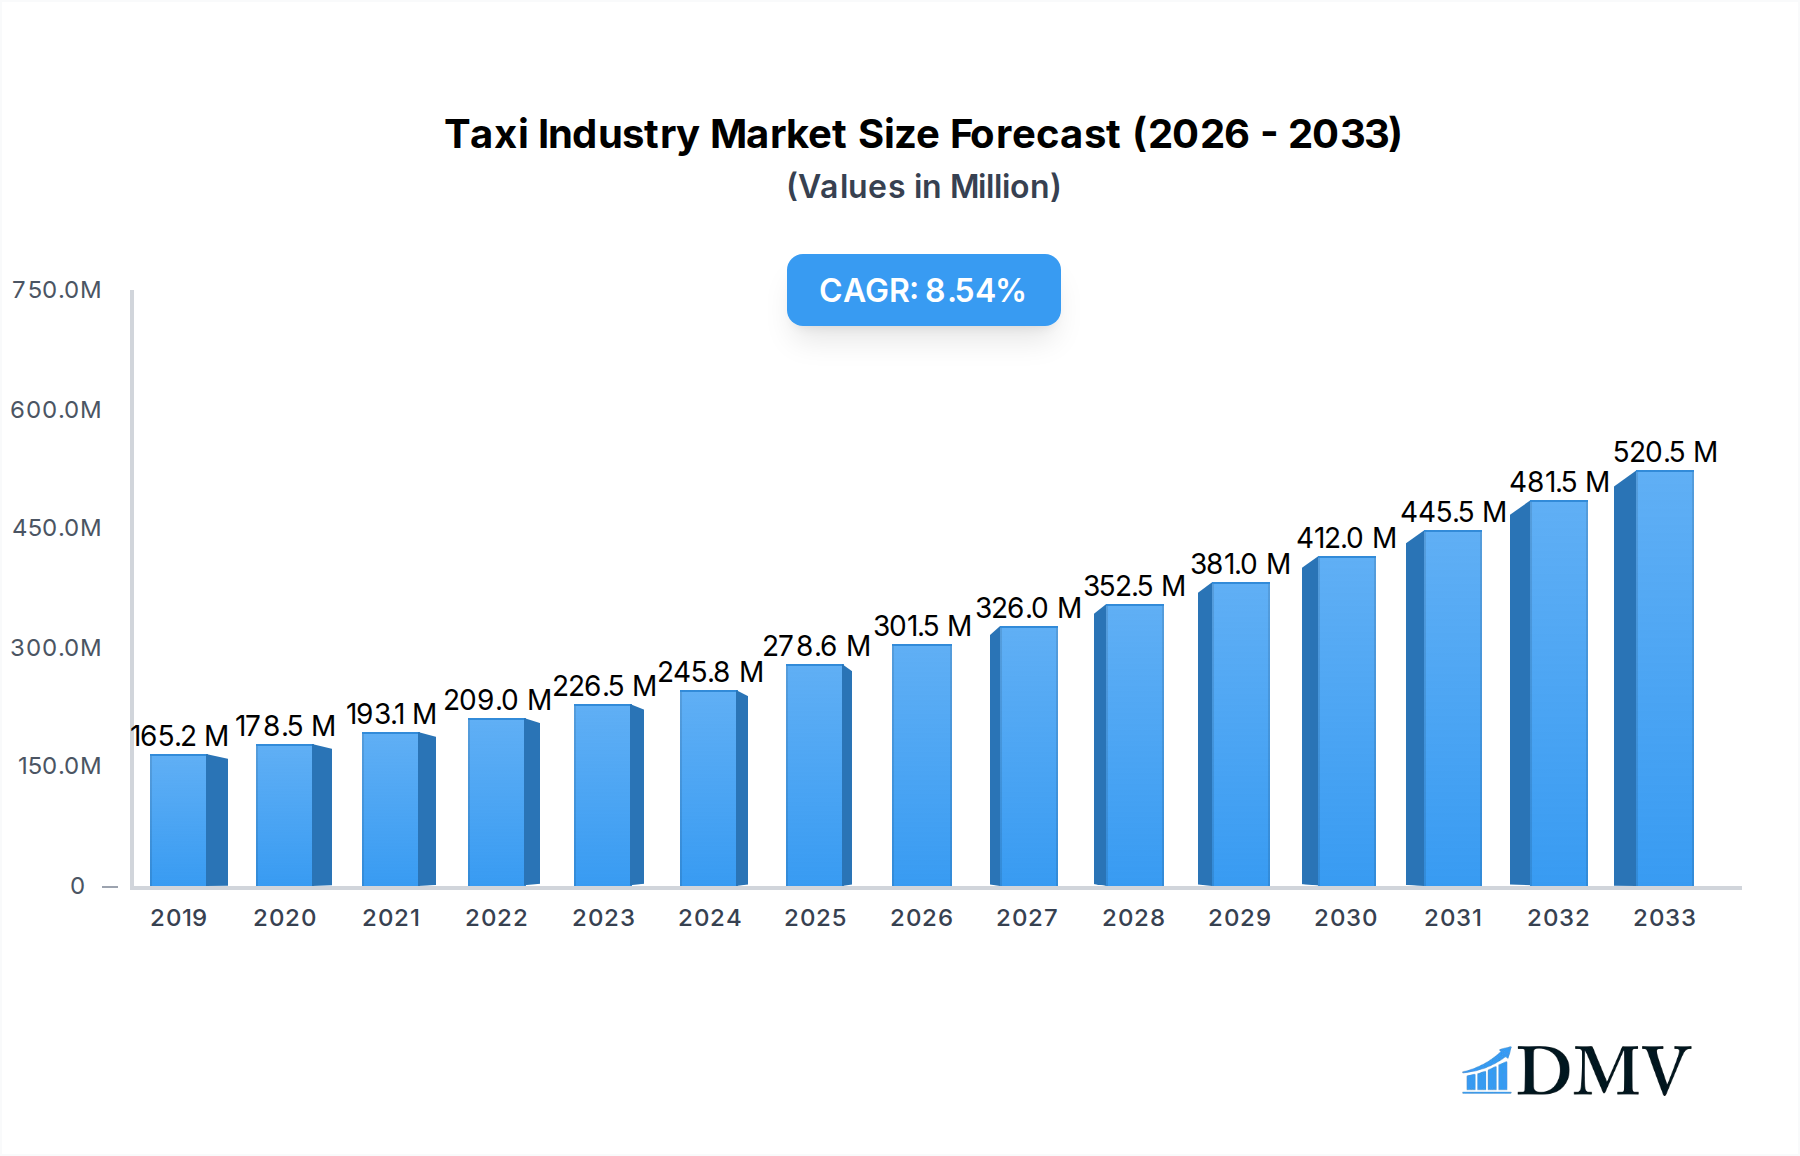
Taxi Industry Market Size (In Million)
The industry's evolution is further shaped by emerging trends such as the integration of advanced technologies like AI for route optimization and dynamic pricing, and a growing emphasis on sustainability with the introduction of electric vehicles and ride-sharing initiatives. While the market benefits from these drivers, it also faces certain restraints, including stringent regulatory frameworks in various regions, which can impact operational flexibility and cost structures, as well as intense competition among established players and emerging startups. Nevertheless, the market's segmentation, encompassing various booking types (online vs. offline), service types (ride-hailing vs. ride-sharing), and a diverse range of vehicle types (motorcycles, cars, vans), demonstrates its adaptability and capacity to cater to a broad spectrum of consumer preferences. Key players like Uber Technologies Inc., Lyft Inc., Gojek Tech, and Grab Holdings Inc. are at the forefront, constantly innovating and expanding their service offerings to capture market share across diverse geographical regions such as North America, Europe, and Asia Pacific.

Taxi Industry Company Market Share
Taxi Industry Market Composition & Trends
The global taxi industry is undergoing a profound transformation, driven by technological innovation and evolving consumer preferences. This report delves into the intricate market composition, analyzing key trends shaping the future of urban mobility. We examine market concentration, with leading players like Uber Technologies Inc. and Lyft Inc. holding substantial market share, estimated to be over 70% in North America. Innovation catalysts include the widespread adoption of smartphone technology, GPS-enabled navigation, and sophisticated algorithms for dynamic pricing and efficient dispatch. The regulatory landscape remains a complex factor, with varying approaches across different jurisdictions regarding ride-hailing services, licensing, and driver classification. Substitute products, such as public transportation, personal vehicles, and emerging micro-mobility solutions like e-scooters, continue to exert influence. End-user profiles are increasingly segmented, encompassing daily commuters, tourists, and business travelers, each with distinct service expectations. Mergers and acquisitions (M&A) are a significant feature, with an estimated global M&A deal value exceeding $5,000 million between 2019 and 2023, as companies seek to consolidate market presence and expand service offerings.
- Market Share Distribution (Estimated):
- Ride-hailing Platforms: >70%
- Traditional Taxis: <30%
- M&A Deal Value (2019-2023): >$5,000 million
- Key Innovation Catalysts:
- Mobile App Penetration
- AI-driven Dispatch Systems
- Electric Vehicle Integration
- Regulatory Hurdles:
- Varying Licensing Requirements
- Driver Employment Status Debates
Taxi Industry Industry Evolution
The taxi industry's evolution from traditional street-hailing to sophisticated app-based platforms represents a paradigm shift in urban transportation. Over the historical period of 2019-2024, the market has witnessed a compound annual growth rate (CAGR) of approximately 15%, fueled by the rapid adoption of ride-hailing services. This growth trajectory has been significantly influenced by technological advancements, most notably the ubiquitous presence of smartphones and the development of robust mobile applications. Companies like Uber Technologies Inc. and Lyft Inc. pioneered a business model that leverages GPS technology and real-time data to connect passengers with drivers efficiently, disrupting the established taxi order. The introduction of online booking platforms has become the dominant booking type, accounting for an estimated 85% of all taxi services, a stark contrast to the prevalence of offline booking in the historical period.
Furthermore, the service types have diversified beyond simple ride-hailing to include ride-sharing options, which offer cost-effectiveness and a reduced environmental footprint. Vehicle types have also expanded beyond conventional cars to include motorcycles, particularly in emerging markets, and other vehicle types like vans for group travel, catering to a broader range of passenger needs. Consumer demand has shifted towards convenience, transparency in pricing, and on-demand availability. The base year of 2025 projects a continued upward trend, with an estimated market size of $200,000 million. The forecast period of 2025-2033 anticipates sustained growth, driven by further technological integration, expansion into underserved markets, and the increasing adoption of electric vehicles within taxi fleets, with an estimated CAGR of 12% during this period. The rise of autonomous vehicle technology also presents a long-term disruptive force, promising to reshape operational models and cost structures fundamentally.
- Historical CAGR (2019-2024): ~15%
- Dominant Booking Type (2025 Estimate): Online Booking (85%)
- Estimated Market Size (2025): $200,000 million
- Forecast CAGR (2025-2033): ~12%
- Key Technological Enablers:
- Smartphone Penetration
- GPS and Real-time Tracking
- Mobile Payment Integration
Leading Regions, Countries, or Segments in Taxi Industry
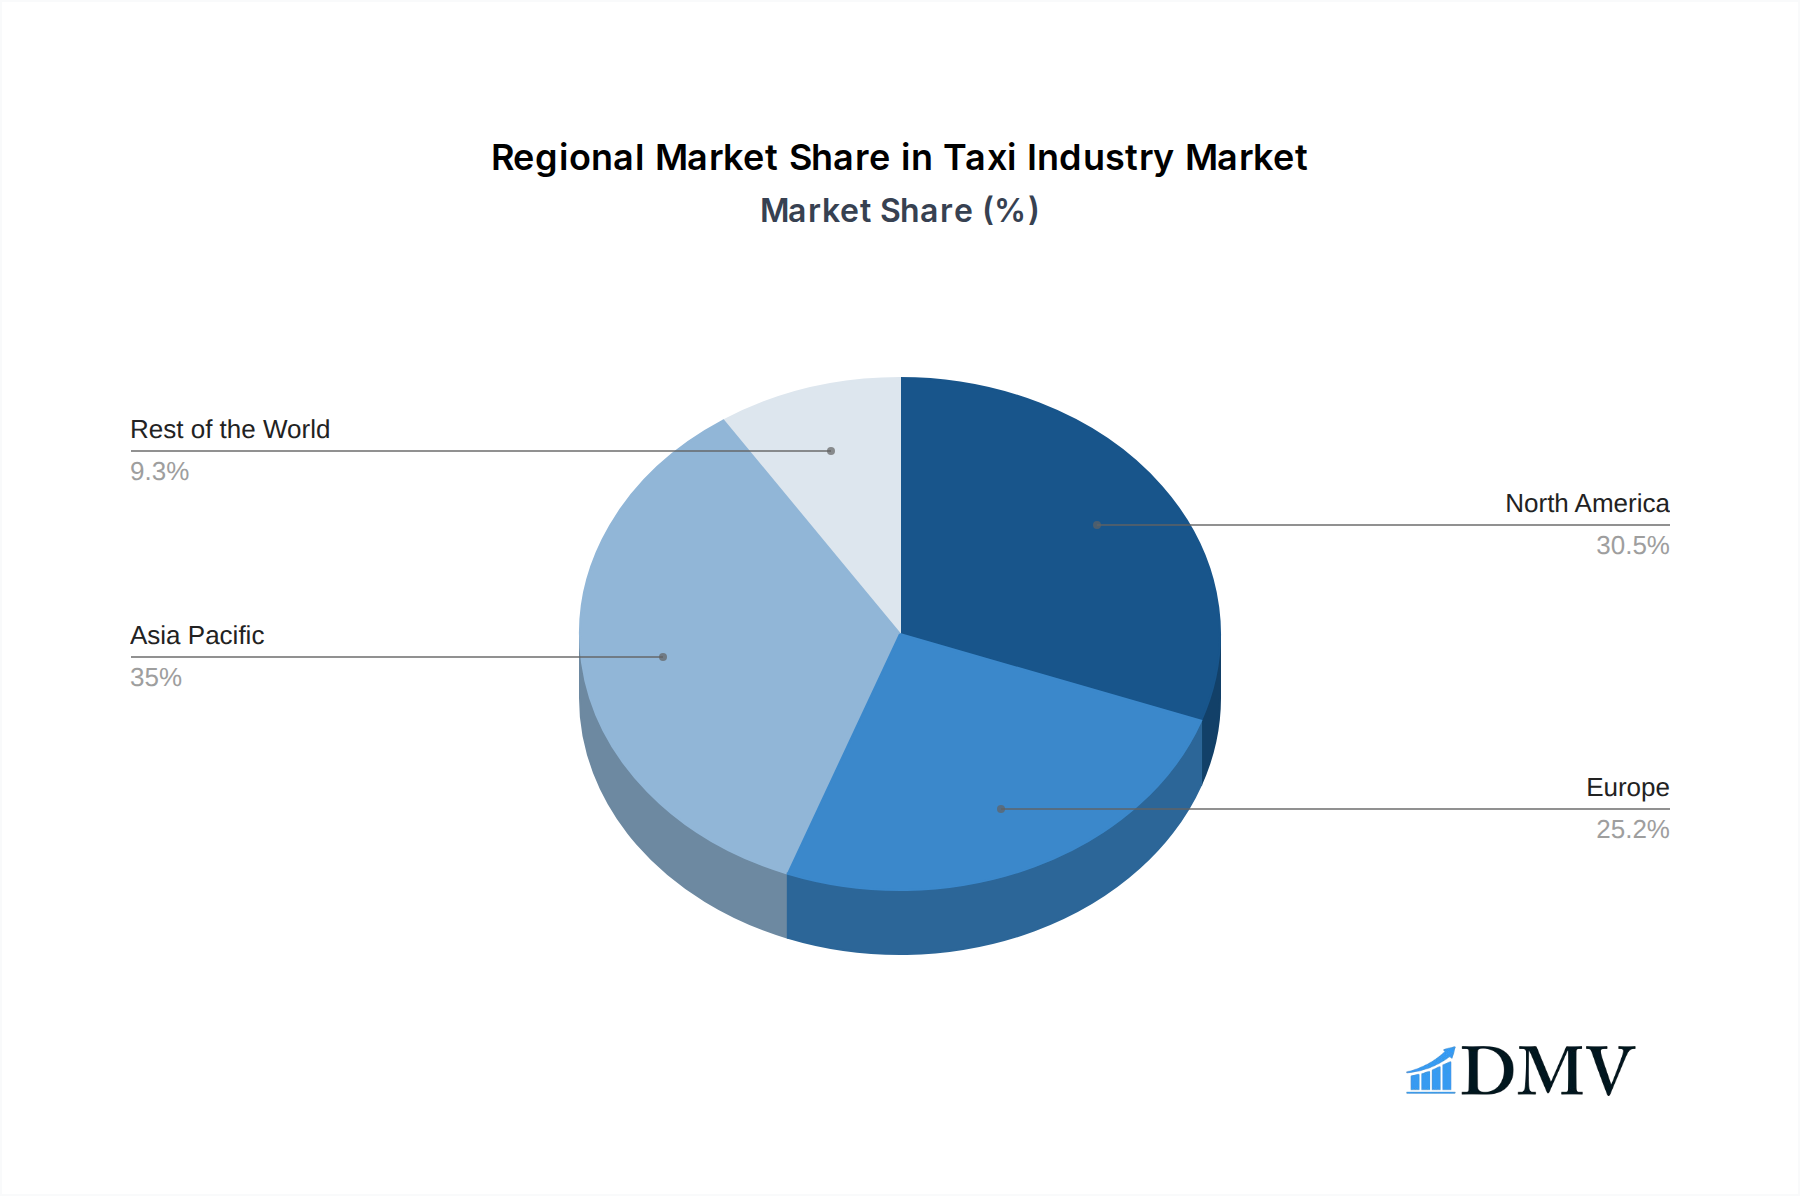
The taxi industry's landscape is characterized by distinct regional dominance and segment leadership, profoundly influencing market dynamics and investment strategies. North America, particularly the United States, stands as a leading region, driven by high disposable incomes, advanced technological infrastructure, and a receptive consumer base for ride-hailing services. Countries like the U.S. have seen an overwhelming preference for online booking, with an estimated 90% of transactions occurring through mobile applications. This dominance is further amplified by the widespread adoption of ride-hailing as the primary service type, representing over 80% of the market share within the region. Leading companies such as Uber Technologies Inc. and Lyft Inc. have established formidable presences, leveraging sophisticated algorithms for efficient service delivery and aggressive expansion strategies.
The service type segment of ride-hailing is universally dominant globally, with its convenience and on-demand nature appealing to a vast majority of urban dwellers and travelers. However, ride-sharing is gaining significant traction as an economical and environmentally conscious alternative, particularly in densely populated areas. In terms of vehicle types, cars remain the most prevalent, but the presence of motorcycles, especially in Asia, and other vehicle types like vans for group transportation, are crucial for market inclusivity. For instance, in India, ANI Technologies Pvt Ltd (Ola) and its competitors have integrated motorcycle taxis extensively to cater to affordability and traffic congestion.
Investment trends in this segment are heavily skewed towards technology and expansion. Regulatory support, or lack thereof, significantly impacts market penetration. For example, while Waymo's expansion into new Californian cities signals a supportive regulatory environment for autonomous taxi services, other regions grapple with establishing frameworks for these advanced technologies. The growth trajectory of online booking is propelled by increasing smartphone penetration and digital literacy across all demographics.
- Dominant Region: North America (especially the U.S.)
- Leading Booking Type: Online Booking
- Dominant Service Type: Ride-hailing
- Key Drivers of Dominance:
- High Smartphone Penetration
- Consumer Preference for Convenience
- Technological Infrastructure
- Aggressive Market Strategies of Key Players
- Emerging Trends:
- Growth of Ride-sharing for Cost-Effectiveness
- Integration of Motorcycles in Emerging Markets
- Expansion of Other Vehicle Types (Vans) for Group Travel
Taxi Industry Product Innovations
The taxi industry is a hotbed of continuous product innovation, aimed at enhancing user experience, operational efficiency, and sustainability. A significant advancement is the integration of artificial intelligence (AI) and machine learning for sophisticated demand forecasting, dynamic pricing, and optimized route planning, leading to reduced waiting times and increased driver earnings. Companies are also prioritizing the development and integration of electric vehicles (EVs) into their fleets, driven by environmental concerns and government incentives, a trend highlighted by Xanh SM Laos' expansion into new provinces. Furthermore, the adoption of in-app features like real-time driver tracking, in-app payments, and safety features such as SOS buttons and driver background checks are becoming standard, bolstering user confidence. The emergence of autonomous vehicle technology, as evidenced by Waymo's expansion, represents a paradigm shift with the potential to redefine service delivery and cost structures entirely.
- Key Innovations:
- AI-powered Demand Forecasting and Dynamic Pricing
- Electric Vehicle (EV) Integration
- Advanced In-App Safety Features
- Autonomous Driving Technology
Propelling Factors for Taxi Industry Growth
The taxi industry's growth is propelled by a confluence of technological advancements, favorable economic conditions, and evolving regulatory frameworks. The ubiquitous presence of smartphones and widespread internet access have paved the way for the seamless adoption of app-based ride-hailing services, making them the primary booking method. Economic factors, including increasing urbanization and a growing middle class in emerging economies, have boosted demand for convenient and affordable transportation solutions. Regulatory bodies in several regions are increasingly creating supportive environments for ride-sharing platforms, streamlining licensing processes and promoting competition. The growing awareness and demand for sustainable transportation options are also driving the adoption of electric vehicles within taxi fleets, aligning with global climate goals.
- Technological Advancements: Smartphone penetration, GPS, AI, mobile payment integration.
- Economic Factors: Urbanization, rising disposable incomes, demand for convenience.
- Regulatory Support: Streamlined licensing, pro-competition policies.
- Sustainability Focus: Demand for electric vehicle fleets.
Obstacles in the Taxi Industry Market
Despite robust growth, the taxi industry faces significant obstacles that can impede its progress. Regulatory challenges persist, with varying local laws regarding driver classification, licensing fees, and operational zones creating a fragmented and complex environment for global operators. Intense competition from both established ride-hailing giants and a multitude of smaller startups drives down prices and profit margins, creating pressure on profitability. Supply chain disruptions, particularly for electric vehicle components, can impact fleet expansion plans and maintenance. Furthermore, public perception and safety concerns, although addressed through in-app features, can still pose a barrier to adoption in certain demographics. The high operational costs associated with technology development, driver acquisition, and marketing also present a substantial hurdle.
- Regulatory Hurdles: Driver classification disputes, licensing complexities, varying local laws.
- Intense Competition: Price wars, market saturation, pressure on margins.
- Supply Chain Issues: EV component availability, maintenance challenges.
- Operational Costs: Technology investment, marketing spend, driver incentives.
Future Opportunities in Taxi Industry
The taxi industry is ripe with future opportunities, particularly in the expansion of electric vehicle integration and the burgeoning autonomous vehicle sector. Emerging markets in Africa and Southeast Asia present significant untapped potential for ride-hailing services, driven by growing populations and increasing digital adoption. The development of specialized services, such as on-demand delivery of goods, corporate travel solutions, and accessible transportation for the elderly or disabled, can open new revenue streams. Furthermore, strategic partnerships with public transportation networks could create integrated mobility solutions, enhancing urban transit efficiency. The increasing global focus on sustainability also creates a strong opportunity for companies leading in EV fleet deployment and carbon-neutral operations.
- Untapped Markets: Emerging economies in Africa and Southeast Asia.
- Specialized Services: Delivery, corporate travel, accessibility solutions.
- Integrated Mobility: Partnerships with public transport, Mobility-as-a-Service (MaaS).
- Sustainability Leadership: EV fleet expansion, carbon-neutral operations.
Major Players in the Taxi Industry Ecosystem
- Uber Technologies Inc.
- Lyft Inc.
- Didi Chuxing (Beijing Xiaoju Technology Co Ltd)
- ANI Technologies Pvt Ltd (Ola)
- Gojek Tech
- Grab Holdings Inc.
- Bolt Technologies OU
- FREE NOW
- BlaBlaCar
- Curb Mobility LLC
- Flywheel Software Inc
- Kabbee Exchange Limited
Key Developments in Taxi Industry Industry
- March 2024: Xanh SM Laos extended its electric taxi operations to Savannakhet Province, following successful launches in Vientiane's Capital and Vang Vieng, underscoring a commitment to electric vehicle promotion.
- March 2024: Waymo secured approval from California regulators for paid robotaxi rides in Los Angeles and expanded services in the San Francisco Bay Area.
- January 2024: Baayu, India's first app-based 100% electric and decentralized bike taxi service, was launched through a collaboration between Assam State Transport Corporation and a startup.
Strategic Taxi Industry Market Forecast
The strategic market forecast for the taxi industry indicates sustained and robust growth driven by continuous innovation and expanding service portfolios. The increasing adoption of electric vehicles, coupled with advancements in autonomous driving technology, promises to reshape operational efficiencies and reduce environmental impact, creating significant growth opportunities. Emerging markets offer substantial potential for expansion, as urbanization and digital penetration continue to rise. The focus on integrated mobility solutions and specialized services will further diversify revenue streams, catering to a broader spectrum of consumer needs. Companies that can effectively navigate regulatory landscapes, embrace technological change, and prioritize sustainability are poised for significant market share gains and long-term success. The estimated market size is projected to reach over $350,000 million by 2033.
Taxi Industry Segmentation
-
1. Booking Type
- 1.1. Online Booking
- 1.2. Offline Booking
-
2. Service Type
- 2.1. Ride-hailing
- 2.2. Ride-sharing
-
3. Vehicle Type
- 3.1. Motorcycle
- 3.2. Cars
- 3.3. Other Vehicle Types (Vans)
Taxi Industry Segmentation By Geography
-
1. North America
- 1.1. United States
- 1.2. Canada
- 1.3. Rest of North America
-
2. Europe
- 2.1. Germany
- 2.2. United Kingdom
- 2.3. France
- 2.4. Spain
- 2.5. Rest of Europe
-
3. Asia Pacific
- 3.1. China
- 3.2. India
- 3.3. Japan
- 3.4. Australia
- 3.5. Vietnam
- 3.6. South Korea
- 3.7. Rest of Asia Pacific
-
4. Rest of the World
- 4.1. Mexico
- 4.2. Brazil
- 4.3. South Africa
- 4.4. Argentina
- 4.5. Other Countries
Taxi Industry Regional Market Share
Geographic Coverage of Taxi Industry
Taxi Industry REPORT HIGHLIGHTS
| Aspects | Details |
|---|---|
| Study Period | 2020-2034 |
| Base Year | 2025 |
| Estimated Year | 2026 |
| Forecast Period | 2026-2034 |
| Historical Period | 2020-2025 |
| Growth Rate | CAGR of 9.01% from 2020-2034 |
| Segmentation |
|
Table of Contents
- 1. Introduction
- 1.1. Research Scope
- 1.2. Market Segmentation
- 1.3. Research Objective
- 1.4. Definitions and Assumptions
- 2. Executive Summary
- 2.1. Market Snapshot
- 3. Market Dynamics
- 3.1. Market Drivers
- 3.2. Market Restrains
- 3.3. Market Trends
- 3.4. Market Opportunities
- 4. Market Factor Analysis
- 4.1. Porters Five Forces
- 4.1.1. Bargaining Power of Suppliers
- 4.1.2. Bargaining Power of Buyers
- 4.1.3. Threat of New Entrants
- 4.1.4. Threat of Substitutes
- 4.1.5. Competitive Rivalry
- 4.2. PESTEL analysis
- 4.3. BCG Analysis
- 4.3.1. Stars (High Growth, High Market Share)
- 4.3.2. Cash Cows (Low Growth, High Market Share)
- 4.3.3. Question Mark (High Growth, Low Market Share)
- 4.3.4. Dogs (Low Growth, Low Market Share)
- 4.4. Ansoff Matrix Analysis
- 4.5. Supply Chain Analysis
- 4.6. Regulatory Landscape
- 4.7. Current Market Potential and Opportunity Assessment (TAM–SAM–SOM Framework)
- 4.8. DMV Analyst Note
- 4.1. Porters Five Forces
- 5. Market Analysis, Insights and Forecast 2021-2033
- 5.1. Market Analysis, Insights and Forecast - by Booking Type
- 5.1.1. Online Booking
- 5.1.2. Offline Booking
- 5.2. Market Analysis, Insights and Forecast - by Service Type
- 5.2.1. Ride-hailing
- 5.2.2. Ride-sharing
- 5.3. Market Analysis, Insights and Forecast - by Vehicle Type
- 5.3.1. Motorcycle
- 5.3.2. Cars
- 5.3.3. Other Vehicle Types (Vans)
- 5.4. Market Analysis, Insights and Forecast - by Region
- 5.4.1. North America
- 5.4.2. Europe
- 5.4.3. Asia Pacific
- 5.4.4. Rest of the World
- 5.1. Market Analysis, Insights and Forecast - by Booking Type
- 6. Global Taxi Industry Analysis, Insights and Forecast, 2021-2033
- 6.1. Market Analysis, Insights and Forecast - by Booking Type
- 6.1.1. Online Booking
- 6.1.2. Offline Booking
- 6.2. Market Analysis, Insights and Forecast - by Service Type
- 6.2.1. Ride-hailing
- 6.2.2. Ride-sharing
- 6.3. Market Analysis, Insights and Forecast - by Vehicle Type
- 6.3.1. Motorcycle
- 6.3.2. Cars
- 6.3.3. Other Vehicle Types (Vans)
- 6.1. Market Analysis, Insights and Forecast - by Booking Type
- 7. North America Taxi Industry Analysis, Insights and Forecast, 2020-2032
- 7.1. Market Analysis, Insights and Forecast - by Booking Type
- 7.1.1. Online Booking
- 7.1.2. Offline Booking
- 7.2. Market Analysis, Insights and Forecast - by Service Type
- 7.2.1. Ride-hailing
- 7.2.2. Ride-sharing
- 7.3. Market Analysis, Insights and Forecast - by Vehicle Type
- 7.3.1. Motorcycle
- 7.3.2. Cars
- 7.3.3. Other Vehicle Types (Vans)
- 7.1. Market Analysis, Insights and Forecast - by Booking Type
- 8. Europe Taxi Industry Analysis, Insights and Forecast, 2020-2032
- 8.1. Market Analysis, Insights and Forecast - by Booking Type
- 8.1.1. Online Booking
- 8.1.2. Offline Booking
- 8.2. Market Analysis, Insights and Forecast - by Service Type
- 8.2.1. Ride-hailing
- 8.2.2. Ride-sharing
- 8.3. Market Analysis, Insights and Forecast - by Vehicle Type
- 8.3.1. Motorcycle
- 8.3.2. Cars
- 8.3.3. Other Vehicle Types (Vans)
- 8.1. Market Analysis, Insights and Forecast - by Booking Type
- 9. Asia Pacific Taxi Industry Analysis, Insights and Forecast, 2020-2032
- 9.1. Market Analysis, Insights and Forecast - by Booking Type
- 9.1.1. Online Booking
- 9.1.2. Offline Booking
- 9.2. Market Analysis, Insights and Forecast - by Service Type
- 9.2.1. Ride-hailing
- 9.2.2. Ride-sharing
- 9.3. Market Analysis, Insights and Forecast - by Vehicle Type
- 9.3.1. Motorcycle
- 9.3.2. Cars
- 9.3.3. Other Vehicle Types (Vans)
- 9.1. Market Analysis, Insights and Forecast - by Booking Type
- 10. Rest of the World Taxi Industry Analysis, Insights and Forecast, 2020-2032
- 10.1. Market Analysis, Insights and Forecast - by Booking Type
- 10.1.1. Online Booking
- 10.1.2. Offline Booking
- 10.2. Market Analysis, Insights and Forecast - by Service Type
- 10.2.1. Ride-hailing
- 10.2.2. Ride-sharing
- 10.3. Market Analysis, Insights and Forecast - by Vehicle Type
- 10.3.1. Motorcycle
- 10.3.2. Cars
- 10.3.3. Other Vehicle Types (Vans)
- 10.1. Market Analysis, Insights and Forecast - by Booking Type
- 11. Competitive Analysis
- 11.1. Company Profiles
- 11.1.1 BlaBlaCar
- 11.1.1.1. Company Overview
- 11.1.1.2. Products
- 11.1.1.3. Company Financials
- 11.1.1.4. SWOT Analysis
- 11.1.2 FREE NOW
- 11.1.2.1. Company Overview
- 11.1.2.2. Products
- 11.1.2.3. Company Financials
- 11.1.2.4. SWOT Analysis
- 11.1.3 Curb Mobility LLC
- 11.1.3.1. Company Overview
- 11.1.3.2. Products
- 11.1.3.3. Company Financials
- 11.1.3.4. SWOT Analysis
- 11.1.4 Flywheel Software Inc
- 11.1.4.1. Company Overview
- 11.1.4.2. Products
- 11.1.4.3. Company Financials
- 11.1.4.4. SWOT Analysis
- 11.1.5 Lyft Inc
- 11.1.5.1. Company Overview
- 11.1.5.2. Products
- 11.1.5.3. Company Financials
- 11.1.5.4. SWOT Analysis
- 11.1.6 Gojek Tech
- 11.1.6.1. Company Overview
- 11.1.6.2. Products
- 11.1.6.3. Company Financials
- 11.1.6.4. SWOT Analysis
- 11.1.7 Kabbee Exchange Limited
- 11.1.7.1. Company Overview
- 11.1.7.2. Products
- 11.1.7.3. Company Financials
- 11.1.7.4. SWOT Analysis
- 11.1.8 Uber Technologies Inc *List Not Exhaustive
- 11.1.8.1. Company Overview
- 11.1.8.2. Products
- 11.1.8.3. Company Financials
- 11.1.8.4. SWOT Analysis
- 11.1.9 ANI Technologies Pvt Ltd (Ola)
- 11.1.9.1. Company Overview
- 11.1.9.2. Products
- 11.1.9.3. Company Financials
- 11.1.9.4. SWOT Analysis
- 11.1.10 Bolt Technologies OU
- 11.1.10.1. Company Overview
- 11.1.10.2. Products
- 11.1.10.3. Company Financials
- 11.1.10.4. SWOT Analysis
- 11.1.11 (Didi Chuxing) Beijing Xiaoju Technology Co Ltd
- 11.1.11.1. Company Overview
- 11.1.11.2. Products
- 11.1.11.3. Company Financials
- 11.1.11.4. SWOT Analysis
- 11.1.12 Grab Holdings Inc
- 11.1.12.1. Company Overview
- 11.1.12.2. Products
- 11.1.12.3. Company Financials
- 11.1.12.4. SWOT Analysis
- 11.1.1 BlaBlaCar
- 11.2. Market Entropy
- 11.2.1 Company's Key Areas Served
- 11.2.2 Recent Developments
- 11.3. Company Market Share Analysis 2025
- 11.3.1 Top 5 Companies Market Share Analysis
- 11.3.2 Top 3 Companies Market Share Analysis
- 11.4. List of Potential Customers
- 12. Research Methodology
List of Figures
- Figure 1: Global Taxi Industry Revenue Breakdown (Million, %) by Region 2025 & 2033
- Figure 2: North America Taxi Industry Revenue (Million), by Booking Type 2025 & 2033
- Figure 3: North America Taxi Industry Revenue Share (%), by Booking Type 2025 & 2033
- Figure 4: North America Taxi Industry Revenue (Million), by Service Type 2025 & 2033
- Figure 5: North America Taxi Industry Revenue Share (%), by Service Type 2025 & 2033
- Figure 6: North America Taxi Industry Revenue (Million), by Vehicle Type 2025 & 2033
- Figure 7: North America Taxi Industry Revenue Share (%), by Vehicle Type 2025 & 2033
- Figure 8: North America Taxi Industry Revenue (Million), by Country 2025 & 2033
- Figure 9: North America Taxi Industry Revenue Share (%), by Country 2025 & 2033
- Figure 10: Europe Taxi Industry Revenue (Million), by Booking Type 2025 & 2033
- Figure 11: Europe Taxi Industry Revenue Share (%), by Booking Type 2025 & 2033
- Figure 12: Europe Taxi Industry Revenue (Million), by Service Type 2025 & 2033
- Figure 13: Europe Taxi Industry Revenue Share (%), by Service Type 2025 & 2033
- Figure 14: Europe Taxi Industry Revenue (Million), by Vehicle Type 2025 & 2033
- Figure 15: Europe Taxi Industry Revenue Share (%), by Vehicle Type 2025 & 2033
- Figure 16: Europe Taxi Industry Revenue (Million), by Country 2025 & 2033
- Figure 17: Europe Taxi Industry Revenue Share (%), by Country 2025 & 2033
- Figure 18: Asia Pacific Taxi Industry Revenue (Million), by Booking Type 2025 & 2033
- Figure 19: Asia Pacific Taxi Industry Revenue Share (%), by Booking Type 2025 & 2033
- Figure 20: Asia Pacific Taxi Industry Revenue (Million), by Service Type 2025 & 2033
- Figure 21: Asia Pacific Taxi Industry Revenue Share (%), by Service Type 2025 & 2033
- Figure 22: Asia Pacific Taxi Industry Revenue (Million), by Vehicle Type 2025 & 2033
- Figure 23: Asia Pacific Taxi Industry Revenue Share (%), by Vehicle Type 2025 & 2033
- Figure 24: Asia Pacific Taxi Industry Revenue (Million), by Country 2025 & 2033
- Figure 25: Asia Pacific Taxi Industry Revenue Share (%), by Country 2025 & 2033
- Figure 26: Rest of the World Taxi Industry Revenue (Million), by Booking Type 2025 & 2033
- Figure 27: Rest of the World Taxi Industry Revenue Share (%), by Booking Type 2025 & 2033
- Figure 28: Rest of the World Taxi Industry Revenue (Million), by Service Type 2025 & 2033
- Figure 29: Rest of the World Taxi Industry Revenue Share (%), by Service Type 2025 & 2033
- Figure 30: Rest of the World Taxi Industry Revenue (Million), by Vehicle Type 2025 & 2033
- Figure 31: Rest of the World Taxi Industry Revenue Share (%), by Vehicle Type 2025 & 2033
- Figure 32: Rest of the World Taxi Industry Revenue (Million), by Country 2025 & 2033
- Figure 33: Rest of the World Taxi Industry Revenue Share (%), by Country 2025 & 2033
List of Tables
- Table 1: Global Taxi Industry Revenue Million Forecast, by Booking Type 2020 & 2033
- Table 2: Global Taxi Industry Revenue Million Forecast, by Service Type 2020 & 2033
- Table 3: Global Taxi Industry Revenue Million Forecast, by Vehicle Type 2020 & 2033
- Table 4: Global Taxi Industry Revenue Million Forecast, by Region 2020 & 2033
- Table 5: Global Taxi Industry Revenue Million Forecast, by Booking Type 2020 & 2033
- Table 6: Global Taxi Industry Revenue Million Forecast, by Service Type 2020 & 2033
- Table 7: Global Taxi Industry Revenue Million Forecast, by Vehicle Type 2020 & 2033
- Table 8: Global Taxi Industry Revenue Million Forecast, by Country 2020 & 2033
- Table 9: United States Taxi Industry Revenue (Million) Forecast, by Application 2020 & 2033
- Table 10: Canada Taxi Industry Revenue (Million) Forecast, by Application 2020 & 2033
- Table 11: Rest of North America Taxi Industry Revenue (Million) Forecast, by Application 2020 & 2033
- Table 12: Global Taxi Industry Revenue Million Forecast, by Booking Type 2020 & 2033
- Table 13: Global Taxi Industry Revenue Million Forecast, by Service Type 2020 & 2033
- Table 14: Global Taxi Industry Revenue Million Forecast, by Vehicle Type 2020 & 2033
- Table 15: Global Taxi Industry Revenue Million Forecast, by Country 2020 & 2033
- Table 16: Germany Taxi Industry Revenue (Million) Forecast, by Application 2020 & 2033
- Table 17: United Kingdom Taxi Industry Revenue (Million) Forecast, by Application 2020 & 2033
- Table 18: France Taxi Industry Revenue (Million) Forecast, by Application 2020 & 2033
- Table 19: Spain Taxi Industry Revenue (Million) Forecast, by Application 2020 & 2033
- Table 20: Rest of Europe Taxi Industry Revenue (Million) Forecast, by Application 2020 & 2033
- Table 21: Global Taxi Industry Revenue Million Forecast, by Booking Type 2020 & 2033
- Table 22: Global Taxi Industry Revenue Million Forecast, by Service Type 2020 & 2033
- Table 23: Global Taxi Industry Revenue Million Forecast, by Vehicle Type 2020 & 2033
- Table 24: Global Taxi Industry Revenue Million Forecast, by Country 2020 & 2033
- Table 25: China Taxi Industry Revenue (Million) Forecast, by Application 2020 & 2033
- Table 26: India Taxi Industry Revenue (Million) Forecast, by Application 2020 & 2033
- Table 27: Japan Taxi Industry Revenue (Million) Forecast, by Application 2020 & 2033
- Table 28: Australia Taxi Industry Revenue (Million) Forecast, by Application 2020 & 2033
- Table 29: Vietnam Taxi Industry Revenue (Million) Forecast, by Application 2020 & 2033
- Table 30: South Korea Taxi Industry Revenue (Million) Forecast, by Application 2020 & 2033
- Table 31: Rest of Asia Pacific Taxi Industry Revenue (Million) Forecast, by Application 2020 & 2033
- Table 32: Global Taxi Industry Revenue Million Forecast, by Booking Type 2020 & 2033
- Table 33: Global Taxi Industry Revenue Million Forecast, by Service Type 2020 & 2033
- Table 34: Global Taxi Industry Revenue Million Forecast, by Vehicle Type 2020 & 2033
- Table 35: Global Taxi Industry Revenue Million Forecast, by Country 2020 & 2033
- Table 36: Mexico Taxi Industry Revenue (Million) Forecast, by Application 2020 & 2033
- Table 37: Brazil Taxi Industry Revenue (Million) Forecast, by Application 2020 & 2033
- Table 38: South Africa Taxi Industry Revenue (Million) Forecast, by Application 2020 & 2033
- Table 39: Argentina Taxi Industry Revenue (Million) Forecast, by Application 2020 & 2033
- Table 40: Other Countries Taxi Industry Revenue (Million) Forecast, by Application 2020 & 2033
Frequently Asked Questions
1. What is the projected Compound Annual Growth Rate (CAGR) of the Taxi Industry?
The projected CAGR is approximately 9.01%.
2. Which companies are prominent players in the Taxi Industry?
Key companies in the market include BlaBlaCar, FREE NOW, Curb Mobility LLC, Flywheel Software Inc, Lyft Inc, Gojek Tech, Kabbee Exchange Limited, Uber Technologies Inc *List Not Exhaustive, ANI Technologies Pvt Ltd (Ola), Bolt Technologies OU, (Didi Chuxing) Beijing Xiaoju Technology Co Ltd, Grab Holdings Inc.
3. What are the main segments of the Taxi Industry?
The market segments include Booking Type, Service Type, Vehicle Type.
4. Can you provide details about the market size?
The market size is estimated to be USD 278.65 Million as of 2022.
5. What are some drivers contributing to market growth?
Increasing Air Pollution Awareness and Health Concern is Driving the Demand.
6. What are the notable trends driving market growth?
Online Bookings are Driving the Market.
7. Are there any restraints impacting market growth?
High Cost of Installation Related to Industrial Robots.
8. Can you provide examples of recent developments in the market?
March 2024: After successfully launching services in Vientiane's Capital and the popular tourist destination of Vang Vieng, Xanh SM Laos officially extended its electric taxi operations to Savannakhet Province. This expansion not only signifies the next phase in Xanh SM's brand development but also underscores the company's ongoing dedication to the promotion of electric vehicles.
9. What pricing options are available for accessing the report?
Pricing options include single-user, multi-user, and enterprise licenses priced at USD 4750, USD 5250, and USD 8750 respectively.
10. Is the market size provided in terms of value or volume?
The market size is provided in terms of value, measured in Million.
11. Are there any specific market keywords associated with the report?
Yes, the market keyword associated with the report is "Taxi Industry," which aids in identifying and referencing the specific market segment covered.
12. How do I determine which pricing option suits my needs best?
The pricing options vary based on user requirements and access needs. Individual users may opt for single-user licenses, while businesses requiring broader access may choose multi-user or enterprise licenses for cost-effective access to the report.
13. Are there any additional resources or data provided in the Taxi Industry report?
While the report offers comprehensive insights, it's advisable to review the specific contents or supplementary materials provided to ascertain if additional resources or data are available.
14. How can I stay updated on further developments or reports in the Taxi Industry?
To stay informed about further developments, trends, and reports in the Taxi Industry, consider subscribing to industry newsletters, following relevant companies and organizations, or regularly checking reputable industry news sources and publications.
Methodology
Step 1 - Identification of Relevant Samples Size from Population Database


Step 2 - Approaches for Defining Global Market Size (Value, Volume* & Price*)

Note*: In applicable scenarios
Step 3 - Data Sources
Primary Research
- Web Analytics
- Survey Reports
- Research Institute
- Latest Research Reports
- Opinion Leaders
Secondary Research
- Annual Reports
- White Paper
- Latest Press Release
- Industry Association
- Paid Database
- Investor Presentations

Step 4 - Data Triangulation
Involves using different sources of information in order to increase the validity of a study
These sources are likely to be stakeholders in a program - participants, other researchers, program staff, other community members, and so on.
Then we put all data in single framework & apply various statistical tools to find out the dynamic on the market.
During the analysis stage, feedback from the stakeholder groups would be compared to determine areas of agreement as well as areas of divergence