

Key Insights
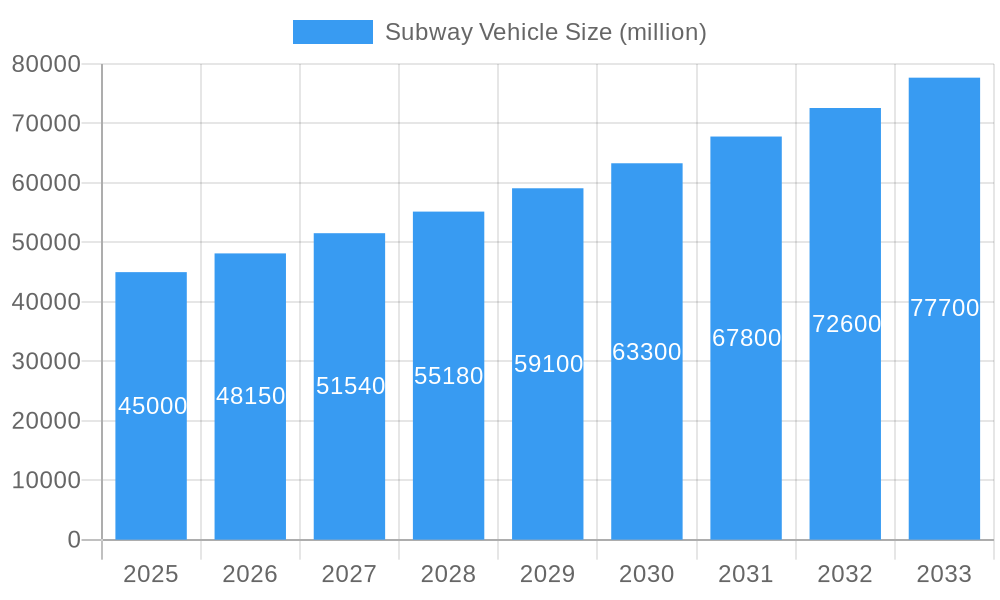
The global subway vehicle market is experiencing robust growth, driven by increasing urbanization, expanding public transportation networks, and government initiatives promoting sustainable transportation solutions. The market, estimated at $45 billion in 2025, is projected to exhibit a Compound Annual Growth Rate (CAGR) of 7% from 2025 to 2033, reaching approximately $75 billion by 2033. This growth is fueled by significant investments in infrastructure development across major cities worldwide, particularly in Asia-Pacific and Europe, where expanding metro lines and modernization projects are driving demand. Technological advancements, such as the incorporation of advanced signaling systems, improved energy efficiency, and enhanced passenger comfort features, are further contributing to market expansion. Key players like CRRC, Alstom, Siemens, and Bombardier are actively engaged in technological innovation and strategic partnerships to consolidate their market positions.
Subway Vehicle Market Size (In Billion)
However, the market faces certain restraints. High initial investment costs associated with subway vehicle procurement and infrastructure development can pose a challenge for some regions. Furthermore, fluctuating raw material prices and stringent regulatory compliance requirements can impact profitability and project timelines. Nevertheless, the long-term growth outlook remains positive, propelled by sustained urbanization trends and the growing need for efficient and eco-friendly mass transit systems. The market is segmented by vehicle type (e.g., light rail, metro, monorail), propulsion technology (e.g., electric, diesel), and geography. Emerging markets in developing economies present significant opportunities for future growth, particularly as these regions continue to invest in modernizing their public transportation infrastructure.
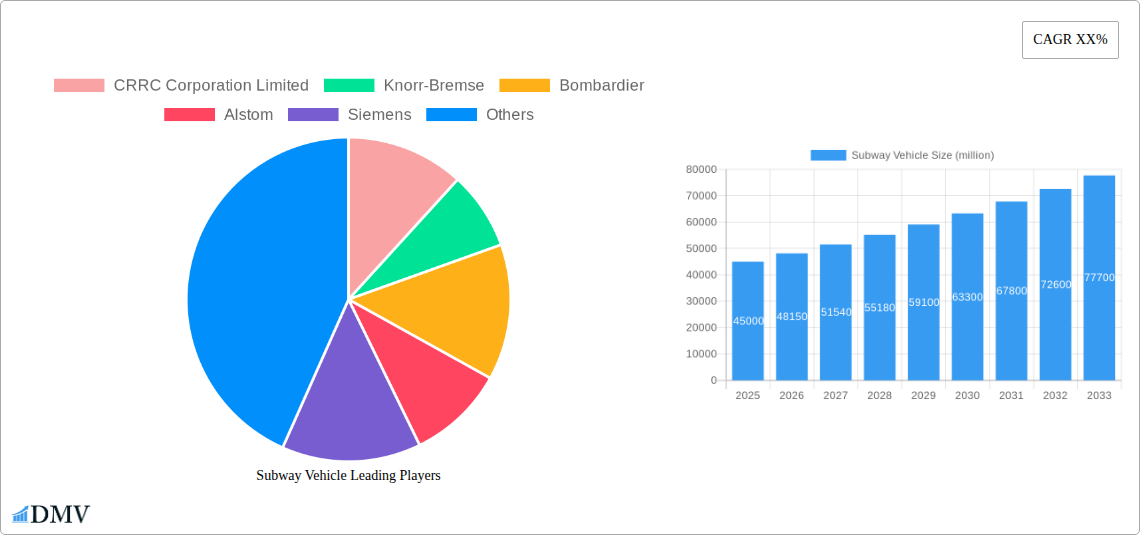
Subway Vehicle Company Market Share
Subway Vehicle Market: A Comprehensive Forecast Report (2019-2033)
This insightful report delivers a comprehensive analysis of the global subway vehicle market, projecting a market valuation exceeding $XX million by 2033. The study period covers 2019-2033, with a base and estimated year of 2025 and a forecast period spanning 2025-2033. This detailed examination provides critical insights for stakeholders, investors, and industry professionals seeking to navigate this dynamic market. We analyze key trends, leading players like CRRC Corporation Limited, Bombardier, and Alstom, and future growth opportunities, offering a crucial strategic advantage in this rapidly evolving sector.
Subway Vehicle Market Composition & Trends
The global subway vehicle market exhibits a moderately consolidated structure, with key players such as CRRC Corporation Limited, Bombardier, and Alstom holding significant market shares. However, the emergence of innovative technologies and increasing demand for sustainable transportation solutions is fostering competition. The market is characterized by robust M&A activity, with deal values exceeding $XX million in recent years, reflecting the industry's dynamic nature and consolidation trends.
- Market Concentration: CRRC Corporation Limited holds an estimated xx% market share, followed by Bombardier (xx%) and Alstom (xx%).
- Innovation Catalysts: The push for energy-efficient vehicles, advanced signaling systems, and autonomous technologies is driving innovation.
- Regulatory Landscape: Stringent safety regulations and environmental standards are shaping market dynamics.
- Substitute Products: While limited, bus rapid transit and light rail systems offer alternative modes of mass transit.
- End-User Profiles: Major end-users include municipal transit agencies and private railway operators globally.
- M&A Activity: Significant mergers and acquisitions have consolidated market share, particularly in the last five years with an aggregate value of approximately $XX million.
Subway Vehicle Industry Evolution
The subway vehicle market has witnessed robust growth driven by increasing urbanization and the need for efficient public transportation. Technological advancements, such as the adoption of lighter materials, improved energy efficiency, and advanced passenger information systems, have further propelled market expansion. Consumer demand for comfortable, safe, and accessible subway vehicles is a significant factor contributing to this growth. The market experienced a Compound Annual Growth Rate (CAGR) of xx% during the historical period (2019-2024) and is projected to maintain a CAGR of xx% during the forecast period (2025-2033). Adoption of new technologies, such as regenerative braking systems, is expected to increase by xx% over the forecast period, significantly impacting energy efficiency and operational costs.
Leading Regions, Countries, or Segments in Subway Vehicle
The Asia-Pacific region dominates the global subway vehicle market, driven primarily by rapid urbanization and substantial infrastructural investments in countries like China and India. Europe and North America also represent significant markets, albeit with slower growth rates compared to Asia-Pacific. The market segment focused on high-capacity vehicles is experiencing the most rapid growth.
- Key Drivers in Asia-Pacific:
- Massive infrastructure development projects.
- Government initiatives promoting sustainable transportation.
- High population density and increasing urbanization.
- Dominance Factors: The Asia-Pacific region’s dominance stems from its burgeoning population, rapid economic growth, and substantial government funding allocated to public transport infrastructure. The region's large-scale projects, such as metro expansions in major cities, drive significant demand for subway vehicles.
Subway Vehicle Product Innovations
Recent innovations include the integration of advanced passenger information systems, improved accessibility features for passengers with disabilities, and the incorporation of lighter, more durable materials for enhanced energy efficiency. The adoption of regenerative braking systems has significantly improved the environmental performance of subway vehicles. These innovations offer unique selling propositions, focusing on passenger comfort, operational efficiency, and environmental sustainability.
Propelling Factors for Subway Vehicle Growth
Technological advancements, such as the development of lightweight materials and energy-efficient systems, are key growth drivers. Government initiatives promoting sustainable transportation and increasing urbanization in developing economies further fuel market growth. Favorable regulatory frameworks supporting public transportation infrastructure development also contribute significantly. For example, the recent investments in metro rail projects in several major cities across the globe demonstrate the strong growth potential.
Obstacles in the Subway Vehicle Market
Significant barriers include stringent safety regulations and complex approval processes. Supply chain disruptions, particularly in the procurement of specialized components, can impact production timelines and costs. Intense competition among established players and the entry of new entrants also pose challenges. These factors can collectively lead to project delays and increased operational costs, ultimately affecting market growth and profitability.
Future Opportunities in Subway Vehicle
Emerging opportunities lie in the expansion of subway networks in developing economies, the growing demand for automated and driverless systems, and the increasing focus on sustainable and energy-efficient technologies. The integration of advanced data analytics and improved passenger experience features will create further growth avenues. Exploring new market segments, such as specialized vehicles for airports or tourist attractions, presents additional opportunities.
Major Players in the Subway Vehicle Ecosystem
- CRRC Corporation Limited (CRRC Corporation Limited)
- Knorr-Bremse (Knorr-Bremse)
- Bombardier (Bombardier)
- Alstom (Alstom)
- Siemens (Siemens)
- Mitsubishi (Mitsubishi)
- PKC Group (PKC Group)
- Progress Rail Services (Progress Rail Services)
- Promtractor-Vagon CJSC
- SCG Solutions
- Sinara Transport Machines
- Skoda Transportation (Skoda Transportation)
- Hyundai Rotem (Hyundai Rotem)
- Inekon Trams
- US Railcar
Key Developments in Subway Vehicle Industry
- 2022 Q4: Alstom launched a new generation of metro trains featuring advanced energy-efficient technologies.
- 2023 Q1: CRRC Corporation Limited secured a major contract for the supply of subway vehicles to a major metropolitan area in Asia.
- 2023 Q2: Bombardier and Siemens announced a joint venture to develop next-generation signaling systems for subway networks.
- 2024 Q1: A significant merger between two smaller subway vehicle manufacturers consolidated market share. (Further details are xx)
Strategic Subway Vehicle Market Forecast
The subway vehicle market is poised for continued growth driven by urbanization, technological advancements, and government investment in public transport infrastructure. The forecast period anticipates strong demand for high-capacity, energy-efficient vehicles, and autonomous systems. The market's future growth trajectory is positive, promising significant opportunities for existing players and new entrants alike. The global market is expected to witness substantial expansion, with a projected value exceeding $XX million by 2033.
Subway Vehicle Segmentation
-
1. Application
- 1.1. Large City
- 1.2. Medium-sized City
- 1.3. Small City
-
2. Types
- 2.1. Capacity: 0-100 People
- 2.2. Capacity: 100-200 People
- 2.3. Capacity: 200-300 People
- 2.4. Capacity: more than 300 People
Subway Vehicle Segmentation By Geography
-
1. North America
- 1.1. United States
- 1.2. Canada
- 1.3. Mexico
-
2. South America
- 2.1. Brazil
- 2.2. Argentina
- 2.3. Rest of South America
-
3. Europe
- 3.1. United Kingdom
- 3.2. Germany
- 3.3. France
- 3.4. Italy
- 3.5. Spain
- 3.6. Russia
- 3.7. Benelux
- 3.8. Nordics
- 3.9. Rest of Europe
-
4. Middle East & Africa
- 4.1. Turkey
- 4.2. Israel
- 4.3. GCC
- 4.4. North Africa
- 4.5. South Africa
- 4.6. Rest of Middle East & Africa
-
5. Asia Pacific
- 5.1. China
- 5.2. India
- 5.3. Japan
- 5.4. South Korea
- 5.5. ASEAN
- 5.6. Oceania
- 5.7. Rest of Asia Pacific
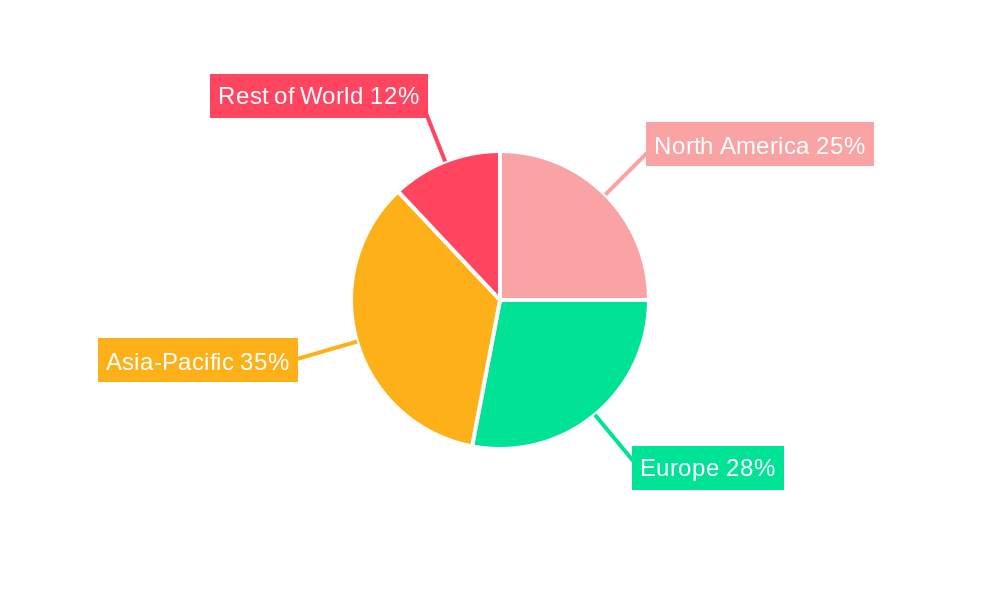
Subway Vehicle Regional Market Share
Geographic Coverage of Subway Vehicle
Subway Vehicle REPORT HIGHLIGHTS
| Aspects | Details |
|---|---|
| Study Period | 2020-2034 |
| Base Year | 2025 |
| Estimated Year | 2026 |
| Forecast Period | 2026-2034 |
| Historical Period | 2020-2025 |
| Growth Rate | CAGR of XX% from 2020-2034 |
| Segmentation |
|
Table of Contents
- 1. Introduction
- 1.1. Research Scope
- 1.2. Market Segmentation
- 1.3. Research Methodology
- 1.4. Definitions and Assumptions
- 2. Executive Summary
- 2.1. Introduction
- 3. Market Dynamics
- 3.1. Introduction
- 3.2. Market Drivers
- 3.3. Market Restrains
- 3.4. Market Trends
- 4. Market Factor Analysis
- 4.1. Porters Five Forces
- 4.2. Supply/Value Chain
- 4.3. PESTEL analysis
- 4.4. Market Entropy
- 4.5. Patent/Trademark Analysis
- 5. Global Subway Vehicle Analysis, Insights and Forecast, 2020-2032
- 5.1. Market Analysis, Insights and Forecast - by Application
- 5.1.1. Large City
- 5.1.2. Medium-sized City
- 5.1.3. Small City
- 5.2. Market Analysis, Insights and Forecast - by Types
- 5.2.1. Capacity: 0-100 People
- 5.2.2. Capacity: 100-200 People
- 5.2.3. Capacity: 200-300 People
- 5.2.4. Capacity: more than 300 People
- 5.3. Market Analysis, Insights and Forecast - by Region
- 5.3.1. North America
- 5.3.2. South America
- 5.3.3. Europe
- 5.3.4. Middle East & Africa
- 5.3.5. Asia Pacific
- 5.1. Market Analysis, Insights and Forecast - by Application
- 6. North America Subway Vehicle Analysis, Insights and Forecast, 2020-2032
- 6.1. Market Analysis, Insights and Forecast - by Application
- 6.1.1. Large City
- 6.1.2. Medium-sized City
- 6.1.3. Small City
- 6.2. Market Analysis, Insights and Forecast - by Types
- 6.2.1. Capacity: 0-100 People
- 6.2.2. Capacity: 100-200 People
- 6.2.3. Capacity: 200-300 People
- 6.2.4. Capacity: more than 300 People
- 6.1. Market Analysis, Insights and Forecast - by Application
- 7. South America Subway Vehicle Analysis, Insights and Forecast, 2020-2032
- 7.1. Market Analysis, Insights and Forecast - by Application
- 7.1.1. Large City
- 7.1.2. Medium-sized City
- 7.1.3. Small City
- 7.2. Market Analysis, Insights and Forecast - by Types
- 7.2.1. Capacity: 0-100 People
- 7.2.2. Capacity: 100-200 People
- 7.2.3. Capacity: 200-300 People
- 7.2.4. Capacity: more than 300 People
- 7.1. Market Analysis, Insights and Forecast - by Application
- 8. Europe Subway Vehicle Analysis, Insights and Forecast, 2020-2032
- 8.1. Market Analysis, Insights and Forecast - by Application
- 8.1.1. Large City
- 8.1.2. Medium-sized City
- 8.1.3. Small City
- 8.2. Market Analysis, Insights and Forecast - by Types
- 8.2.1. Capacity: 0-100 People
- 8.2.2. Capacity: 100-200 People
- 8.2.3. Capacity: 200-300 People
- 8.2.4. Capacity: more than 300 People
- 8.1. Market Analysis, Insights and Forecast - by Application
- 9. Middle East & Africa Subway Vehicle Analysis, Insights and Forecast, 2020-2032
- 9.1. Market Analysis, Insights and Forecast - by Application
- 9.1.1. Large City
- 9.1.2. Medium-sized City
- 9.1.3. Small City
- 9.2. Market Analysis, Insights and Forecast - by Types
- 9.2.1. Capacity: 0-100 People
- 9.2.2. Capacity: 100-200 People
- 9.2.3. Capacity: 200-300 People
- 9.2.4. Capacity: more than 300 People
- 9.1. Market Analysis, Insights and Forecast - by Application
- 10. Asia Pacific Subway Vehicle Analysis, Insights and Forecast, 2020-2032
- 10.1. Market Analysis, Insights and Forecast - by Application
- 10.1.1. Large City
- 10.1.2. Medium-sized City
- 10.1.3. Small City
- 10.2. Market Analysis, Insights and Forecast - by Types
- 10.2.1. Capacity: 0-100 People
- 10.2.2. Capacity: 100-200 People
- 10.2.3. Capacity: 200-300 People
- 10.2.4. Capacity: more than 300 People
- 10.1. Market Analysis, Insights and Forecast - by Application
- 11. Competitive Analysis
- 11.1. Global Market Share Analysis 2025
- 11.2. Company Profiles
- 11.2.1 CRRC Corporation Limited
- 11.2.1.1. Overview
- 11.2.1.2. Products
- 11.2.1.3. SWOT Analysis
- 11.2.1.4. Recent Developments
- 11.2.1.5. Financials (Based on Availability)
- 11.2.2 Knorr-Bremse
- 11.2.2.1. Overview
- 11.2.2.2. Products
- 11.2.2.3. SWOT Analysis
- 11.2.2.4. Recent Developments
- 11.2.2.5. Financials (Based on Availability)
- 11.2.3 Bombardier
- 11.2.3.1. Overview
- 11.2.3.2. Products
- 11.2.3.3. SWOT Analysis
- 11.2.3.4. Recent Developments
- 11.2.3.5. Financials (Based on Availability)
- 11.2.4 Alstom
- 11.2.4.1. Overview
- 11.2.4.2. Products
- 11.2.4.3. SWOT Analysis
- 11.2.4.4. Recent Developments
- 11.2.4.5. Financials (Based on Availability)
- 11.2.5 Siemens
- 11.2.5.1. Overview
- 11.2.5.2. Products
- 11.2.5.3. SWOT Analysis
- 11.2.5.4. Recent Developments
- 11.2.5.5. Financials (Based on Availability)
- 11.2.6 Mitsubishi
- 11.2.6.1. Overview
- 11.2.6.2. Products
- 11.2.6.3. SWOT Analysis
- 11.2.6.4. Recent Developments
- 11.2.6.5. Financials (Based on Availability)
- 11.2.7 PKC Group
- 11.2.7.1. Overview
- 11.2.7.2. Products
- 11.2.7.3. SWOT Analysis
- 11.2.7.4. Recent Developments
- 11.2.7.5. Financials (Based on Availability)
- 11.2.8 Progress Rail Services
- 11.2.8.1. Overview
- 11.2.8.2. Products
- 11.2.8.3. SWOT Analysis
- 11.2.8.4. Recent Developments
- 11.2.8.5. Financials (Based on Availability)
- 11.2.9 Promtractor-Vagon CJSC
- 11.2.9.1. Overview
- 11.2.9.2. Products
- 11.2.9.3. SWOT Analysis
- 11.2.9.4. Recent Developments
- 11.2.9.5. Financials (Based on Availability)
- 11.2.10 SCG Solutions
- 11.2.10.1. Overview
- 11.2.10.2. Products
- 11.2.10.3. SWOT Analysis
- 11.2.10.4. Recent Developments
- 11.2.10.5. Financials (Based on Availability)
- 11.2.11 Sinara Transport Machines
- 11.2.11.1. Overview
- 11.2.11.2. Products
- 11.2.11.3. SWOT Analysis
- 11.2.11.4. Recent Developments
- 11.2.11.5. Financials (Based on Availability)
- 11.2.12 Skoda Transportation
- 11.2.12.1. Overview
- 11.2.12.2. Products
- 11.2.12.3. SWOT Analysis
- 11.2.12.4. Recent Developments
- 11.2.12.5. Financials (Based on Availability)
- 11.2.13 Hyundai Rotem
- 11.2.13.1. Overview
- 11.2.13.2. Products
- 11.2.13.3. SWOT Analysis
- 11.2.13.4. Recent Developments
- 11.2.13.5. Financials (Based on Availability)
- 11.2.14 Inekon Trams
- 11.2.14.1. Overview
- 11.2.14.2. Products
- 11.2.14.3. SWOT Analysis
- 11.2.14.4. Recent Developments
- 11.2.14.5. Financials (Based on Availability)
- 11.2.15 US Railcar
- 11.2.15.1. Overview
- 11.2.15.2. Products
- 11.2.15.3. SWOT Analysis
- 11.2.15.4. Recent Developments
- 11.2.15.5. Financials (Based on Availability)
- 11.2.1 CRRC Corporation Limited
List of Figures
- Figure 1: Global Subway Vehicle Revenue Breakdown (million, %) by Region 2025 & 2033
- Figure 2: North America Subway Vehicle Revenue (million), by Application 2025 & 2033
- Figure 3: North America Subway Vehicle Revenue Share (%), by Application 2025 & 2033
- Figure 4: North America Subway Vehicle Revenue (million), by Types 2025 & 2033
- Figure 5: North America Subway Vehicle Revenue Share (%), by Types 2025 & 2033
- Figure 6: North America Subway Vehicle Revenue (million), by Country 2025 & 2033
- Figure 7: North America Subway Vehicle Revenue Share (%), by Country 2025 & 2033
- Figure 8: South America Subway Vehicle Revenue (million), by Application 2025 & 2033
- Figure 9: South America Subway Vehicle Revenue Share (%), by Application 2025 & 2033
- Figure 10: South America Subway Vehicle Revenue (million), by Types 2025 & 2033
- Figure 11: South America Subway Vehicle Revenue Share (%), by Types 2025 & 2033
- Figure 12: South America Subway Vehicle Revenue (million), by Country 2025 & 2033
- Figure 13: South America Subway Vehicle Revenue Share (%), by Country 2025 & 2033
- Figure 14: Europe Subway Vehicle Revenue (million), by Application 2025 & 2033
- Figure 15: Europe Subway Vehicle Revenue Share (%), by Application 2025 & 2033
- Figure 16: Europe Subway Vehicle Revenue (million), by Types 2025 & 2033
- Figure 17: Europe Subway Vehicle Revenue Share (%), by Types 2025 & 2033
- Figure 18: Europe Subway Vehicle Revenue (million), by Country 2025 & 2033
- Figure 19: Europe Subway Vehicle Revenue Share (%), by Country 2025 & 2033
- Figure 20: Middle East & Africa Subway Vehicle Revenue (million), by Application 2025 & 2033
- Figure 21: Middle East & Africa Subway Vehicle Revenue Share (%), by Application 2025 & 2033
- Figure 22: Middle East & Africa Subway Vehicle Revenue (million), by Types 2025 & 2033
- Figure 23: Middle East & Africa Subway Vehicle Revenue Share (%), by Types 2025 & 2033
- Figure 24: Middle East & Africa Subway Vehicle Revenue (million), by Country 2025 & 2033
- Figure 25: Middle East & Africa Subway Vehicle Revenue Share (%), by Country 2025 & 2033
- Figure 26: Asia Pacific Subway Vehicle Revenue (million), by Application 2025 & 2033
- Figure 27: Asia Pacific Subway Vehicle Revenue Share (%), by Application 2025 & 2033
- Figure 28: Asia Pacific Subway Vehicle Revenue (million), by Types 2025 & 2033
- Figure 29: Asia Pacific Subway Vehicle Revenue Share (%), by Types 2025 & 2033
- Figure 30: Asia Pacific Subway Vehicle Revenue (million), by Country 2025 & 2033
- Figure 31: Asia Pacific Subway Vehicle Revenue Share (%), by Country 2025 & 2033
List of Tables
- Table 1: Global Subway Vehicle Revenue million Forecast, by Application 2020 & 2033
- Table 2: Global Subway Vehicle Revenue million Forecast, by Types 2020 & 2033
- Table 3: Global Subway Vehicle Revenue million Forecast, by Region 2020 & 2033
- Table 4: Global Subway Vehicle Revenue million Forecast, by Application 2020 & 2033
- Table 5: Global Subway Vehicle Revenue million Forecast, by Types 2020 & 2033
- Table 6: Global Subway Vehicle Revenue million Forecast, by Country 2020 & 2033
- Table 7: United States Subway Vehicle Revenue (million) Forecast, by Application 2020 & 2033
- Table 8: Canada Subway Vehicle Revenue (million) Forecast, by Application 2020 & 2033
- Table 9: Mexico Subway Vehicle Revenue (million) Forecast, by Application 2020 & 2033
- Table 10: Global Subway Vehicle Revenue million Forecast, by Application 2020 & 2033
- Table 11: Global Subway Vehicle Revenue million Forecast, by Types 2020 & 2033
- Table 12: Global Subway Vehicle Revenue million Forecast, by Country 2020 & 2033
- Table 13: Brazil Subway Vehicle Revenue (million) Forecast, by Application 2020 & 2033
- Table 14: Argentina Subway Vehicle Revenue (million) Forecast, by Application 2020 & 2033
- Table 15: Rest of South America Subway Vehicle Revenue (million) Forecast, by Application 2020 & 2033
- Table 16: Global Subway Vehicle Revenue million Forecast, by Application 2020 & 2033
- Table 17: Global Subway Vehicle Revenue million Forecast, by Types 2020 & 2033
- Table 18: Global Subway Vehicle Revenue million Forecast, by Country 2020 & 2033
- Table 19: United Kingdom Subway Vehicle Revenue (million) Forecast, by Application 2020 & 2033
- Table 20: Germany Subway Vehicle Revenue (million) Forecast, by Application 2020 & 2033
- Table 21: France Subway Vehicle Revenue (million) Forecast, by Application 2020 & 2033
- Table 22: Italy Subway Vehicle Revenue (million) Forecast, by Application 2020 & 2033
- Table 23: Spain Subway Vehicle Revenue (million) Forecast, by Application 2020 & 2033
- Table 24: Russia Subway Vehicle Revenue (million) Forecast, by Application 2020 & 2033
- Table 25: Benelux Subway Vehicle Revenue (million) Forecast, by Application 2020 & 2033
- Table 26: Nordics Subway Vehicle Revenue (million) Forecast, by Application 2020 & 2033
- Table 27: Rest of Europe Subway Vehicle Revenue (million) Forecast, by Application 2020 & 2033
- Table 28: Global Subway Vehicle Revenue million Forecast, by Application 2020 & 2033
- Table 29: Global Subway Vehicle Revenue million Forecast, by Types 2020 & 2033
- Table 30: Global Subway Vehicle Revenue million Forecast, by Country 2020 & 2033
- Table 31: Turkey Subway Vehicle Revenue (million) Forecast, by Application 2020 & 2033
- Table 32: Israel Subway Vehicle Revenue (million) Forecast, by Application 2020 & 2033
- Table 33: GCC Subway Vehicle Revenue (million) Forecast, by Application 2020 & 2033
- Table 34: North Africa Subway Vehicle Revenue (million) Forecast, by Application 2020 & 2033
- Table 35: South Africa Subway Vehicle Revenue (million) Forecast, by Application 2020 & 2033
- Table 36: Rest of Middle East & Africa Subway Vehicle Revenue (million) Forecast, by Application 2020 & 2033
- Table 37: Global Subway Vehicle Revenue million Forecast, by Application 2020 & 2033
- Table 38: Global Subway Vehicle Revenue million Forecast, by Types 2020 & 2033
- Table 39: Global Subway Vehicle Revenue million Forecast, by Country 2020 & 2033
- Table 40: China Subway Vehicle Revenue (million) Forecast, by Application 2020 & 2033
- Table 41: India Subway Vehicle Revenue (million) Forecast, by Application 2020 & 2033
- Table 42: Japan Subway Vehicle Revenue (million) Forecast, by Application 2020 & 2033
- Table 43: South Korea Subway Vehicle Revenue (million) Forecast, by Application 2020 & 2033
- Table 44: ASEAN Subway Vehicle Revenue (million) Forecast, by Application 2020 & 2033
- Table 45: Oceania Subway Vehicle Revenue (million) Forecast, by Application 2020 & 2033
- Table 46: Rest of Asia Pacific Subway Vehicle Revenue (million) Forecast, by Application 2020 & 2033
Frequently Asked Questions
1. What is the projected Compound Annual Growth Rate (CAGR) of the Subway Vehicle?
The projected CAGR is approximately XX%.
2. Which companies are prominent players in the Subway Vehicle?
Key companies in the market include CRRC Corporation Limited, Knorr-Bremse, Bombardier, Alstom, Siemens, Mitsubishi, PKC Group, Progress Rail Services, Promtractor-Vagon CJSC, SCG Solutions, Sinara Transport Machines, Skoda Transportation, Hyundai Rotem, Inekon Trams, US Railcar.
3. What are the main segments of the Subway Vehicle?
The market segments include Application, Types.
4. Can you provide details about the market size?
The market size is estimated to be USD XXX million as of 2022.
5. What are some drivers contributing to market growth?
N/A
6. What are the notable trends driving market growth?
N/A
7. Are there any restraints impacting market growth?
N/A
8. Can you provide examples of recent developments in the market?
N/A
9. What pricing options are available for accessing the report?
Pricing options include single-user, multi-user, and enterprise licenses priced at USD 4900.00, USD 7350.00, and USD 9800.00 respectively.
10. Is the market size provided in terms of value or volume?
The market size is provided in terms of value, measured in million.
11. Are there any specific market keywords associated with the report?
Yes, the market keyword associated with the report is "Subway Vehicle," which aids in identifying and referencing the specific market segment covered.
12. How do I determine which pricing option suits my needs best?
The pricing options vary based on user requirements and access needs. Individual users may opt for single-user licenses, while businesses requiring broader access may choose multi-user or enterprise licenses for cost-effective access to the report.
13. Are there any additional resources or data provided in the Subway Vehicle report?
While the report offers comprehensive insights, it's advisable to review the specific contents or supplementary materials provided to ascertain if additional resources or data are available.
14. How can I stay updated on further developments or reports in the Subway Vehicle?
To stay informed about further developments, trends, and reports in the Subway Vehicle, consider subscribing to industry newsletters, following relevant companies and organizations, or regularly checking reputable industry news sources and publications.
Methodology
Step 1 - Identification of Relevant Samples Size from Population Database


Step 2 - Approaches for Defining Global Market Size (Value, Volume* & Price*)

Note*: In applicable scenarios
Step 3 - Data Sources
Primary Research
- Web Analytics
- Survey Reports
- Research Institute
- Latest Research Reports
- Opinion Leaders
Secondary Research
- Annual Reports
- White Paper
- Latest Press Release
- Industry Association
- Paid Database
- Investor Presentations

Step 4 - Data Triangulation
Involves using different sources of information in order to increase the validity of a study
These sources are likely to be stakeholders in a program - participants, other researchers, program staff, other community members, and so on.
Then we put all data in single framework & apply various statistical tools to find out the dynamic on the market.
During the analysis stage, feedback from the stakeholder groups would be compared to determine areas of agreement as well as areas of divergence