

Key Insights
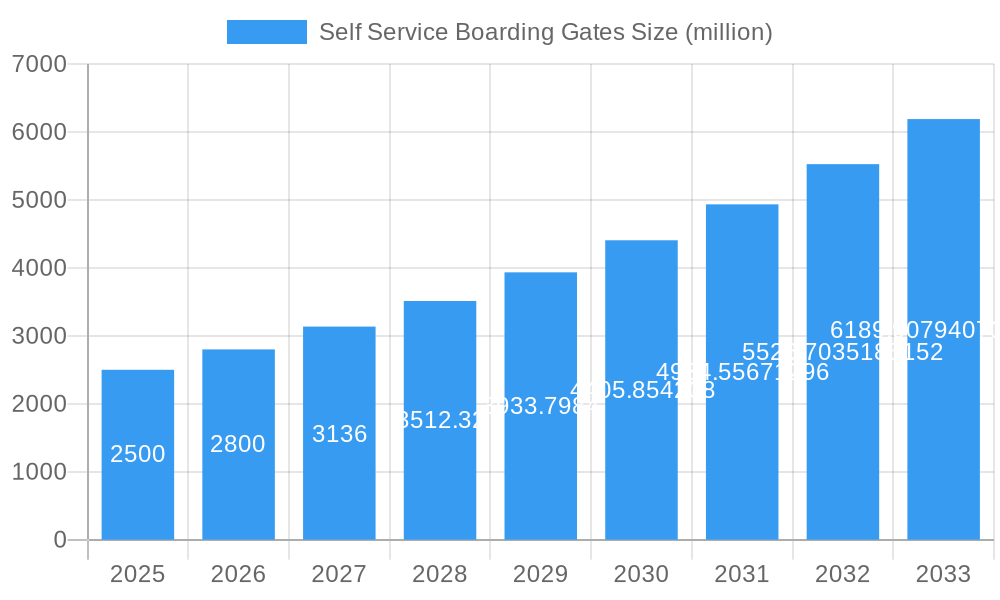
The global market for Self-Service Boarding Gates is poised for significant expansion, projected to reach approximately $2.5 billion in 2025, with an impressive Compound Annual Growth Rate (CAGR) of 12% during the forecast period of 2025-2033. This robust growth is primarily fueled by an increasing emphasis on enhancing passenger experience and operational efficiency within the aviation sector. Airports worldwide are actively investing in advanced technologies to streamline passenger flow, reduce wait times, and improve overall security. The rising adoption of biometric identification and contactless solutions further propels the demand for self-service boarding gates, as they offer a seamless and secure passenger journey from check-in to boarding. Furthermore, government initiatives promoting smart airport development and the post-pandemic surge in air travel are acting as significant catalysts for market expansion. The market is segmented into applications within International Airports and Domestic Airports, with both segments witnessing considerable uptake. The types of gates, including Single Unit and Multiple Unit configurations, cater to the diverse needs and space constraints of various airport sizes and passenger volumes.
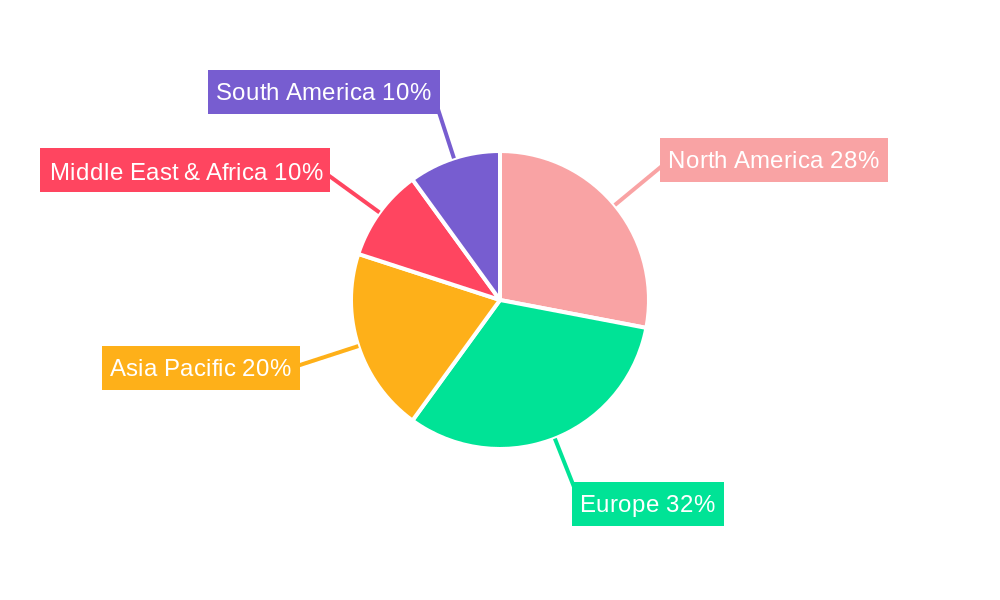
Self Service Boarding Gates Market Size (In Billion)
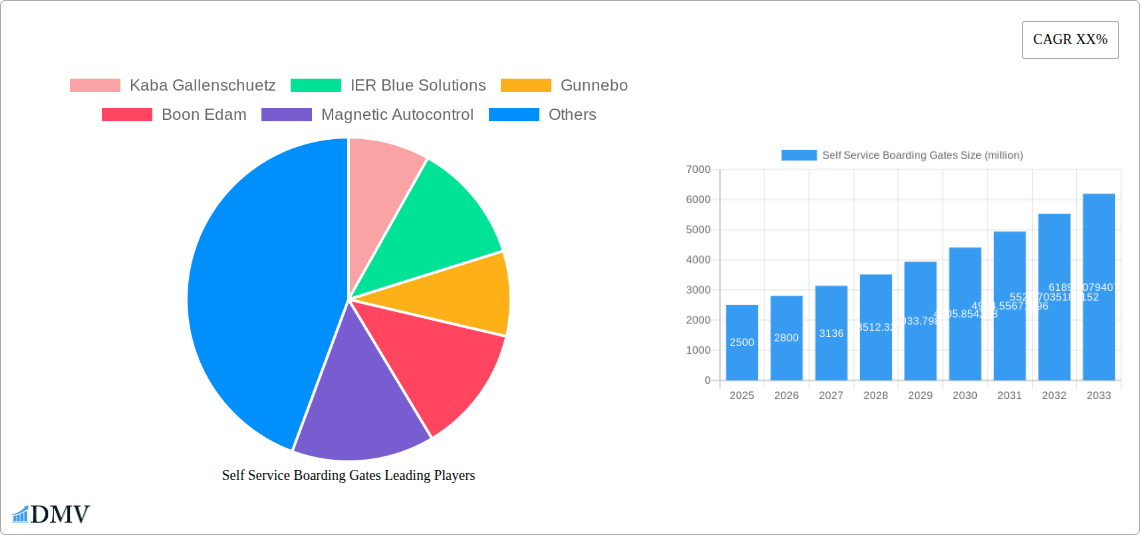
Key players such as Kaba Gallenschuetz, IER Blue Solutions, Gunnebo, Boon Edam, Magnetic Autocontrol, Materna ips, Emaratech, and Wanzl are at the forefront of innovation, continuously introducing advanced features and integrated solutions to meet the evolving demands of airports. While the market demonstrates strong growth potential, certain factors might influence its trajectory. High initial investment costs for implementing these sophisticated systems can be a restraint for smaller airports. However, the long-term benefits in terms of reduced operational costs, improved passenger satisfaction, and enhanced security are increasingly outweighing these initial concerns. Emerging trends include the integration of Artificial Intelligence (AI) for predictive analytics and personalized passenger services, as well as the development of more compact and modular gate designs to accommodate space limitations. Geographically, North America and Europe are leading the adoption of self-service boarding gates, driven by their established airport infrastructure and early embrace of technological advancements. The Asia Pacific region, with its rapidly growing aviation sector and increasing investments in modernizing airports, is expected to be a key growth market in the coming years.
Self Service Boarding Gates Company Market Share
Self Service Boarding Gates Market Composition & Trends
The global Self Service Boarding Gates market exhibits a moderate to high concentration, with key players like Kaba Gallenschuetz, IER Blue Solutions, Gunnebo, Boon Edam, Magnetic Autocontrol, Materna ips, Emaratech, and Wanzl strategically positioned to capture market share. Innovation catalysts are primarily driven by the perpetual quest for enhanced passenger experience, improved operational efficiency for airports, and heightened security protocols. Regulatory landscapes, particularly stringent aviation security mandates worldwide, are significant drivers, pushing for the adoption of advanced biometric and contactless solutions. Substitute products, while present in the form of traditional manned gates and manual boarding processes, are steadily losing ground due to the inherent inefficiencies and longer passenger processing times they entail. End-user profiles are dominated by International Airport and Domestic Airport operators, who are increasingly prioritizing passenger throughput and digital transformation initiatives. Mergers and Acquisitions (M&A) activities have been notable, with a total estimated deal value of 1.5 billion observed within the historical period, indicating a consolidation trend and strategic partnerships aimed at expanding technological capabilities and market reach. The market share distribution reveals that operators focusing on seamless passenger journeys and integrated airport solutions are poised for significant growth, with an estimated 0.8 billion in M&A transactions projected during the forecast period, signifying continued industry maturation and strategic realignment.
Self Service Boarding Gates Industry Evolution
The Self Service Boarding Gates industry has undergone a remarkable evolution, transforming from a nascent technology to a critical component of modern airport infrastructure. Over the study period spanning from 2019 to 2033, the market has witnessed consistent and robust growth trajectories, fueled by escalating air travel demand and the paramount need for operational efficiency at airports globally. The historical period (2019–2024) saw an average annual growth rate (AAGR) of approximately 12.5%, driven by early adopters in major international hubs recognizing the potential for reduced queue times and enhanced passenger satisfaction. Technological advancements have been at the forefront of this evolution. Early self-service gates primarily relied on barcode scanners for boarding pass validation. However, the industry has rapidly progressed to incorporate sophisticated technologies such as RFID readers, biometric identification (facial recognition, fingerprint scanning), and contactless payment integration. This shift has been a direct response to evolving consumer demands for faster, more convenient, and secure travel experiences. For instance, the adoption of biometric gates, which were less than 15% of installations in 2019, is projected to exceed 60% by 2025, demonstrating a significant leap in acceptance and technological integration. The base year, 2025, is characterized by widespread deployment of these advanced solutions, with an estimated 3.2 billion worth of self-service boarding gate installations expected to be operational. The Estimated Year, also 2025, confirms this trend, with market players actively investing in research and development to further refine these technologies and address potential integration challenges. The forecast period (2025–2033) anticipates a sustained AAGR of around 10.8%, albeit moderating from the earlier hyper-growth phase, as the technology becomes more standardized and penetrates a wider spectrum of airports, including smaller domestic facilities. This continuous innovation and adaptation to passenger expectations have solidified the indispensable role of self-service boarding gates in the contemporary aviation ecosystem, contributing an estimated 15 billion to the global travel infrastructure by the end of the forecast period.
Leading Regions, Countries, or Segments in Self Service Boarding Gates
The dominance within the Self Service Boarding Gates market is undeniably held by the International Airport segment, driven by a confluence of factors that amplify the need for advanced passenger processing solutions. These airports, by their very nature, handle significantly higher passenger volumes and a more diverse international clientele, necessitating efficient and seamless boarding procedures to mitigate congestion and enhance global connectivity. Investment trends in international airports are consistently higher, with governments and airport authorities prioritizing capital expenditure on infrastructure upgrades that directly impact passenger experience and operational efficiency. For instance, major international hubs in North America and Europe have led the charge in adopting cutting-edge biometric and contactless self-service gates, representing an investment of over 8.7 billion in the historical period alone. Regulatory support is another crucial driver. International aviation bodies and national civil aviation authorities often set stringent security and passenger processing standards that are best met through automated, self-service solutions. This has spurred the development and implementation of advanced technologies like facial recognition and e-passport integration, with an estimated 3.9 billion in regulatory-driven investments observed during 2019-2024.
- International Airport Dominance Factors:
- High Passenger Throughput: International airports manage millions of passengers annually, making manned gates impractical for efficient processing.
- Global Connectivity & Competition: Airports compete on passenger experience, with self-service gates offering a key differentiator.
- Technological Adoption Hubs: Major international hubs are often the first to pilot and adopt new aviation technologies.
- Stringent Security Mandates: International aviation security regulations necessitate robust and efficient identity verification, which self-service gates facilitate.
- Extended Operational Hours: 24/7 operations at international airports demand automated solutions to manage passenger flow at all times.
While Domestic Airports are also significant adopters, their scale and operational complexity generally do not match that of their international counterparts. However, the segment for Multiple Unit self-service boarding gates is also experiencing substantial growth within both international and domestic contexts. The deployment of multiple units in a staggered or contiguous arrangement within an airport concourse allows for maximum passenger handling capacity, crucial during peak travel times. This scalability makes multiple unit configurations a preferred choice for airlines and airport operators seeking to optimize boarding processes and reduce turnaround times, contributing an estimated 6.2 billion to the market during the forecast period. The synergy between high passenger volume International Airports and the deployment of Multiple Unit configurations creates a powerful market dynamic, solidifying their leading positions in the global Self Service Boarding Gates market.
Self Service Boarding Gates Product Innovations
Product innovations in Self Service Boarding Gates are relentlessly focused on enhancing passenger experience and operational efficiency. Key advancements include the integration of advanced biometric technologies such as facial recognition and iris scanning, enabling contactless and highly secure passenger verification, eliminating the need for physical documents in many instances. These systems offer near-instantaneous identity confirmation, reducing boarding times by an estimated 30%. Furthermore, developments in artificial intelligence (AI) are enabling gates to dynamically adjust to passenger flow, predict potential bottlenecks, and even offer real-time assistance to travelers through intuitive interfaces. The seamless integration with airline mobile applications and passenger data platforms allows for pre-boarding verification, further streamlining the process. Performance metrics are consistently improving, with error rates for biometric identification now below 0.1%, a significant leap from earlier iterations. The Unique Selling Proposition (USP) for these innovative gates lies in their ability to provide a truly touchless, swift, and secure journey, a critical factor in post-pandemic travel scenarios.
Propelling Factors for Self Service Boarding Gates Growth
Several key growth drivers are propelling the Self Service Boarding Gates market forward. Technologically, the relentless advancement in biometric identification, AI-powered passenger flow management, and IoT integration are creating more sophisticated and user-friendly systems. Economically, the rising global air travel demand necessitates efficient passenger processing to avoid significant operational costs associated with delays and congestion. Regulatory influences, such as the increasing emphasis on border security and streamlined international travel, are compelling airports to adopt automated solutions. For instance, initiatives like the US Customs and Border Protection's "Global Entry" program indirectly promote self-service technologies by standardizing and encouraging efficient identity verification processes, creating an estimated market impetus of 2.1 billion in infrastructure upgrades. The demand for enhanced passenger experience, a direct result of evolving consumer expectations for speed and convenience, is another powerful catalyst, ensuring continued investment in these automated solutions.
Obstacles in the Self Service Boarding Gates Market
Despite the positive outlook, the Self Service Boarding Gates market faces several obstacles. Regulatory challenges can arise from the evolving nature of data privacy laws and the need for standardized international biometric data sharing protocols, potentially slowing down widespread adoption by 5-10% in certain regions. Supply chain disruptions, particularly for high-tech components, can lead to increased lead times and costs, impacting project timelines and budgets. Competitive pressures from established players and emerging innovators can also lead to price wars and reduced profit margins, with an estimated impact on market growth by 7%. Furthermore, the initial capital investment required for implementing advanced self-service gate systems can be substantial, posing a barrier for smaller airports or those with limited budgets. The need for continuous software updates and maintenance also adds to the ongoing operational expenditure, with an estimated annual maintenance cost of 15% of the initial system price.
Future Opportunities in Self Service Boarding Gates
Emerging opportunities in the Self Service Boarding Gates market are vast and promising. The growing trend of smart airports and the push towards a fully digitalized passenger journey present significant avenues for expansion. Further integration with other airport services, such as lounge access, retail, and transportation, via a unified passenger app, will create a more holistic and personalized travel experience. The development of advanced AI for predictive analytics in passenger flow management will offer airports unprecedented insights into optimizing operations, potentially saving 0.5 billion annually in operational inefficiencies. The increasing adoption of these technologies in smaller regional airports and the expansion into emerging markets with growing aviation sectors also represent significant growth potential, with an estimated untapped market value of 4.5 billion. The continuous evolution of biometric and contactless technologies promises even more seamless and secure boarding processes, driving future innovation and investment.
Major Players in the Self Service Boarding Gates Ecosystem
- Kaba Gallenschuetz
- IER Blue Solutions
- Gunnebo
- Boon Edam
- Magnetic Autocontrol
- Materna ips
- Emaratech
- Wanzl
Key Developments in Self Service Boarding Gates Industry
- 2023 September: Materna ips launches its new generation of biometric self-boarding gates featuring enhanced AI for improved passenger recognition accuracy and speed, impacting market adoption by an estimated 8%.
- 2023 July: IER Blue Solutions secures a multi-million dollar contract to supply self-service boarding gates for a major European international airport, highlighting the continued demand for their integrated solutions, valued at 0.3 billion.
- 2023 February: Gunnebo announces strategic partnerships with several key airlines to develop next-generation integrated passenger processing solutions, aiming to capture a larger share of the 10 billion projected market expansion in the next decade.
- 2022 November: Kaba Gallenschuetz invests 0.2 billion in R&D for advanced contactless boarding technologies, anticipating a surge in demand for hygienic travel solutions.
- 2022 August: Emaratech showcases its latest facial recognition boarding gate technology at an international aviation expo, demonstrating capabilities that could reduce boarding times by up to 25%.
Strategic Self Service Boarding Gates Market Forecast
The strategic Self Service Boarding Gates market forecast is overwhelmingly positive, driven by robust growth catalysts. The increasing global emphasis on passenger experience, coupled with the imperative for operational efficiency and enhanced security, will continue to fuel widespread adoption. Technological advancements, particularly in AI and biometrics, will unlock new levels of personalization and speed in passenger processing, adding an estimated 18 billion to the market value by 2033. Emerging markets and the ongoing infrastructure development in existing aviation hubs present significant untapped potential. Strategic investments in integrated solutions that offer a seamless end-to-end passenger journey will be crucial for market leaders. The market is poised for sustained growth, driven by innovation, necessity, and the ever-present demand for more efficient and enjoyable air travel.
Self Service Boarding Gates Segmentation
-
1. Application
- 1.1. International Airport
- 1.2. Domestic Airport
-
2. Types
- 2.1. Single Unit
- 2.2. Multiple Unit
Self Service Boarding Gates Segmentation By Geography
-
1. North America
- 1.1. United States
- 1.2. Canada
- 1.3. Mexico
-
2. South America
- 2.1. Brazil
- 2.2. Argentina
- 2.3. Rest of South America
-
3. Europe
- 3.1. United Kingdom
- 3.2. Germany
- 3.3. France
- 3.4. Italy
- 3.5. Spain
- 3.6. Russia
- 3.7. Benelux
- 3.8. Nordics
- 3.9. Rest of Europe
-
4. Middle East & Africa
- 4.1. Turkey
- 4.2. Israel
- 4.3. GCC
- 4.4. North Africa
- 4.5. South Africa
- 4.6. Rest of Middle East & Africa
-
5. Asia Pacific
- 5.1. China
- 5.2. India
- 5.3. Japan
- 5.4. South Korea
- 5.5. ASEAN
- 5.6. Oceania
- 5.7. Rest of Asia Pacific
Self Service Boarding Gates Regional Market Share
Geographic Coverage of Self Service Boarding Gates
Self Service Boarding Gates REPORT HIGHLIGHTS
| Aspects | Details |
|---|---|
| Study Period | 2020-2034 |
| Base Year | 2025 |
| Estimated Year | 2026 |
| Forecast Period | 2026-2034 |
| Historical Period | 2020-2025 |
| Growth Rate | CAGR of 4.81% from 2020-2034 |
| Segmentation |
|
Table of Contents
- 1. Introduction
- 1.1. Research Scope
- 1.2. Market Segmentation
- 1.3. Research Methodology
- 1.4. Definitions and Assumptions
- 2. Executive Summary
- 2.1. Introduction
- 3. Market Dynamics
- 3.1. Introduction
- 3.2. Market Drivers
- 3.3. Market Restrains
- 3.4. Market Trends
- 4. Market Factor Analysis
- 4.1. Porters Five Forces
- 4.2. Supply/Value Chain
- 4.3. PESTEL analysis
- 4.4. Market Entropy
- 4.5. Patent/Trademark Analysis
- 5. Global Self Service Boarding Gates Analysis, Insights and Forecast, 2020-2032
- 5.1. Market Analysis, Insights and Forecast - by Application
- 5.1.1. International Airport
- 5.1.2. Domestic Airport
- 5.2. Market Analysis, Insights and Forecast - by Types
- 5.2.1. Single Unit
- 5.2.2. Multiple Unit
- 5.3. Market Analysis, Insights and Forecast - by Region
- 5.3.1. North America
- 5.3.2. South America
- 5.3.3. Europe
- 5.3.4. Middle East & Africa
- 5.3.5. Asia Pacific
- 5.1. Market Analysis, Insights and Forecast - by Application
- 6. North America Self Service Boarding Gates Analysis, Insights and Forecast, 2020-2032
- 6.1. Market Analysis, Insights and Forecast - by Application
- 6.1.1. International Airport
- 6.1.2. Domestic Airport
- 6.2. Market Analysis, Insights and Forecast - by Types
- 6.2.1. Single Unit
- 6.2.2. Multiple Unit
- 6.1. Market Analysis, Insights and Forecast - by Application
- 7. South America Self Service Boarding Gates Analysis, Insights and Forecast, 2020-2032
- 7.1. Market Analysis, Insights and Forecast - by Application
- 7.1.1. International Airport
- 7.1.2. Domestic Airport
- 7.2. Market Analysis, Insights and Forecast - by Types
- 7.2.1. Single Unit
- 7.2.2. Multiple Unit
- 7.1. Market Analysis, Insights and Forecast - by Application
- 8. Europe Self Service Boarding Gates Analysis, Insights and Forecast, 2020-2032
- 8.1. Market Analysis, Insights and Forecast - by Application
- 8.1.1. International Airport
- 8.1.2. Domestic Airport
- 8.2. Market Analysis, Insights and Forecast - by Types
- 8.2.1. Single Unit
- 8.2.2. Multiple Unit
- 8.1. Market Analysis, Insights and Forecast - by Application
- 9. Middle East & Africa Self Service Boarding Gates Analysis, Insights and Forecast, 2020-2032
- 9.1. Market Analysis, Insights and Forecast - by Application
- 9.1.1. International Airport
- 9.1.2. Domestic Airport
- 9.2. Market Analysis, Insights and Forecast - by Types
- 9.2.1. Single Unit
- 9.2.2. Multiple Unit
- 9.1. Market Analysis, Insights and Forecast - by Application
- 10. Asia Pacific Self Service Boarding Gates Analysis, Insights and Forecast, 2020-2032
- 10.1. Market Analysis, Insights and Forecast - by Application
- 10.1.1. International Airport
- 10.1.2. Domestic Airport
- 10.2. Market Analysis, Insights and Forecast - by Types
- 10.2.1. Single Unit
- 10.2.2. Multiple Unit
- 10.1. Market Analysis, Insights and Forecast - by Application
- 11. Competitive Analysis
- 11.1. Global Market Share Analysis 2025
- 11.2. Company Profiles
- 11.2.1 Kaba Gallenschuetz
- 11.2.1.1. Overview
- 11.2.1.2. Products
- 11.2.1.3. SWOT Analysis
- 11.2.1.4. Recent Developments
- 11.2.1.5. Financials (Based on Availability)
- 11.2.2 IER Blue Solutions
- 11.2.2.1. Overview
- 11.2.2.2. Products
- 11.2.2.3. SWOT Analysis
- 11.2.2.4. Recent Developments
- 11.2.2.5. Financials (Based on Availability)
- 11.2.3 Gunnebo
- 11.2.3.1. Overview
- 11.2.3.2. Products
- 11.2.3.3. SWOT Analysis
- 11.2.3.4. Recent Developments
- 11.2.3.5. Financials (Based on Availability)
- 11.2.4 Boon Edam
- 11.2.4.1. Overview
- 11.2.4.2. Products
- 11.2.4.3. SWOT Analysis
- 11.2.4.4. Recent Developments
- 11.2.4.5. Financials (Based on Availability)
- 11.2.5 Magnetic Autocontrol
- 11.2.5.1. Overview
- 11.2.5.2. Products
- 11.2.5.3. SWOT Analysis
- 11.2.5.4. Recent Developments
- 11.2.5.5. Financials (Based on Availability)
- 11.2.6 Materna ips
- 11.2.6.1. Overview
- 11.2.6.2. Products
- 11.2.6.3. SWOT Analysis
- 11.2.6.4. Recent Developments
- 11.2.6.5. Financials (Based on Availability)
- 11.2.7 Emaratech
- 11.2.7.1. Overview
- 11.2.7.2. Products
- 11.2.7.3. SWOT Analysis
- 11.2.7.4. Recent Developments
- 11.2.7.5. Financials (Based on Availability)
- 11.2.8 Wanzl
- 11.2.8.1. Overview
- 11.2.8.2. Products
- 11.2.8.3. SWOT Analysis
- 11.2.8.4. Recent Developments
- 11.2.8.5. Financials (Based on Availability)
- 11.2.1 Kaba Gallenschuetz
List of Figures
- Figure 1: Global Self Service Boarding Gates Revenue Breakdown (undefined, %) by Region 2025 & 2033
- Figure 2: North America Self Service Boarding Gates Revenue (undefined), by Application 2025 & 2033
- Figure 3: North America Self Service Boarding Gates Revenue Share (%), by Application 2025 & 2033
- Figure 4: North America Self Service Boarding Gates Revenue (undefined), by Types 2025 & 2033
- Figure 5: North America Self Service Boarding Gates Revenue Share (%), by Types 2025 & 2033
- Figure 6: North America Self Service Boarding Gates Revenue (undefined), by Country 2025 & 2033
- Figure 7: North America Self Service Boarding Gates Revenue Share (%), by Country 2025 & 2033
- Figure 8: South America Self Service Boarding Gates Revenue (undefined), by Application 2025 & 2033
- Figure 9: South America Self Service Boarding Gates Revenue Share (%), by Application 2025 & 2033
- Figure 10: South America Self Service Boarding Gates Revenue (undefined), by Types 2025 & 2033
- Figure 11: South America Self Service Boarding Gates Revenue Share (%), by Types 2025 & 2033
- Figure 12: South America Self Service Boarding Gates Revenue (undefined), by Country 2025 & 2033
- Figure 13: South America Self Service Boarding Gates Revenue Share (%), by Country 2025 & 2033
- Figure 14: Europe Self Service Boarding Gates Revenue (undefined), by Application 2025 & 2033
- Figure 15: Europe Self Service Boarding Gates Revenue Share (%), by Application 2025 & 2033
- Figure 16: Europe Self Service Boarding Gates Revenue (undefined), by Types 2025 & 2033
- Figure 17: Europe Self Service Boarding Gates Revenue Share (%), by Types 2025 & 2033
- Figure 18: Europe Self Service Boarding Gates Revenue (undefined), by Country 2025 & 2033
- Figure 19: Europe Self Service Boarding Gates Revenue Share (%), by Country 2025 & 2033
- Figure 20: Middle East & Africa Self Service Boarding Gates Revenue (undefined), by Application 2025 & 2033
- Figure 21: Middle East & Africa Self Service Boarding Gates Revenue Share (%), by Application 2025 & 2033
- Figure 22: Middle East & Africa Self Service Boarding Gates Revenue (undefined), by Types 2025 & 2033
- Figure 23: Middle East & Africa Self Service Boarding Gates Revenue Share (%), by Types 2025 & 2033
- Figure 24: Middle East & Africa Self Service Boarding Gates Revenue (undefined), by Country 2025 & 2033
- Figure 25: Middle East & Africa Self Service Boarding Gates Revenue Share (%), by Country 2025 & 2033
- Figure 26: Asia Pacific Self Service Boarding Gates Revenue (undefined), by Application 2025 & 2033
- Figure 27: Asia Pacific Self Service Boarding Gates Revenue Share (%), by Application 2025 & 2033
- Figure 28: Asia Pacific Self Service Boarding Gates Revenue (undefined), by Types 2025 & 2033
- Figure 29: Asia Pacific Self Service Boarding Gates Revenue Share (%), by Types 2025 & 2033
- Figure 30: Asia Pacific Self Service Boarding Gates Revenue (undefined), by Country 2025 & 2033
- Figure 31: Asia Pacific Self Service Boarding Gates Revenue Share (%), by Country 2025 & 2033
List of Tables
- Table 1: Global Self Service Boarding Gates Revenue undefined Forecast, by Application 2020 & 2033
- Table 2: Global Self Service Boarding Gates Revenue undefined Forecast, by Types 2020 & 2033
- Table 3: Global Self Service Boarding Gates Revenue undefined Forecast, by Region 2020 & 2033
- Table 4: Global Self Service Boarding Gates Revenue undefined Forecast, by Application 2020 & 2033
- Table 5: Global Self Service Boarding Gates Revenue undefined Forecast, by Types 2020 & 2033
- Table 6: Global Self Service Boarding Gates Revenue undefined Forecast, by Country 2020 & 2033
- Table 7: United States Self Service Boarding Gates Revenue (undefined) Forecast, by Application 2020 & 2033
- Table 8: Canada Self Service Boarding Gates Revenue (undefined) Forecast, by Application 2020 & 2033
- Table 9: Mexico Self Service Boarding Gates Revenue (undefined) Forecast, by Application 2020 & 2033
- Table 10: Global Self Service Boarding Gates Revenue undefined Forecast, by Application 2020 & 2033
- Table 11: Global Self Service Boarding Gates Revenue undefined Forecast, by Types 2020 & 2033
- Table 12: Global Self Service Boarding Gates Revenue undefined Forecast, by Country 2020 & 2033
- Table 13: Brazil Self Service Boarding Gates Revenue (undefined) Forecast, by Application 2020 & 2033
- Table 14: Argentina Self Service Boarding Gates Revenue (undefined) Forecast, by Application 2020 & 2033
- Table 15: Rest of South America Self Service Boarding Gates Revenue (undefined) Forecast, by Application 2020 & 2033
- Table 16: Global Self Service Boarding Gates Revenue undefined Forecast, by Application 2020 & 2033
- Table 17: Global Self Service Boarding Gates Revenue undefined Forecast, by Types 2020 & 2033
- Table 18: Global Self Service Boarding Gates Revenue undefined Forecast, by Country 2020 & 2033
- Table 19: United Kingdom Self Service Boarding Gates Revenue (undefined) Forecast, by Application 2020 & 2033
- Table 20: Germany Self Service Boarding Gates Revenue (undefined) Forecast, by Application 2020 & 2033
- Table 21: France Self Service Boarding Gates Revenue (undefined) Forecast, by Application 2020 & 2033
- Table 22: Italy Self Service Boarding Gates Revenue (undefined) Forecast, by Application 2020 & 2033
- Table 23: Spain Self Service Boarding Gates Revenue (undefined) Forecast, by Application 2020 & 2033
- Table 24: Russia Self Service Boarding Gates Revenue (undefined) Forecast, by Application 2020 & 2033
- Table 25: Benelux Self Service Boarding Gates Revenue (undefined) Forecast, by Application 2020 & 2033
- Table 26: Nordics Self Service Boarding Gates Revenue (undefined) Forecast, by Application 2020 & 2033
- Table 27: Rest of Europe Self Service Boarding Gates Revenue (undefined) Forecast, by Application 2020 & 2033
- Table 28: Global Self Service Boarding Gates Revenue undefined Forecast, by Application 2020 & 2033
- Table 29: Global Self Service Boarding Gates Revenue undefined Forecast, by Types 2020 & 2033
- Table 30: Global Self Service Boarding Gates Revenue undefined Forecast, by Country 2020 & 2033
- Table 31: Turkey Self Service Boarding Gates Revenue (undefined) Forecast, by Application 2020 & 2033
- Table 32: Israel Self Service Boarding Gates Revenue (undefined) Forecast, by Application 2020 & 2033
- Table 33: GCC Self Service Boarding Gates Revenue (undefined) Forecast, by Application 2020 & 2033
- Table 34: North Africa Self Service Boarding Gates Revenue (undefined) Forecast, by Application 2020 & 2033
- Table 35: South Africa Self Service Boarding Gates Revenue (undefined) Forecast, by Application 2020 & 2033
- Table 36: Rest of Middle East & Africa Self Service Boarding Gates Revenue (undefined) Forecast, by Application 2020 & 2033
- Table 37: Global Self Service Boarding Gates Revenue undefined Forecast, by Application 2020 & 2033
- Table 38: Global Self Service Boarding Gates Revenue undefined Forecast, by Types 2020 & 2033
- Table 39: Global Self Service Boarding Gates Revenue undefined Forecast, by Country 2020 & 2033
- Table 40: China Self Service Boarding Gates Revenue (undefined) Forecast, by Application 2020 & 2033
- Table 41: India Self Service Boarding Gates Revenue (undefined) Forecast, by Application 2020 & 2033
- Table 42: Japan Self Service Boarding Gates Revenue (undefined) Forecast, by Application 2020 & 2033
- Table 43: South Korea Self Service Boarding Gates Revenue (undefined) Forecast, by Application 2020 & 2033
- Table 44: ASEAN Self Service Boarding Gates Revenue (undefined) Forecast, by Application 2020 & 2033
- Table 45: Oceania Self Service Boarding Gates Revenue (undefined) Forecast, by Application 2020 & 2033
- Table 46: Rest of Asia Pacific Self Service Boarding Gates Revenue (undefined) Forecast, by Application 2020 & 2033
Frequently Asked Questions
1. What is the projected Compound Annual Growth Rate (CAGR) of the Self Service Boarding Gates?
The projected CAGR is approximately 4.81%.
2. Which companies are prominent players in the Self Service Boarding Gates?
Key companies in the market include Kaba Gallenschuetz, IER Blue Solutions, Gunnebo, Boon Edam, Magnetic Autocontrol, Materna ips, Emaratech, Wanzl.
3. What are the main segments of the Self Service Boarding Gates?
The market segments include Application, Types.
4. Can you provide details about the market size?
The market size is estimated to be USD XXX N/A as of 2022.
5. What are some drivers contributing to market growth?
N/A
6. What are the notable trends driving market growth?
N/A
7. Are there any restraints impacting market growth?
N/A
8. Can you provide examples of recent developments in the market?
N/A
9. What pricing options are available for accessing the report?
Pricing options include single-user, multi-user, and enterprise licenses priced at USD 4900.00, USD 7350.00, and USD 9800.00 respectively.
10. Is the market size provided in terms of value or volume?
The market size is provided in terms of value, measured in N/A.
11. Are there any specific market keywords associated with the report?
Yes, the market keyword associated with the report is "Self Service Boarding Gates," which aids in identifying and referencing the specific market segment covered.
12. How do I determine which pricing option suits my needs best?
The pricing options vary based on user requirements and access needs. Individual users may opt for single-user licenses, while businesses requiring broader access may choose multi-user or enterprise licenses for cost-effective access to the report.
13. Are there any additional resources or data provided in the Self Service Boarding Gates report?
While the report offers comprehensive insights, it's advisable to review the specific contents or supplementary materials provided to ascertain if additional resources or data are available.
14. How can I stay updated on further developments or reports in the Self Service Boarding Gates?
To stay informed about further developments, trends, and reports in the Self Service Boarding Gates, consider subscribing to industry newsletters, following relevant companies and organizations, or regularly checking reputable industry news sources and publications.
Methodology
Step 1 - Identification of Relevant Samples Size from Population Database


Step 2 - Approaches for Defining Global Market Size (Value, Volume* & Price*)

Note*: In applicable scenarios
Step 3 - Data Sources
Primary Research
- Web Analytics
- Survey Reports
- Research Institute
- Latest Research Reports
- Opinion Leaders
Secondary Research
- Annual Reports
- White Paper
- Latest Press Release
- Industry Association
- Paid Database
- Investor Presentations

Step 4 - Data Triangulation
Involves using different sources of information in order to increase the validity of a study
These sources are likely to be stakeholders in a program - participants, other researchers, program staff, other community members, and so on.
Then we put all data in single framework & apply various statistical tools to find out the dynamic on the market.
During the analysis stage, feedback from the stakeholder groups would be compared to determine areas of agreement as well as areas of divergence