

Key Insights
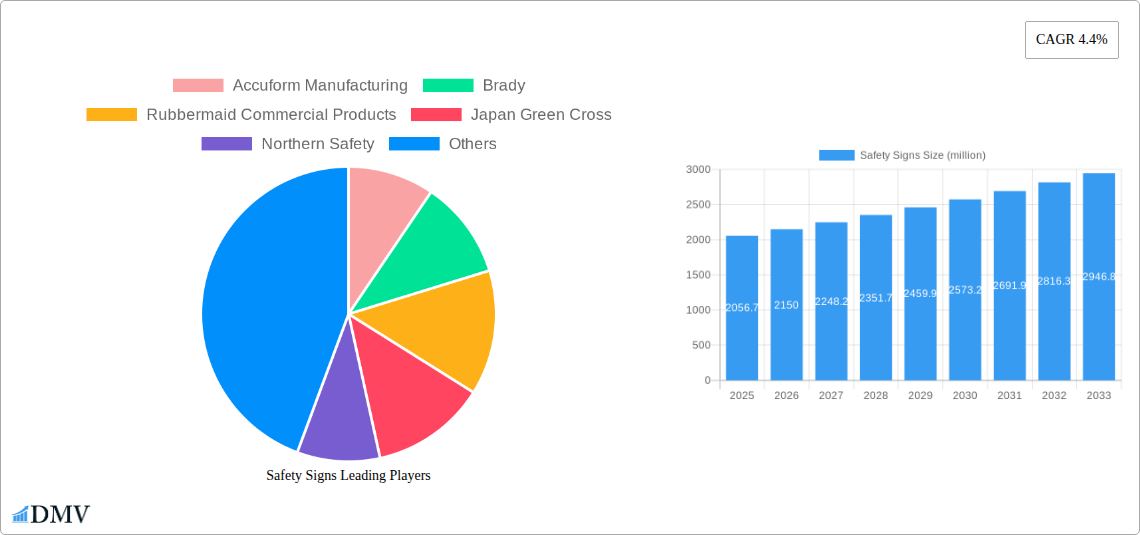
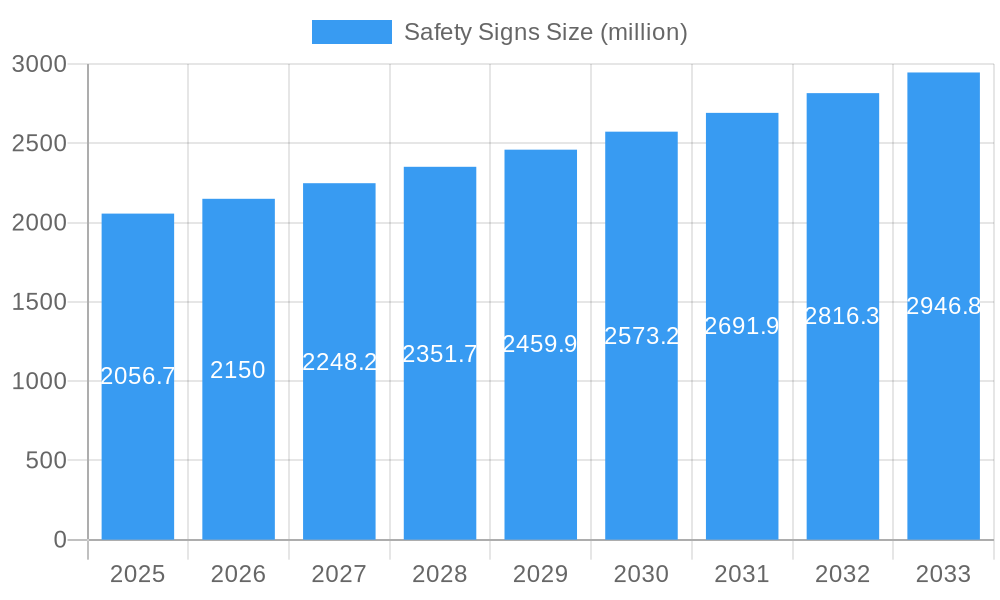
The global safety signs market, valued at $2056.7 million in 2025, is projected to experience robust growth, driven by increasing workplace safety regulations across various industries and heightened awareness of occupational hazards. A compound annual growth rate (CAGR) of 4.4% from 2025 to 2033 suggests a substantial market expansion, reaching an estimated value exceeding $3000 million by 2033. This growth is fueled by several key factors. The construction and manufacturing sectors, significant consumers of safety signs, are experiencing steady expansion globally, directly impacting demand. Furthermore, advancements in sign technology, such as the incorporation of high-visibility materials and enhanced durability, are contributing to market expansion. The rising adoption of smart safety solutions, including digitally enabled signs with real-time alerts, further strengthens market prospects. However, challenges such as high initial investment costs for advanced sign technologies and the presence of counterfeit products in certain regions could somewhat restrain growth.
Safety Signs Market Size (In Billion)
Major players like Accuform Manufacturing, Brady, and Rubbermaid Commercial Products are actively shaping the market through innovation and strategic expansion. The market is segmented based on factors such as material type (plastic, metal, etc.), sign type (warning, caution, prohibition), and application (industrial, construction, transportation). Regional analysis would indicate varied growth rates, with developed economies potentially showing more moderate growth compared to emerging markets exhibiting higher growth potential due to rapid industrialization and infrastructure development. The competitive landscape is characterized by both large multinational corporations and specialized regional players, resulting in diverse product offerings and pricing strategies to cater to specific market needs. This dynamic interplay of drivers, restraints, and competitive forces contributes to the overall market trajectory and presents both opportunities and challenges for existing and aspiring market participants.
Safety Signs Company Market Share
Safety Signs Market Report: A Comprehensive Analysis of a Multi-Million Dollar Industry (2019-2033)
This insightful report provides a comprehensive analysis of the global safety signs market, projecting a multi-million dollar valuation by 2033. The study covers historical data (2019-2024), the base year (2025), and offers a detailed forecast (2025-2033). We delve deep into market dynamics, identifying key players, growth drivers, and potential challenges, providing actionable intelligence for stakeholders across the value chain. Our analysis incorporates data from prominent players such as Accuform Manufacturing, Brady, Rubbermaid Commercial Products, and many more, offering a holistic view of this vital sector.
Safety Signs Market Composition & Trends
This section evaluates the competitive landscape, analyzing market concentration, innovation drivers, regulatory influences, substitute products, end-user segments, and mergers & acquisitions (M&A) activity within the safety signs market. The report leverages extensive primary and secondary research to determine market share distribution among key players. For instance, preliminary estimations suggest that the top five players – Accuform Manufacturing, Brady, Rubbermaid Commercial Products, Japan Green Cross, and Northern Safety – collectively hold approximately xx% of the market share in 2025. This section will quantify these metrics, including market share percentages and the total value of M&A deals (in millions of dollars) over the study period. It further investigates the impact of evolving regulatory standards on market dynamics and the emergence of substitute products, such as digital signage solutions. The analysis will include an in-depth study of end-user segments, including manufacturing, construction, healthcare, and transportation, to pinpoint areas of significant growth.
- Market Concentration: Analysis of market share held by top players (Accuform, Brady, etc.).
- Innovation Catalysts: Discussion of technological advancements driving market growth (e.g., smart signs, improved materials).
- Regulatory Landscape: Examination of global and regional safety regulations impacting market growth.
- Substitute Products: Assessment of alternative solutions and their impact on the safety signs market.
- End-User Profiles: Detailed analysis of end-user segments and their specific needs.
- M&A Activity: Overview of significant mergers and acquisitions within the industry, including deal values.
Safety Signs Industry Evolution
This section charts the evolution of the safety signs industry from 2019 to 2033. Analyzing market growth trajectories, technological innovations, and evolving consumer needs reveals key trends and patterns influencing market performance. The report will detail the impact of technological advancements, such as the increased use of retroreflective materials and the integration of smart technologies, on market growth and adoption rates. Specific data points, including compound annual growth rates (CAGR) for various segments and the adoption rates of new technologies, will be incorporated. The changing preferences of consumers toward eco-friendly and sustainable solutions will also be analyzed. We will explore how evolving safety regulations and changing consumer preferences, such as a heightened focus on workplace safety and sustainability, have shaped market growth. The analysis incorporates data on growth rates, adoption metrics, and consumer behavior trends.
Leading Regions, Countries, or Segments in Safety Signs
This section identifies the leading geographical regions, countries, or market segments within the safety signs market based on revenue generation and growth potential. The report analyzes factors driving the dominance of specific regions or segments. This will include a detailed assessment of investment trends, regulatory support, and market size, providing a comprehensive understanding of market leadership.
- Key Drivers for Dominant Regions/Segments:
- Stronger regulatory frameworks mandating safety signage.
- High infrastructure investments and ongoing construction activities.
- Increased awareness of workplace safety and risk mitigation strategies.
- Favorable economic conditions and increased industrial activity.
Safety Signs Product Innovations
This section examines innovative product offerings in the safety signs market. It discusses novel materials, enhanced visibility features, and the integration of smart technologies (e.g., connected sensors, data analytics). The analysis will include an examination of unique selling propositions (USPs) of new products and their impact on market competition. The report also highlights the applications of these innovative products across different industries.
Propelling Factors for Safety Signs Growth
This section identifies several key growth drivers that are significantly impacting the safety signs market expansion. Technological advancements in materials and manufacturing processes, combined with increased awareness of workplace safety regulations and their enforcement, are significant contributors. Economic factors, like infrastructural development in emerging economies, also influence market growth. The analysis includes the impact of favorable government policies and incentives promoting workplace safety.
Obstacles in the Safety Signs Market
This section identifies and analyzes the key restraints hindering the growth of the safety signs market. This includes challenges related to regulatory compliance, potential supply chain disruptions, and intense competition amongst various market players. Quantitative impacts of these challenges on the market will also be analyzed.
Future Opportunities in Safety Signs
This section highlights the promising opportunities expected to emerge in the safety signs market in the coming years. The report will delve into the expansion into new markets (e.g., developing economies), advancements in technology, and the emergence of new consumer preferences, such as increased demand for sustainable products and smart safety solutions.
Major Players in the Safety Signs Ecosystem
- Accuform Manufacturing
- Brady
- Rubbermaid Commercial Products
- Japan Green Cross
- Northern Safety
- Unit Safety Signs
- Big Beam Emergency Systems
- Ecoglo International
- ComplianceSigns
- Brimar Industries
- Tsukushi-Kobo
- National Marker Company
- Jalite
- EverGlow GmbH
- ZING Green Safety Products
- INCOM
- Viking Signs
- Axnoy Industries
Key Developments in Safety Signs Industry
- [Month/Year]: Launch of a new, highly visible safety sign material by [Company Name].
- [Month/Year]: Accuform Manufacturing acquired [Company Name], expanding its market reach. (XX million deal value)
- [Month/Year]: New regulations regarding workplace safety signs implemented in [Country/Region].
- [Month/Year]: Brady introduced a line of smart safety signs with integrated sensors.
Strategic Safety Signs Market Forecast
The safety signs market is poised for substantial growth over the forecast period (2025-2033), driven by several factors. Stringent safety regulations, ongoing infrastructure development, and the increasing adoption of smart safety solutions will create significant market opportunities. The market is expected to witness a healthy CAGR of xx% during the forecast period, reaching a value of xx million dollars by 2033. This growth will be particularly pronounced in developing economies and within specific high-growth industry segments.
Safety Signs Segmentation
-
1. Application
- 1.1. Industrial
- 1.2. Commercial
- 1.3. Residential
-
2. Types
- 2.1. Polymer
- 2.2. Metal
- 2.3. Fiberglass
Safety Signs Segmentation By Geography
-
1. North America
- 1.1. United States
- 1.2. Canada
- 1.3. Mexico
-
2. South America
- 2.1. Brazil
- 2.2. Argentina
- 2.3. Rest of South America
-
3. Europe
- 3.1. United Kingdom
- 3.2. Germany
- 3.3. France
- 3.4. Italy
- 3.5. Spain
- 3.6. Russia
- 3.7. Benelux
- 3.8. Nordics
- 3.9. Rest of Europe
-
4. Middle East & Africa
- 4.1. Turkey
- 4.2. Israel
- 4.3. GCC
- 4.4. North Africa
- 4.5. South Africa
- 4.6. Rest of Middle East & Africa
-
5. Asia Pacific
- 5.1. China
- 5.2. India
- 5.3. Japan
- 5.4. South Korea
- 5.5. ASEAN
- 5.6. Oceania
- 5.7. Rest of Asia Pacific
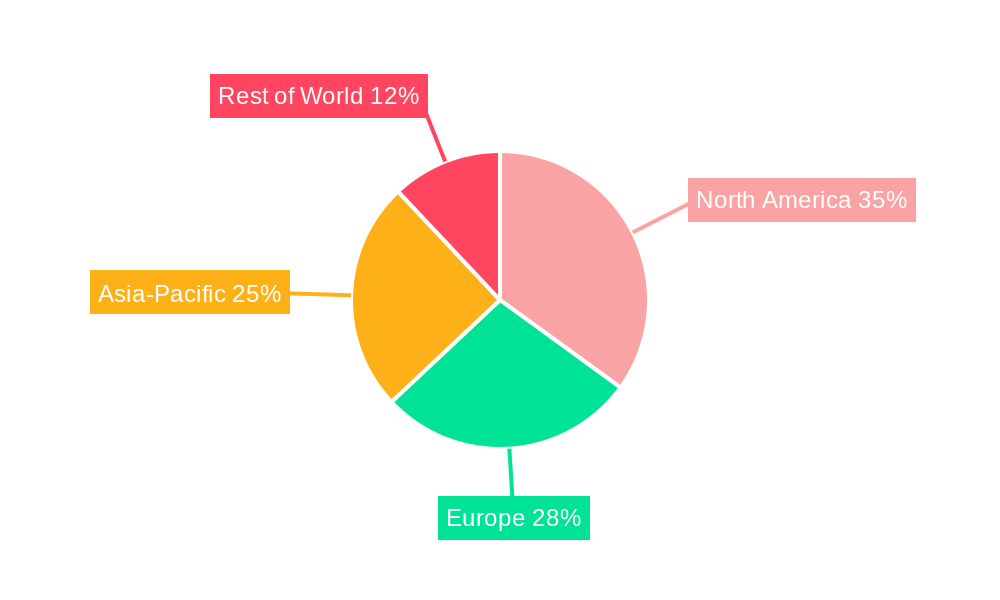
Safety Signs Regional Market Share
Geographic Coverage of Safety Signs
Safety Signs REPORT HIGHLIGHTS
| Aspects | Details |
|---|---|
| Study Period | 2020-2034 |
| Base Year | 2025 |
| Estimated Year | 2026 |
| Forecast Period | 2026-2034 |
| Historical Period | 2020-2025 |
| Growth Rate | CAGR of 4.4% from 2020-2034 |
| Segmentation |
|
Table of Contents
- 1. Introduction
- 1.1. Research Scope
- 1.2. Market Segmentation
- 1.3. Research Methodology
- 1.4. Definitions and Assumptions
- 2. Executive Summary
- 2.1. Introduction
- 3. Market Dynamics
- 3.1. Introduction
- 3.2. Market Drivers
- 3.3. Market Restrains
- 3.4. Market Trends
- 4. Market Factor Analysis
- 4.1. Porters Five Forces
- 4.2. Supply/Value Chain
- 4.3. PESTEL analysis
- 4.4. Market Entropy
- 4.5. Patent/Trademark Analysis
- 5. Global Safety Signs Analysis, Insights and Forecast, 2020-2032
- 5.1. Market Analysis, Insights and Forecast - by Application
- 5.1.1. Industrial
- 5.1.2. Commercial
- 5.1.3. Residential
- 5.2. Market Analysis, Insights and Forecast - by Types
- 5.2.1. Polymer
- 5.2.2. Metal
- 5.2.3. Fiberglass
- 5.3. Market Analysis, Insights and Forecast - by Region
- 5.3.1. North America
- 5.3.2. South America
- 5.3.3. Europe
- 5.3.4. Middle East & Africa
- 5.3.5. Asia Pacific
- 5.1. Market Analysis, Insights and Forecast - by Application
- 6. North America Safety Signs Analysis, Insights and Forecast, 2020-2032
- 6.1. Market Analysis, Insights and Forecast - by Application
- 6.1.1. Industrial
- 6.1.2. Commercial
- 6.1.3. Residential
- 6.2. Market Analysis, Insights and Forecast - by Types
- 6.2.1. Polymer
- 6.2.2. Metal
- 6.2.3. Fiberglass
- 6.1. Market Analysis, Insights and Forecast - by Application
- 7. South America Safety Signs Analysis, Insights and Forecast, 2020-2032
- 7.1. Market Analysis, Insights and Forecast - by Application
- 7.1.1. Industrial
- 7.1.2. Commercial
- 7.1.3. Residential
- 7.2. Market Analysis, Insights and Forecast - by Types
- 7.2.1. Polymer
- 7.2.2. Metal
- 7.2.3. Fiberglass
- 7.1. Market Analysis, Insights and Forecast - by Application
- 8. Europe Safety Signs Analysis, Insights and Forecast, 2020-2032
- 8.1. Market Analysis, Insights and Forecast - by Application
- 8.1.1. Industrial
- 8.1.2. Commercial
- 8.1.3. Residential
- 8.2. Market Analysis, Insights and Forecast - by Types
- 8.2.1. Polymer
- 8.2.2. Metal
- 8.2.3. Fiberglass
- 8.1. Market Analysis, Insights and Forecast - by Application
- 9. Middle East & Africa Safety Signs Analysis, Insights and Forecast, 2020-2032
- 9.1. Market Analysis, Insights and Forecast - by Application
- 9.1.1. Industrial
- 9.1.2. Commercial
- 9.1.3. Residential
- 9.2. Market Analysis, Insights and Forecast - by Types
- 9.2.1. Polymer
- 9.2.2. Metal
- 9.2.3. Fiberglass
- 9.1. Market Analysis, Insights and Forecast - by Application
- 10. Asia Pacific Safety Signs Analysis, Insights and Forecast, 2020-2032
- 10.1. Market Analysis, Insights and Forecast - by Application
- 10.1.1. Industrial
- 10.1.2. Commercial
- 10.1.3. Residential
- 10.2. Market Analysis, Insights and Forecast - by Types
- 10.2.1. Polymer
- 10.2.2. Metal
- 10.2.3. Fiberglass
- 10.1. Market Analysis, Insights and Forecast - by Application
- 11. Competitive Analysis
- 11.1. Global Market Share Analysis 2025
- 11.2. Company Profiles
- 11.2.1 Accuform Manufacturing
- 11.2.1.1. Overview
- 11.2.1.2. Products
- 11.2.1.3. SWOT Analysis
- 11.2.1.4. Recent Developments
- 11.2.1.5. Financials (Based on Availability)
- 11.2.2 Brady
- 11.2.2.1. Overview
- 11.2.2.2. Products
- 11.2.2.3. SWOT Analysis
- 11.2.2.4. Recent Developments
- 11.2.2.5. Financials (Based on Availability)
- 11.2.3 Rubbermaid Commercial Products
- 11.2.3.1. Overview
- 11.2.3.2. Products
- 11.2.3.3. SWOT Analysis
- 11.2.3.4. Recent Developments
- 11.2.3.5. Financials (Based on Availability)
- 11.2.4 Japan Green Cross
- 11.2.4.1. Overview
- 11.2.4.2. Products
- 11.2.4.3. SWOT Analysis
- 11.2.4.4. Recent Developments
- 11.2.4.5. Financials (Based on Availability)
- 11.2.5 Northern Safety
- 11.2.5.1. Overview
- 11.2.5.2. Products
- 11.2.5.3. SWOT Analysis
- 11.2.5.4. Recent Developments
- 11.2.5.5. Financials (Based on Availability)
- 11.2.6 Unit Safety Signs
- 11.2.6.1. Overview
- 11.2.6.2. Products
- 11.2.6.3. SWOT Analysis
- 11.2.6.4. Recent Developments
- 11.2.6.5. Financials (Based on Availability)
- 11.2.7 Big Beam Emergency Systems
- 11.2.7.1. Overview
- 11.2.7.2. Products
- 11.2.7.3. SWOT Analysis
- 11.2.7.4. Recent Developments
- 11.2.7.5. Financials (Based on Availability)
- 11.2.8 Ecoglo International
- 11.2.8.1. Overview
- 11.2.8.2. Products
- 11.2.8.3. SWOT Analysis
- 11.2.8.4. Recent Developments
- 11.2.8.5. Financials (Based on Availability)
- 11.2.9 ComplianceSigns
- 11.2.9.1. Overview
- 11.2.9.2. Products
- 11.2.9.3. SWOT Analysis
- 11.2.9.4. Recent Developments
- 11.2.9.5. Financials (Based on Availability)
- 11.2.10 Brimar Industries
- 11.2.10.1. Overview
- 11.2.10.2. Products
- 11.2.10.3. SWOT Analysis
- 11.2.10.4. Recent Developments
- 11.2.10.5. Financials (Based on Availability)
- 11.2.11 Tsukushi-Kobo
- 11.2.11.1. Overview
- 11.2.11.2. Products
- 11.2.11.3. SWOT Analysis
- 11.2.11.4. Recent Developments
- 11.2.11.5. Financials (Based on Availability)
- 11.2.12 National Marker Company
- 11.2.12.1. Overview
- 11.2.12.2. Products
- 11.2.12.3. SWOT Analysis
- 11.2.12.4. Recent Developments
- 11.2.12.5. Financials (Based on Availability)
- 11.2.13 Jalite
- 11.2.13.1. Overview
- 11.2.13.2. Products
- 11.2.13.3. SWOT Analysis
- 11.2.13.4. Recent Developments
- 11.2.13.5. Financials (Based on Availability)
- 11.2.14 EverGlow GmbH
- 11.2.14.1. Overview
- 11.2.14.2. Products
- 11.2.14.3. SWOT Analysis
- 11.2.14.4. Recent Developments
- 11.2.14.5. Financials (Based on Availability)
- 11.2.15 ZING Green Safety Products
- 11.2.15.1. Overview
- 11.2.15.2. Products
- 11.2.15.3. SWOT Analysis
- 11.2.15.4. Recent Developments
- 11.2.15.5. Financials (Based on Availability)
- 11.2.16 INCOM
- 11.2.16.1. Overview
- 11.2.16.2. Products
- 11.2.16.3. SWOT Analysis
- 11.2.16.4. Recent Developments
- 11.2.16.5. Financials (Based on Availability)
- 11.2.17 Viking Signs
- 11.2.17.1. Overview
- 11.2.17.2. Products
- 11.2.17.3. SWOT Analysis
- 11.2.17.4. Recent Developments
- 11.2.17.5. Financials (Based on Availability)
- 11.2.18 Axnoy Industries
- 11.2.18.1. Overview
- 11.2.18.2. Products
- 11.2.18.3. SWOT Analysis
- 11.2.18.4. Recent Developments
- 11.2.18.5. Financials (Based on Availability)
- 11.2.1 Accuform Manufacturing
List of Figures
- Figure 1: Global Safety Signs Revenue Breakdown (million, %) by Region 2025 & 2033
- Figure 2: North America Safety Signs Revenue (million), by Application 2025 & 2033
- Figure 3: North America Safety Signs Revenue Share (%), by Application 2025 & 2033
- Figure 4: North America Safety Signs Revenue (million), by Types 2025 & 2033
- Figure 5: North America Safety Signs Revenue Share (%), by Types 2025 & 2033
- Figure 6: North America Safety Signs Revenue (million), by Country 2025 & 2033
- Figure 7: North America Safety Signs Revenue Share (%), by Country 2025 & 2033
- Figure 8: South America Safety Signs Revenue (million), by Application 2025 & 2033
- Figure 9: South America Safety Signs Revenue Share (%), by Application 2025 & 2033
- Figure 10: South America Safety Signs Revenue (million), by Types 2025 & 2033
- Figure 11: South America Safety Signs Revenue Share (%), by Types 2025 & 2033
- Figure 12: South America Safety Signs Revenue (million), by Country 2025 & 2033
- Figure 13: South America Safety Signs Revenue Share (%), by Country 2025 & 2033
- Figure 14: Europe Safety Signs Revenue (million), by Application 2025 & 2033
- Figure 15: Europe Safety Signs Revenue Share (%), by Application 2025 & 2033
- Figure 16: Europe Safety Signs Revenue (million), by Types 2025 & 2033
- Figure 17: Europe Safety Signs Revenue Share (%), by Types 2025 & 2033
- Figure 18: Europe Safety Signs Revenue (million), by Country 2025 & 2033
- Figure 19: Europe Safety Signs Revenue Share (%), by Country 2025 & 2033
- Figure 20: Middle East & Africa Safety Signs Revenue (million), by Application 2025 & 2033
- Figure 21: Middle East & Africa Safety Signs Revenue Share (%), by Application 2025 & 2033
- Figure 22: Middle East & Africa Safety Signs Revenue (million), by Types 2025 & 2033
- Figure 23: Middle East & Africa Safety Signs Revenue Share (%), by Types 2025 & 2033
- Figure 24: Middle East & Africa Safety Signs Revenue (million), by Country 2025 & 2033
- Figure 25: Middle East & Africa Safety Signs Revenue Share (%), by Country 2025 & 2033
- Figure 26: Asia Pacific Safety Signs Revenue (million), by Application 2025 & 2033
- Figure 27: Asia Pacific Safety Signs Revenue Share (%), by Application 2025 & 2033
- Figure 28: Asia Pacific Safety Signs Revenue (million), by Types 2025 & 2033
- Figure 29: Asia Pacific Safety Signs Revenue Share (%), by Types 2025 & 2033
- Figure 30: Asia Pacific Safety Signs Revenue (million), by Country 2025 & 2033
- Figure 31: Asia Pacific Safety Signs Revenue Share (%), by Country 2025 & 2033
List of Tables
- Table 1: Global Safety Signs Revenue million Forecast, by Application 2020 & 2033
- Table 2: Global Safety Signs Revenue million Forecast, by Types 2020 & 2033
- Table 3: Global Safety Signs Revenue million Forecast, by Region 2020 & 2033
- Table 4: Global Safety Signs Revenue million Forecast, by Application 2020 & 2033
- Table 5: Global Safety Signs Revenue million Forecast, by Types 2020 & 2033
- Table 6: Global Safety Signs Revenue million Forecast, by Country 2020 & 2033
- Table 7: United States Safety Signs Revenue (million) Forecast, by Application 2020 & 2033
- Table 8: Canada Safety Signs Revenue (million) Forecast, by Application 2020 & 2033
- Table 9: Mexico Safety Signs Revenue (million) Forecast, by Application 2020 & 2033
- Table 10: Global Safety Signs Revenue million Forecast, by Application 2020 & 2033
- Table 11: Global Safety Signs Revenue million Forecast, by Types 2020 & 2033
- Table 12: Global Safety Signs Revenue million Forecast, by Country 2020 & 2033
- Table 13: Brazil Safety Signs Revenue (million) Forecast, by Application 2020 & 2033
- Table 14: Argentina Safety Signs Revenue (million) Forecast, by Application 2020 & 2033
- Table 15: Rest of South America Safety Signs Revenue (million) Forecast, by Application 2020 & 2033
- Table 16: Global Safety Signs Revenue million Forecast, by Application 2020 & 2033
- Table 17: Global Safety Signs Revenue million Forecast, by Types 2020 & 2033
- Table 18: Global Safety Signs Revenue million Forecast, by Country 2020 & 2033
- Table 19: United Kingdom Safety Signs Revenue (million) Forecast, by Application 2020 & 2033
- Table 20: Germany Safety Signs Revenue (million) Forecast, by Application 2020 & 2033
- Table 21: France Safety Signs Revenue (million) Forecast, by Application 2020 & 2033
- Table 22: Italy Safety Signs Revenue (million) Forecast, by Application 2020 & 2033
- Table 23: Spain Safety Signs Revenue (million) Forecast, by Application 2020 & 2033
- Table 24: Russia Safety Signs Revenue (million) Forecast, by Application 2020 & 2033
- Table 25: Benelux Safety Signs Revenue (million) Forecast, by Application 2020 & 2033
- Table 26: Nordics Safety Signs Revenue (million) Forecast, by Application 2020 & 2033
- Table 27: Rest of Europe Safety Signs Revenue (million) Forecast, by Application 2020 & 2033
- Table 28: Global Safety Signs Revenue million Forecast, by Application 2020 & 2033
- Table 29: Global Safety Signs Revenue million Forecast, by Types 2020 & 2033
- Table 30: Global Safety Signs Revenue million Forecast, by Country 2020 & 2033
- Table 31: Turkey Safety Signs Revenue (million) Forecast, by Application 2020 & 2033
- Table 32: Israel Safety Signs Revenue (million) Forecast, by Application 2020 & 2033
- Table 33: GCC Safety Signs Revenue (million) Forecast, by Application 2020 & 2033
- Table 34: North Africa Safety Signs Revenue (million) Forecast, by Application 2020 & 2033
- Table 35: South Africa Safety Signs Revenue (million) Forecast, by Application 2020 & 2033
- Table 36: Rest of Middle East & Africa Safety Signs Revenue (million) Forecast, by Application 2020 & 2033
- Table 37: Global Safety Signs Revenue million Forecast, by Application 2020 & 2033
- Table 38: Global Safety Signs Revenue million Forecast, by Types 2020 & 2033
- Table 39: Global Safety Signs Revenue million Forecast, by Country 2020 & 2033
- Table 40: China Safety Signs Revenue (million) Forecast, by Application 2020 & 2033
- Table 41: India Safety Signs Revenue (million) Forecast, by Application 2020 & 2033
- Table 42: Japan Safety Signs Revenue (million) Forecast, by Application 2020 & 2033
- Table 43: South Korea Safety Signs Revenue (million) Forecast, by Application 2020 & 2033
- Table 44: ASEAN Safety Signs Revenue (million) Forecast, by Application 2020 & 2033
- Table 45: Oceania Safety Signs Revenue (million) Forecast, by Application 2020 & 2033
- Table 46: Rest of Asia Pacific Safety Signs Revenue (million) Forecast, by Application 2020 & 2033
Frequently Asked Questions
1. What is the projected Compound Annual Growth Rate (CAGR) of the Safety Signs?
The projected CAGR is approximately 4.4%.
2. Which companies are prominent players in the Safety Signs?
Key companies in the market include Accuform Manufacturing, Brady, Rubbermaid Commercial Products, Japan Green Cross, Northern Safety, Unit Safety Signs, Big Beam Emergency Systems, Ecoglo International, ComplianceSigns, Brimar Industries, Tsukushi-Kobo, National Marker Company, Jalite, EverGlow GmbH, ZING Green Safety Products, INCOM, Viking Signs, Axnoy Industries.
3. What are the main segments of the Safety Signs?
The market segments include Application, Types.
4. Can you provide details about the market size?
The market size is estimated to be USD 2056.7 million as of 2022.
5. What are some drivers contributing to market growth?
N/A
6. What are the notable trends driving market growth?
N/A
7. Are there any restraints impacting market growth?
N/A
8. Can you provide examples of recent developments in the market?
N/A
9. What pricing options are available for accessing the report?
Pricing options include single-user, multi-user, and enterprise licenses priced at USD 5600.00, USD 8400.00, and USD 11200.00 respectively.
10. Is the market size provided in terms of value or volume?
The market size is provided in terms of value, measured in million.
11. Are there any specific market keywords associated with the report?
Yes, the market keyword associated with the report is "Safety Signs," which aids in identifying and referencing the specific market segment covered.
12. How do I determine which pricing option suits my needs best?
The pricing options vary based on user requirements and access needs. Individual users may opt for single-user licenses, while businesses requiring broader access may choose multi-user or enterprise licenses for cost-effective access to the report.
13. Are there any additional resources or data provided in the Safety Signs report?
While the report offers comprehensive insights, it's advisable to review the specific contents or supplementary materials provided to ascertain if additional resources or data are available.
14. How can I stay updated on further developments or reports in the Safety Signs?
To stay informed about further developments, trends, and reports in the Safety Signs, consider subscribing to industry newsletters, following relevant companies and organizations, or regularly checking reputable industry news sources and publications.
Methodology
Step 1 - Identification of Relevant Samples Size from Population Database


Step 2 - Approaches for Defining Global Market Size (Value, Volume* & Price*)

Note*: In applicable scenarios
Step 3 - Data Sources
Primary Research
- Web Analytics
- Survey Reports
- Research Institute
- Latest Research Reports
- Opinion Leaders
Secondary Research
- Annual Reports
- White Paper
- Latest Press Release
- Industry Association
- Paid Database
- Investor Presentations

Step 4 - Data Triangulation
Involves using different sources of information in order to increase the validity of a study
These sources are likely to be stakeholders in a program - participants, other researchers, program staff, other community members, and so on.
Then we put all data in single framework & apply various statistical tools to find out the dynamic on the market.
During the analysis stage, feedback from the stakeholder groups would be compared to determine areas of agreement as well as areas of divergence