

Key Insights
The mobile fuel cell market is experiencing robust growth, driven by the increasing demand for clean energy solutions in material handling, passenger vehicles, and backup power. Key growth drivers include stringent global emission regulations promoting cleaner transportation, the rising adoption of fuel cell electric vehicles (FCEVs) for their superior range and refueling speed compared to battery electric vehicles (BEVs), and technological advancements enhancing fuel cell efficiency, durability, and cost-effectiveness. Major industry players are significantly investing in research and development and expanding production capabilities to meet escalating demand. The market is segmented by vehicle type, fuel type, and geography. While high initial investment costs and limited hydrogen refueling infrastructure present challenges, government incentives and continuous technological breakthroughs are progressively overcoming these barriers. We project significant market expansion throughout the forecast period, with a projected CAGR of 6.42%, reaching a market size of 425.85 million by 2025.
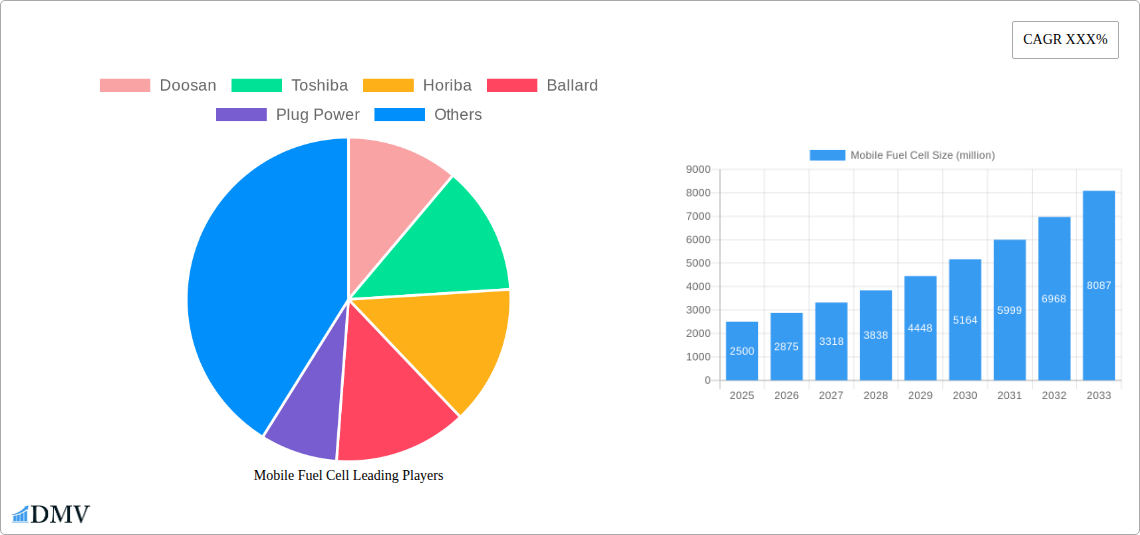
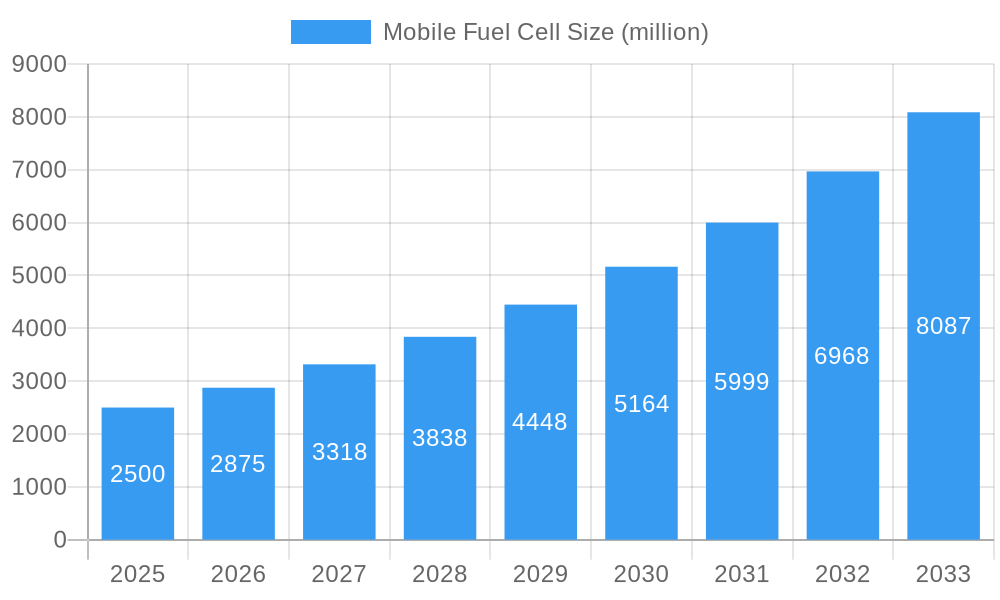
Mobile Fuel Cell Market Size (In Million)
Substantial opportunities exist across various market segments. The material handling sector currently dominates with growing adoption of fuel cell-powered forklifts in logistics. The passenger vehicle segment shows immense future growth potential as automotive manufacturers integrate fuel cell technology. North America and Europe lead the market due to strong government support and a focus on environmental sustainability. However, the Asia-Pacific region is poised for rapid growth driven by industrialization and government initiatives promoting clean energy. The competitive landscape features established automotive companies and specialized fuel cell technology providers. Strategic collaborations and mergers & acquisitions are anticipated to shape future market dynamics.
Mobile Fuel Cell Company Market Share
Mobile Fuel Cell Market Report: 2019-2033 - A Comprehensive Analysis
This in-depth report provides a comprehensive analysis of the global mobile fuel cell market, projecting a robust growth trajectory fueled by technological advancements and increasing environmental concerns. The study period covers 2019-2033, with a base year of 2025 and a forecast period spanning 2025-2033. We delve into market dynamics, key players, technological innovations, and future opportunities, offering invaluable insights for stakeholders across the value chain. The report utilizes data-driven analysis to illuminate market trends and provide actionable forecasts. Estimated market value reaches xx million by 2033.
Mobile Fuel Cell Market Composition & Trends
This section analyzes the competitive landscape, including market share distribution among key players like Doosan, Toshiba, Ballard, Plug Power, and Cummins. We explore the impact of mergers and acquisitions (M&A) activities, with deal values reaching xx million in recent years. Furthermore, we examine the influence of innovation catalysts such as government incentives and technological breakthroughs on market growth. The report also assesses the regulatory landscape, identifies substitute products, profiles end-users, and discusses the overall market concentration.
- Market Share Distribution (2025): Doosan (xx%), Ballard (xx%), Plug Power (xx%), Others (xx%). (Exact figures will be detailed in the full report)
- M&A Activity (2019-2024): Total deal value exceeding xx million USD, with key acquisitions outlined in detail within the report.
- Key Market Drivers: Stringent emission regulations, rising demand for clean energy solutions, and advancements in fuel cell technology.
- Regulatory Landscape: A detailed analysis of global and regional regulations impacting the mobile fuel cell market.
Mobile Fuel Cell Industry Evolution
This section details the historical and projected growth trajectories of the mobile fuel cell market. We analyze technological advancements, such as improvements in fuel cell efficiency and durability, and their impact on market adoption. The analysis incorporates detailed examination of shifting consumer demands, including the preference for cleaner and more sustainable energy sources. We present specific data points on growth rates and adoption metrics, demonstrating the market's evolution from 2019 to 2033. The compound annual growth rate (CAGR) is projected to be xx% during the forecast period (2025-2033), driven by factors such as increasing investment in research and development, and the growing adoption of mobile fuel cells in various applications.
Leading Regions, Countries, or Segments in Mobile Fuel Cell
This section identifies the leading region, country, or segment within the mobile fuel cell market based on market size, growth rate, and key drivers. In-depth analysis will explore factors contributing to the dominance of this leading region/segment.
- Key Drivers (Leading Region/Segment):
- Robust government support through subsidies and tax incentives.
- High investment in research and development initiatives.
- Favourable regulatory environment encouraging the adoption of clean energy technologies.
- Strong presence of key industry players and established supply chains.
The dominance of this leading region/segment is a result of a confluence of factors including strong government support, substantial investments in R&D, favorable regulatory frameworks, and a robust infrastructure. This section provides a granular analysis of these factors and their synergistic effect in driving market growth.
Mobile Fuel Cell Product Innovations
Recent innovations in mobile fuel cell technology focus on enhancing efficiency, durability, and cost-effectiveness. New materials and designs are improving power density and lifespan, broadening the range of applications. Unique selling propositions include improved fuel efficiency, reduced emissions, and extended operational life compared to traditional power sources. The integration of advanced control systems and smart technologies also plays a crucial role in enhancing the performance and reliability of mobile fuel cells.
Propelling Factors for Mobile Fuel Cell Growth
Several factors contribute to the anticipated growth of the mobile fuel cell market. Technological advancements, resulting in higher efficiency and lower costs, are a primary driver. Furthermore, increasing government regulations aimed at reducing emissions and promoting clean energy are compelling adoption. Economic incentives, such as tax credits and subsidies, are also stimulating market growth.
Obstacles in the Mobile Fuel Cell Market
Despite promising growth prospects, several challenges hinder the widespread adoption of mobile fuel cells. High initial costs compared to conventional power sources represent a significant barrier. Supply chain vulnerabilities and potential disruptions pose risks. Furthermore, intense competition from established players in the energy sector necessitates strategic innovation and effective market penetration strategies.
Future Opportunities in Mobile Fuel Cell
Future opportunities lie in expanding applications across diverse sectors, including transportation, material handling, and backup power. Emerging technologies like solid-oxide fuel cells offer significant potential for enhanced performance. Moreover, the integration of mobile fuel cells into smart grids and microgrids presents promising avenues for growth. Growing interest in decarbonization and sustainability within various industries will further fuel market expansion.
Major Players in the Mobile Fuel Cell Ecosystem
- Doosan
- Toshiba
- Horiba
- Ballard
- Plug Power
- Cummins
- Toyota
- Elring Klinger
- Bosch/Powercell
- Symbio
- Intelligent Energy Limited
- Horizon Fuel Cell Technologies
- Air Liquide
- Advent Technologies
- Nuvera
- Sunrise Power
- REFIRE
- Sinosynergy
- SinoHytec
- Pearl Hydrogen
Key Developments in Mobile Fuel Cell Industry
- [Month, Year]: Company X launches a new mobile fuel cell with improved efficiency.
- [Month, Year]: Government Y announces new funding for mobile fuel cell research and development.
- [Month, Year]: Company A and Company B announce a strategic partnership to expand their mobile fuel cell offerings. (Specific details of these and other developments will be provided in the full report.)
Strategic Mobile Fuel Cell Market Forecast
The mobile fuel cell market is poised for substantial growth, driven by a confluence of factors including technological advancements, stringent environmental regulations, and increasing investments in clean energy solutions. The market is expected to experience a significant expansion in the coming years, with new applications emerging across diverse sectors. This growth trajectory will be further fueled by ongoing innovations, leading to improved efficiency, reduced costs, and wider market penetration.
Mobile Fuel Cell Segmentation
-
1. Application
- 1.1. Automotive
- 1.2. Ship
- 1.3. Drone
- 1.4. Mobile Power Supply
- 1.5. Other
-
2. Type
- 2.1. Below 50 kW
- 2.2. 50-100 kW
- 2.3. 100-200 kW
- 2.4. 200-300 kW
- 2.5. More than 300 kW
Mobile Fuel Cell Segmentation By Geography
-
1. North America
- 1.1. United States
- 1.2. Canada
- 1.3. Mexico
-
2. South America
- 2.1. Brazil
- 2.2. Argentina
- 2.3. Rest of South America
-
3. Europe
- 3.1. United Kingdom
- 3.2. Germany
- 3.3. France
- 3.4. Italy
- 3.5. Spain
- 3.6. Russia
- 3.7. Benelux
- 3.8. Nordics
- 3.9. Rest of Europe
-
4. Middle East & Africa
- 4.1. Turkey
- 4.2. Israel
- 4.3. GCC
- 4.4. North Africa
- 4.5. South Africa
- 4.6. Rest of Middle East & Africa
-
5. Asia Pacific
- 5.1. China
- 5.2. India
- 5.3. Japan
- 5.4. South Korea
- 5.5. ASEAN
- 5.6. Oceania
- 5.7. Rest of Asia Pacific

Mobile Fuel Cell Regional Market Share
Geographic Coverage of Mobile Fuel Cell
Mobile Fuel Cell REPORT HIGHLIGHTS
| Aspects | Details |
|---|---|
| Study Period | 2020-2034 |
| Base Year | 2025 |
| Estimated Year | 2026 |
| Forecast Period | 2026-2034 |
| Historical Period | 2020-2025 |
| Growth Rate | CAGR of 6.42% from 2020-2034 |
| Segmentation |
|
Table of Contents
- 1. Introduction
- 1.1. Research Scope
- 1.2. Market Segmentation
- 1.3. Research Methodology
- 1.4. Definitions and Assumptions
- 2. Executive Summary
- 2.1. Introduction
- 3. Market Dynamics
- 3.1. Introduction
- 3.2. Market Drivers
- 3.3. Market Restrains
- 3.4. Market Trends
- 4. Market Factor Analysis
- 4.1. Porters Five Forces
- 4.2. Supply/Value Chain
- 4.3. PESTEL analysis
- 4.4. Market Entropy
- 4.5. Patent/Trademark Analysis
- 5. Global Mobile Fuel Cell Analysis, Insights and Forecast, 2020-2032
- 5.1. Market Analysis, Insights and Forecast - by Application
- 5.1.1. Automotive
- 5.1.2. Ship
- 5.1.3. Drone
- 5.1.4. Mobile Power Supply
- 5.1.5. Other
- 5.2. Market Analysis, Insights and Forecast - by Type
- 5.2.1. Below 50 kW
- 5.2.2. 50-100 kW
- 5.2.3. 100-200 kW
- 5.2.4. 200-300 kW
- 5.2.5. More than 300 kW
- 5.3. Market Analysis, Insights and Forecast - by Region
- 5.3.1. North America
- 5.3.2. South America
- 5.3.3. Europe
- 5.3.4. Middle East & Africa
- 5.3.5. Asia Pacific
- 5.1. Market Analysis, Insights and Forecast - by Application
- 6. North America Mobile Fuel Cell Analysis, Insights and Forecast, 2020-2032
- 6.1. Market Analysis, Insights and Forecast - by Application
- 6.1.1. Automotive
- 6.1.2. Ship
- 6.1.3. Drone
- 6.1.4. Mobile Power Supply
- 6.1.5. Other
- 6.2. Market Analysis, Insights and Forecast - by Type
- 6.2.1. Below 50 kW
- 6.2.2. 50-100 kW
- 6.2.3. 100-200 kW
- 6.2.4. 200-300 kW
- 6.2.5. More than 300 kW
- 6.1. Market Analysis, Insights and Forecast - by Application
- 7. South America Mobile Fuel Cell Analysis, Insights and Forecast, 2020-2032
- 7.1. Market Analysis, Insights and Forecast - by Application
- 7.1.1. Automotive
- 7.1.2. Ship
- 7.1.3. Drone
- 7.1.4. Mobile Power Supply
- 7.1.5. Other
- 7.2. Market Analysis, Insights and Forecast - by Type
- 7.2.1. Below 50 kW
- 7.2.2. 50-100 kW
- 7.2.3. 100-200 kW
- 7.2.4. 200-300 kW
- 7.2.5. More than 300 kW
- 7.1. Market Analysis, Insights and Forecast - by Application
- 8. Europe Mobile Fuel Cell Analysis, Insights and Forecast, 2020-2032
- 8.1. Market Analysis, Insights and Forecast - by Application
- 8.1.1. Automotive
- 8.1.2. Ship
- 8.1.3. Drone
- 8.1.4. Mobile Power Supply
- 8.1.5. Other
- 8.2. Market Analysis, Insights and Forecast - by Type
- 8.2.1. Below 50 kW
- 8.2.2. 50-100 kW
- 8.2.3. 100-200 kW
- 8.2.4. 200-300 kW
- 8.2.5. More than 300 kW
- 8.1. Market Analysis, Insights and Forecast - by Application
- 9. Middle East & Africa Mobile Fuel Cell Analysis, Insights and Forecast, 2020-2032
- 9.1. Market Analysis, Insights and Forecast - by Application
- 9.1.1. Automotive
- 9.1.2. Ship
- 9.1.3. Drone
- 9.1.4. Mobile Power Supply
- 9.1.5. Other
- 9.2. Market Analysis, Insights and Forecast - by Type
- 9.2.1. Below 50 kW
- 9.2.2. 50-100 kW
- 9.2.3. 100-200 kW
- 9.2.4. 200-300 kW
- 9.2.5. More than 300 kW
- 9.1. Market Analysis, Insights and Forecast - by Application
- 10. Asia Pacific Mobile Fuel Cell Analysis, Insights and Forecast, 2020-2032
- 10.1. Market Analysis, Insights and Forecast - by Application
- 10.1.1. Automotive
- 10.1.2. Ship
- 10.1.3. Drone
- 10.1.4. Mobile Power Supply
- 10.1.5. Other
- 10.2. Market Analysis, Insights and Forecast - by Type
- 10.2.1. Below 50 kW
- 10.2.2. 50-100 kW
- 10.2.3. 100-200 kW
- 10.2.4. 200-300 kW
- 10.2.5. More than 300 kW
- 10.1. Market Analysis, Insights and Forecast - by Application
- 11. Competitive Analysis
- 11.1. Global Market Share Analysis 2025
- 11.2. Company Profiles
- 11.2.1 Doosan
- 11.2.1.1. Overview
- 11.2.1.2. Products
- 11.2.1.3. SWOT Analysis
- 11.2.1.4. Recent Developments
- 11.2.1.5. Financials (Based on Availability)
- 11.2.2 Toshiba
- 11.2.2.1. Overview
- 11.2.2.2. Products
- 11.2.2.3. SWOT Analysis
- 11.2.2.4. Recent Developments
- 11.2.2.5. Financials (Based on Availability)
- 11.2.3 Horiba
- 11.2.3.1. Overview
- 11.2.3.2. Products
- 11.2.3.3. SWOT Analysis
- 11.2.3.4. Recent Developments
- 11.2.3.5. Financials (Based on Availability)
- 11.2.4 Ballard
- 11.2.4.1. Overview
- 11.2.4.2. Products
- 11.2.4.3. SWOT Analysis
- 11.2.4.4. Recent Developments
- 11.2.4.5. Financials (Based on Availability)
- 11.2.5 Plug Power
- 11.2.5.1. Overview
- 11.2.5.2. Products
- 11.2.5.3. SWOT Analysis
- 11.2.5.4. Recent Developments
- 11.2.5.5. Financials (Based on Availability)
- 11.2.6 Cummins
- 11.2.6.1. Overview
- 11.2.6.2. Products
- 11.2.6.3. SWOT Analysis
- 11.2.6.4. Recent Developments
- 11.2.6.5. Financials (Based on Availability)
- 11.2.7 Toyota
- 11.2.7.1. Overview
- 11.2.7.2. Products
- 11.2.7.3. SWOT Analysis
- 11.2.7.4. Recent Developments
- 11.2.7.5. Financials (Based on Availability)
- 11.2.8 Elring Klinger
- 11.2.8.1. Overview
- 11.2.8.2. Products
- 11.2.8.3. SWOT Analysis
- 11.2.8.4. Recent Developments
- 11.2.8.5. Financials (Based on Availability)
- 11.2.9 Bosch/Powercell
- 11.2.9.1. Overview
- 11.2.9.2. Products
- 11.2.9.3. SWOT Analysis
- 11.2.9.4. Recent Developments
- 11.2.9.5. Financials (Based on Availability)
- 11.2.10 Symbio
- 11.2.10.1. Overview
- 11.2.10.2. Products
- 11.2.10.3. SWOT Analysis
- 11.2.10.4. Recent Developments
- 11.2.10.5. Financials (Based on Availability)
- 11.2.11 Intelligent Energy Limited
- 11.2.11.1. Overview
- 11.2.11.2. Products
- 11.2.11.3. SWOT Analysis
- 11.2.11.4. Recent Developments
- 11.2.11.5. Financials (Based on Availability)
- 11.2.12 Horizon Fuel Cell Technologies
- 11.2.12.1. Overview
- 11.2.12.2. Products
- 11.2.12.3. SWOT Analysis
- 11.2.12.4. Recent Developments
- 11.2.12.5. Financials (Based on Availability)
- 11.2.13 Air Liquide
- 11.2.13.1. Overview
- 11.2.13.2. Products
- 11.2.13.3. SWOT Analysis
- 11.2.13.4. Recent Developments
- 11.2.13.5. Financials (Based on Availability)
- 11.2.14 Advent Technologies
- 11.2.14.1. Overview
- 11.2.14.2. Products
- 11.2.14.3. SWOT Analysis
- 11.2.14.4. Recent Developments
- 11.2.14.5. Financials (Based on Availability)
- 11.2.15 Nuvera
- 11.2.15.1. Overview
- 11.2.15.2. Products
- 11.2.15.3. SWOT Analysis
- 11.2.15.4. Recent Developments
- 11.2.15.5. Financials (Based on Availability)
- 11.2.16 Sunrise Power
- 11.2.16.1. Overview
- 11.2.16.2. Products
- 11.2.16.3. SWOT Analysis
- 11.2.16.4. Recent Developments
- 11.2.16.5. Financials (Based on Availability)
- 11.2.17 REFIRE
- 11.2.17.1. Overview
- 11.2.17.2. Products
- 11.2.17.3. SWOT Analysis
- 11.2.17.4. Recent Developments
- 11.2.17.5. Financials (Based on Availability)
- 11.2.18 Sinosynergy
- 11.2.18.1. Overview
- 11.2.18.2. Products
- 11.2.18.3. SWOT Analysis
- 11.2.18.4. Recent Developments
- 11.2.18.5. Financials (Based on Availability)
- 11.2.19 SinoHytec
- 11.2.19.1. Overview
- 11.2.19.2. Products
- 11.2.19.3. SWOT Analysis
- 11.2.19.4. Recent Developments
- 11.2.19.5. Financials (Based on Availability)
- 11.2.20 Pearl Hydrogen
- 11.2.20.1. Overview
- 11.2.20.2. Products
- 11.2.20.3. SWOT Analysis
- 11.2.20.4. Recent Developments
- 11.2.20.5. Financials (Based on Availability)
- 11.2.1 Doosan
List of Figures
- Figure 1: Global Mobile Fuel Cell Revenue Breakdown (million, %) by Region 2025 & 2033
- Figure 2: Global Mobile Fuel Cell Volume Breakdown (K, %) by Region 2025 & 2033
- Figure 3: North America Mobile Fuel Cell Revenue (million), by Application 2025 & 2033
- Figure 4: North America Mobile Fuel Cell Volume (K), by Application 2025 & 2033
- Figure 5: North America Mobile Fuel Cell Revenue Share (%), by Application 2025 & 2033
- Figure 6: North America Mobile Fuel Cell Volume Share (%), by Application 2025 & 2033
- Figure 7: North America Mobile Fuel Cell Revenue (million), by Type 2025 & 2033
- Figure 8: North America Mobile Fuel Cell Volume (K), by Type 2025 & 2033
- Figure 9: North America Mobile Fuel Cell Revenue Share (%), by Type 2025 & 2033
- Figure 10: North America Mobile Fuel Cell Volume Share (%), by Type 2025 & 2033
- Figure 11: North America Mobile Fuel Cell Revenue (million), by Country 2025 & 2033
- Figure 12: North America Mobile Fuel Cell Volume (K), by Country 2025 & 2033
- Figure 13: North America Mobile Fuel Cell Revenue Share (%), by Country 2025 & 2033
- Figure 14: North America Mobile Fuel Cell Volume Share (%), by Country 2025 & 2033
- Figure 15: South America Mobile Fuel Cell Revenue (million), by Application 2025 & 2033
- Figure 16: South America Mobile Fuel Cell Volume (K), by Application 2025 & 2033
- Figure 17: South America Mobile Fuel Cell Revenue Share (%), by Application 2025 & 2033
- Figure 18: South America Mobile Fuel Cell Volume Share (%), by Application 2025 & 2033
- Figure 19: South America Mobile Fuel Cell Revenue (million), by Type 2025 & 2033
- Figure 20: South America Mobile Fuel Cell Volume (K), by Type 2025 & 2033
- Figure 21: South America Mobile Fuel Cell Revenue Share (%), by Type 2025 & 2033
- Figure 22: South America Mobile Fuel Cell Volume Share (%), by Type 2025 & 2033
- Figure 23: South America Mobile Fuel Cell Revenue (million), by Country 2025 & 2033
- Figure 24: South America Mobile Fuel Cell Volume (K), by Country 2025 & 2033
- Figure 25: South America Mobile Fuel Cell Revenue Share (%), by Country 2025 & 2033
- Figure 26: South America Mobile Fuel Cell Volume Share (%), by Country 2025 & 2033
- Figure 27: Europe Mobile Fuel Cell Revenue (million), by Application 2025 & 2033
- Figure 28: Europe Mobile Fuel Cell Volume (K), by Application 2025 & 2033
- Figure 29: Europe Mobile Fuel Cell Revenue Share (%), by Application 2025 & 2033
- Figure 30: Europe Mobile Fuel Cell Volume Share (%), by Application 2025 & 2033
- Figure 31: Europe Mobile Fuel Cell Revenue (million), by Type 2025 & 2033
- Figure 32: Europe Mobile Fuel Cell Volume (K), by Type 2025 & 2033
- Figure 33: Europe Mobile Fuel Cell Revenue Share (%), by Type 2025 & 2033
- Figure 34: Europe Mobile Fuel Cell Volume Share (%), by Type 2025 & 2033
- Figure 35: Europe Mobile Fuel Cell Revenue (million), by Country 2025 & 2033
- Figure 36: Europe Mobile Fuel Cell Volume (K), by Country 2025 & 2033
- Figure 37: Europe Mobile Fuel Cell Revenue Share (%), by Country 2025 & 2033
- Figure 38: Europe Mobile Fuel Cell Volume Share (%), by Country 2025 & 2033
- Figure 39: Middle East & Africa Mobile Fuel Cell Revenue (million), by Application 2025 & 2033
- Figure 40: Middle East & Africa Mobile Fuel Cell Volume (K), by Application 2025 & 2033
- Figure 41: Middle East & Africa Mobile Fuel Cell Revenue Share (%), by Application 2025 & 2033
- Figure 42: Middle East & Africa Mobile Fuel Cell Volume Share (%), by Application 2025 & 2033
- Figure 43: Middle East & Africa Mobile Fuel Cell Revenue (million), by Type 2025 & 2033
- Figure 44: Middle East & Africa Mobile Fuel Cell Volume (K), by Type 2025 & 2033
- Figure 45: Middle East & Africa Mobile Fuel Cell Revenue Share (%), by Type 2025 & 2033
- Figure 46: Middle East & Africa Mobile Fuel Cell Volume Share (%), by Type 2025 & 2033
- Figure 47: Middle East & Africa Mobile Fuel Cell Revenue (million), by Country 2025 & 2033
- Figure 48: Middle East & Africa Mobile Fuel Cell Volume (K), by Country 2025 & 2033
- Figure 49: Middle East & Africa Mobile Fuel Cell Revenue Share (%), by Country 2025 & 2033
- Figure 50: Middle East & Africa Mobile Fuel Cell Volume Share (%), by Country 2025 & 2033
- Figure 51: Asia Pacific Mobile Fuel Cell Revenue (million), by Application 2025 & 2033
- Figure 52: Asia Pacific Mobile Fuel Cell Volume (K), by Application 2025 & 2033
- Figure 53: Asia Pacific Mobile Fuel Cell Revenue Share (%), by Application 2025 & 2033
- Figure 54: Asia Pacific Mobile Fuel Cell Volume Share (%), by Application 2025 & 2033
- Figure 55: Asia Pacific Mobile Fuel Cell Revenue (million), by Type 2025 & 2033
- Figure 56: Asia Pacific Mobile Fuel Cell Volume (K), by Type 2025 & 2033
- Figure 57: Asia Pacific Mobile Fuel Cell Revenue Share (%), by Type 2025 & 2033
- Figure 58: Asia Pacific Mobile Fuel Cell Volume Share (%), by Type 2025 & 2033
- Figure 59: Asia Pacific Mobile Fuel Cell Revenue (million), by Country 2025 & 2033
- Figure 60: Asia Pacific Mobile Fuel Cell Volume (K), by Country 2025 & 2033
- Figure 61: Asia Pacific Mobile Fuel Cell Revenue Share (%), by Country 2025 & 2033
- Figure 62: Asia Pacific Mobile Fuel Cell Volume Share (%), by Country 2025 & 2033
List of Tables
- Table 1: Global Mobile Fuel Cell Revenue million Forecast, by Application 2020 & 2033
- Table 2: Global Mobile Fuel Cell Volume K Forecast, by Application 2020 & 2033
- Table 3: Global Mobile Fuel Cell Revenue million Forecast, by Type 2020 & 2033
- Table 4: Global Mobile Fuel Cell Volume K Forecast, by Type 2020 & 2033
- Table 5: Global Mobile Fuel Cell Revenue million Forecast, by Region 2020 & 2033
- Table 6: Global Mobile Fuel Cell Volume K Forecast, by Region 2020 & 2033
- Table 7: Global Mobile Fuel Cell Revenue million Forecast, by Application 2020 & 2033
- Table 8: Global Mobile Fuel Cell Volume K Forecast, by Application 2020 & 2033
- Table 9: Global Mobile Fuel Cell Revenue million Forecast, by Type 2020 & 2033
- Table 10: Global Mobile Fuel Cell Volume K Forecast, by Type 2020 & 2033
- Table 11: Global Mobile Fuel Cell Revenue million Forecast, by Country 2020 & 2033
- Table 12: Global Mobile Fuel Cell Volume K Forecast, by Country 2020 & 2033
- Table 13: United States Mobile Fuel Cell Revenue (million) Forecast, by Application 2020 & 2033
- Table 14: United States Mobile Fuel Cell Volume (K) Forecast, by Application 2020 & 2033
- Table 15: Canada Mobile Fuel Cell Revenue (million) Forecast, by Application 2020 & 2033
- Table 16: Canada Mobile Fuel Cell Volume (K) Forecast, by Application 2020 & 2033
- Table 17: Mexico Mobile Fuel Cell Revenue (million) Forecast, by Application 2020 & 2033
- Table 18: Mexico Mobile Fuel Cell Volume (K) Forecast, by Application 2020 & 2033
- Table 19: Global Mobile Fuel Cell Revenue million Forecast, by Application 2020 & 2033
- Table 20: Global Mobile Fuel Cell Volume K Forecast, by Application 2020 & 2033
- Table 21: Global Mobile Fuel Cell Revenue million Forecast, by Type 2020 & 2033
- Table 22: Global Mobile Fuel Cell Volume K Forecast, by Type 2020 & 2033
- Table 23: Global Mobile Fuel Cell Revenue million Forecast, by Country 2020 & 2033
- Table 24: Global Mobile Fuel Cell Volume K Forecast, by Country 2020 & 2033
- Table 25: Brazil Mobile Fuel Cell Revenue (million) Forecast, by Application 2020 & 2033
- Table 26: Brazil Mobile Fuel Cell Volume (K) Forecast, by Application 2020 & 2033
- Table 27: Argentina Mobile Fuel Cell Revenue (million) Forecast, by Application 2020 & 2033
- Table 28: Argentina Mobile Fuel Cell Volume (K) Forecast, by Application 2020 & 2033
- Table 29: Rest of South America Mobile Fuel Cell Revenue (million) Forecast, by Application 2020 & 2033
- Table 30: Rest of South America Mobile Fuel Cell Volume (K) Forecast, by Application 2020 & 2033
- Table 31: Global Mobile Fuel Cell Revenue million Forecast, by Application 2020 & 2033
- Table 32: Global Mobile Fuel Cell Volume K Forecast, by Application 2020 & 2033
- Table 33: Global Mobile Fuel Cell Revenue million Forecast, by Type 2020 & 2033
- Table 34: Global Mobile Fuel Cell Volume K Forecast, by Type 2020 & 2033
- Table 35: Global Mobile Fuel Cell Revenue million Forecast, by Country 2020 & 2033
- Table 36: Global Mobile Fuel Cell Volume K Forecast, by Country 2020 & 2033
- Table 37: United Kingdom Mobile Fuel Cell Revenue (million) Forecast, by Application 2020 & 2033
- Table 38: United Kingdom Mobile Fuel Cell Volume (K) Forecast, by Application 2020 & 2033
- Table 39: Germany Mobile Fuel Cell Revenue (million) Forecast, by Application 2020 & 2033
- Table 40: Germany Mobile Fuel Cell Volume (K) Forecast, by Application 2020 & 2033
- Table 41: France Mobile Fuel Cell Revenue (million) Forecast, by Application 2020 & 2033
- Table 42: France Mobile Fuel Cell Volume (K) Forecast, by Application 2020 & 2033
- Table 43: Italy Mobile Fuel Cell Revenue (million) Forecast, by Application 2020 & 2033
- Table 44: Italy Mobile Fuel Cell Volume (K) Forecast, by Application 2020 & 2033
- Table 45: Spain Mobile Fuel Cell Revenue (million) Forecast, by Application 2020 & 2033
- Table 46: Spain Mobile Fuel Cell Volume (K) Forecast, by Application 2020 & 2033
- Table 47: Russia Mobile Fuel Cell Revenue (million) Forecast, by Application 2020 & 2033
- Table 48: Russia Mobile Fuel Cell Volume (K) Forecast, by Application 2020 & 2033
- Table 49: Benelux Mobile Fuel Cell Revenue (million) Forecast, by Application 2020 & 2033
- Table 50: Benelux Mobile Fuel Cell Volume (K) Forecast, by Application 2020 & 2033
- Table 51: Nordics Mobile Fuel Cell Revenue (million) Forecast, by Application 2020 & 2033
- Table 52: Nordics Mobile Fuel Cell Volume (K) Forecast, by Application 2020 & 2033
- Table 53: Rest of Europe Mobile Fuel Cell Revenue (million) Forecast, by Application 2020 & 2033
- Table 54: Rest of Europe Mobile Fuel Cell Volume (K) Forecast, by Application 2020 & 2033
- Table 55: Global Mobile Fuel Cell Revenue million Forecast, by Application 2020 & 2033
- Table 56: Global Mobile Fuel Cell Volume K Forecast, by Application 2020 & 2033
- Table 57: Global Mobile Fuel Cell Revenue million Forecast, by Type 2020 & 2033
- Table 58: Global Mobile Fuel Cell Volume K Forecast, by Type 2020 & 2033
- Table 59: Global Mobile Fuel Cell Revenue million Forecast, by Country 2020 & 2033
- Table 60: Global Mobile Fuel Cell Volume K Forecast, by Country 2020 & 2033
- Table 61: Turkey Mobile Fuel Cell Revenue (million) Forecast, by Application 2020 & 2033
- Table 62: Turkey Mobile Fuel Cell Volume (K) Forecast, by Application 2020 & 2033
- Table 63: Israel Mobile Fuel Cell Revenue (million) Forecast, by Application 2020 & 2033
- Table 64: Israel Mobile Fuel Cell Volume (K) Forecast, by Application 2020 & 2033
- Table 65: GCC Mobile Fuel Cell Revenue (million) Forecast, by Application 2020 & 2033
- Table 66: GCC Mobile Fuel Cell Volume (K) Forecast, by Application 2020 & 2033
- Table 67: North Africa Mobile Fuel Cell Revenue (million) Forecast, by Application 2020 & 2033
- Table 68: North Africa Mobile Fuel Cell Volume (K) Forecast, by Application 2020 & 2033
- Table 69: South Africa Mobile Fuel Cell Revenue (million) Forecast, by Application 2020 & 2033
- Table 70: South Africa Mobile Fuel Cell Volume (K) Forecast, by Application 2020 & 2033
- Table 71: Rest of Middle East & Africa Mobile Fuel Cell Revenue (million) Forecast, by Application 2020 & 2033
- Table 72: Rest of Middle East & Africa Mobile Fuel Cell Volume (K) Forecast, by Application 2020 & 2033
- Table 73: Global Mobile Fuel Cell Revenue million Forecast, by Application 2020 & 2033
- Table 74: Global Mobile Fuel Cell Volume K Forecast, by Application 2020 & 2033
- Table 75: Global Mobile Fuel Cell Revenue million Forecast, by Type 2020 & 2033
- Table 76: Global Mobile Fuel Cell Volume K Forecast, by Type 2020 & 2033
- Table 77: Global Mobile Fuel Cell Revenue million Forecast, by Country 2020 & 2033
- Table 78: Global Mobile Fuel Cell Volume K Forecast, by Country 2020 & 2033
- Table 79: China Mobile Fuel Cell Revenue (million) Forecast, by Application 2020 & 2033
- Table 80: China Mobile Fuel Cell Volume (K) Forecast, by Application 2020 & 2033
- Table 81: India Mobile Fuel Cell Revenue (million) Forecast, by Application 2020 & 2033
- Table 82: India Mobile Fuel Cell Volume (K) Forecast, by Application 2020 & 2033
- Table 83: Japan Mobile Fuel Cell Revenue (million) Forecast, by Application 2020 & 2033
- Table 84: Japan Mobile Fuel Cell Volume (K) Forecast, by Application 2020 & 2033
- Table 85: South Korea Mobile Fuel Cell Revenue (million) Forecast, by Application 2020 & 2033
- Table 86: South Korea Mobile Fuel Cell Volume (K) Forecast, by Application 2020 & 2033
- Table 87: ASEAN Mobile Fuel Cell Revenue (million) Forecast, by Application 2020 & 2033
- Table 88: ASEAN Mobile Fuel Cell Volume (K) Forecast, by Application 2020 & 2033
- Table 89: Oceania Mobile Fuel Cell Revenue (million) Forecast, by Application 2020 & 2033
- Table 90: Oceania Mobile Fuel Cell Volume (K) Forecast, by Application 2020 & 2033
- Table 91: Rest of Asia Pacific Mobile Fuel Cell Revenue (million) Forecast, by Application 2020 & 2033
- Table 92: Rest of Asia Pacific Mobile Fuel Cell Volume (K) Forecast, by Application 2020 & 2033
Frequently Asked Questions
1. What is the projected Compound Annual Growth Rate (CAGR) of the Mobile Fuel Cell?
The projected CAGR is approximately 6.42%.
2. Which companies are prominent players in the Mobile Fuel Cell?
Key companies in the market include Doosan, Toshiba, Horiba, Ballard, Plug Power, Cummins, Toyota, Elring Klinger, Bosch/Powercell, Symbio, Intelligent Energy Limited, Horizon Fuel Cell Technologies, Air Liquide, Advent Technologies, Nuvera, Sunrise Power, REFIRE, Sinosynergy, SinoHytec, Pearl Hydrogen.
3. What are the main segments of the Mobile Fuel Cell?
The market segments include Application, Type.
4. Can you provide details about the market size?
The market size is estimated to be USD 425.85 million as of 2022.
5. What are some drivers contributing to market growth?
N/A
6. What are the notable trends driving market growth?
N/A
7. Are there any restraints impacting market growth?
N/A
8. Can you provide examples of recent developments in the market?
N/A
9. What pricing options are available for accessing the report?
Pricing options include single-user, multi-user, and enterprise licenses priced at USD 3950.00, USD 5925.00, and USD 7900.00 respectively.
10. Is the market size provided in terms of value or volume?
The market size is provided in terms of value, measured in million and volume, measured in K.
11. Are there any specific market keywords associated with the report?
Yes, the market keyword associated with the report is "Mobile Fuel Cell," which aids in identifying and referencing the specific market segment covered.
12. How do I determine which pricing option suits my needs best?
The pricing options vary based on user requirements and access needs. Individual users may opt for single-user licenses, while businesses requiring broader access may choose multi-user or enterprise licenses for cost-effective access to the report.
13. Are there any additional resources or data provided in the Mobile Fuel Cell report?
While the report offers comprehensive insights, it's advisable to review the specific contents or supplementary materials provided to ascertain if additional resources or data are available.
14. How can I stay updated on further developments or reports in the Mobile Fuel Cell?
To stay informed about further developments, trends, and reports in the Mobile Fuel Cell, consider subscribing to industry newsletters, following relevant companies and organizations, or regularly checking reputable industry news sources and publications.
Methodology
Step 1 - Identification of Relevant Samples Size from Population Database


Step 2 - Approaches for Defining Global Market Size (Value, Volume* & Price*)

Note*: In applicable scenarios
Step 3 - Data Sources
Primary Research
- Web Analytics
- Survey Reports
- Research Institute
- Latest Research Reports
- Opinion Leaders
Secondary Research
- Annual Reports
- White Paper
- Latest Press Release
- Industry Association
- Paid Database
- Investor Presentations

Step 4 - Data Triangulation
Involves using different sources of information in order to increase the validity of a study
These sources are likely to be stakeholders in a program - participants, other researchers, program staff, other community members, and so on.
Then we put all data in single framework & apply various statistical tools to find out the dynamic on the market.
During the analysis stage, feedback from the stakeholder groups would be compared to determine areas of agreement as well as areas of divergence