

Key Insights
The global market for Electrical Utility Task Vehicles (EUTVs) is experiencing robust growth, driven by increasing demand for sustainable and efficient solutions within the utility sector. The rising adoption of electric vehicles across various industries, coupled with stringent emission regulations and the escalating cost of fossil fuels, is significantly boosting the market. Key trends include the increasing integration of advanced technologies such as telematics and smart grids, leading to enhanced operational efficiency and reduced maintenance costs. Furthermore, the development of high-performance battery technologies with extended operational ranges is addressing a previous limitation of EUTVs, expanding their applicability across wider geographical areas and diverse utility applications. While the initial investment cost of EUTVs remains a restraint, the long-term cost savings associated with reduced fuel consumption and maintenance are proving increasingly attractive to utility companies. Leading manufacturers like Polaris, John Deere, and Kubota are actively investing in R&D and expanding their product portfolios to cater to this burgeoning demand. The market is segmented by vehicle type (e.g., trucks, buggies, all-terrain vehicles), battery technology (e.g., lithium-ion, lead-acid), and application (e.g., line maintenance, meter reading, inspection). Geographic expansion is also a significant factor, with North America and Europe currently dominating the market, but emerging economies in Asia-Pacific showing strong potential for future growth. The overall market is poised for significant expansion throughout the forecast period.
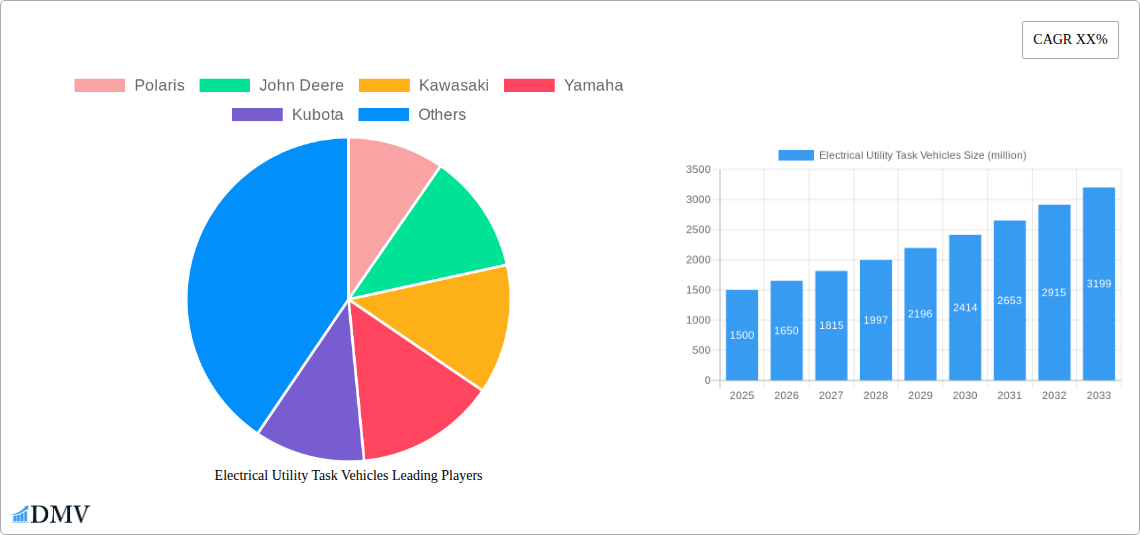
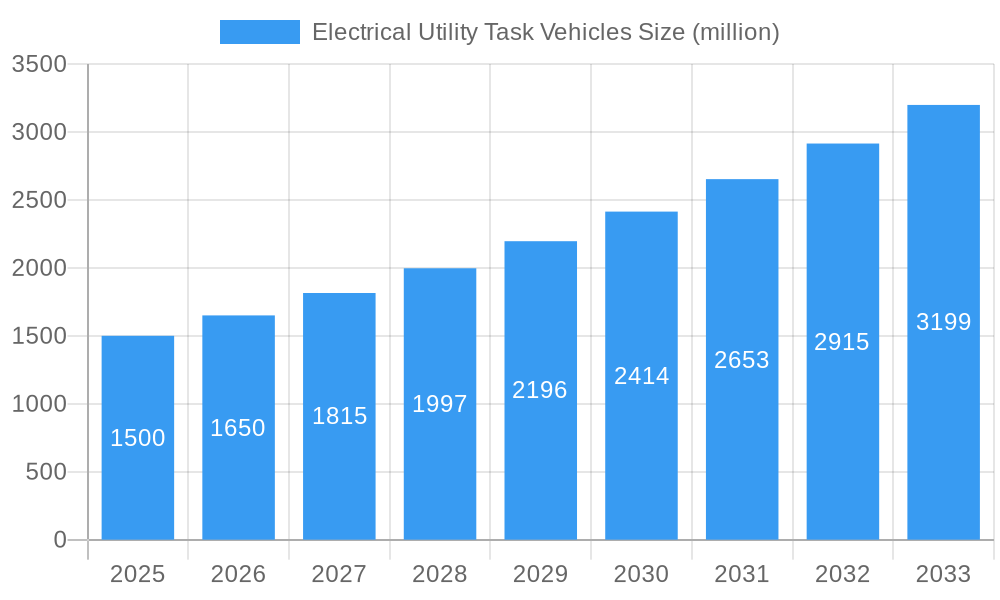
Electrical Utility Task Vehicles Market Size (In Billion)
The competitive landscape is characterized by a mix of established players and emerging entrants. Established manufacturers leverage their brand reputation and existing distribution networks to maintain market share. However, the entry of new players with innovative technologies and business models presents a competitive challenge. Strategic partnerships and collaborations are becoming increasingly common, with manufacturers partnering with technology providers to enhance the capabilities of their EUTVs. The focus on improving battery technology and expanding charging infrastructure will play a crucial role in determining the future growth trajectory of the EUTV market. Government incentives and supportive policies aimed at promoting the adoption of electric vehicles are also expected to further stimulate market growth in the coming years. The projected CAGR, considering the factors mentioned above, indicates a healthy growth rate reflecting the growing market acceptance and investment in this sector.
Electrical Utility Task Vehicles Company Market Share
Electrical Utility Task Vehicles Market Report: 2019-2033 – A Comprehensive Analysis of a $XX Million Market
This comprehensive report provides an in-depth analysis of the global Electrical Utility Task Vehicles market, projecting a value of $XX million by 2033. The study covers the period 2019-2033, with a base year of 2025 and a forecast period of 2025-2033. It offers crucial insights into market dynamics, competitive landscapes, technological advancements, and future growth opportunities for stakeholders across the industry. This report is invaluable for investors, manufacturers (including Polaris, John Deere, Kawasaki, Yamaha, Kubota, Can-Am (BPR), CFMOTO, Honda, HSUN Motor, Arctic Cat, KYMCO, and Linhai Group), and policymakers seeking to understand this rapidly evolving sector.
Electrical Utility Task Vehicles Market Composition & Trends
The Electrical Utility Task Vehicles market is characterized by moderate concentration, with a few major players holding significant market share, totaling approximately xx%. However, the market is witnessing increased competition from new entrants, especially in the electric vehicle segment. Innovation is driven by stricter emission regulations, rising demand for fuel-efficient vehicles, and advancements in battery technology. The regulatory landscape varies across regions, influencing adoption rates and market growth. Substitute products include traditional gasoline-powered utility vehicles and other specialized equipment, although the electric options offer growing appeal due to cost savings and environmental benefits. End-users primarily include electric utilities, municipalities, and construction companies. M&A activity has been moderate in recent years, with several smaller acquisitions valued at a combined $xx million in 2024, predominantly focusing on enhancing technology and expanding geographic reach.
- Market Share Distribution (2024): Polaris (xx%), John Deere (xx%), Kawasaki (xx%), Others (xx%)
- M&A Deal Value (2019-2024): $xx million
- Key Innovation Catalysts: Stringent emission norms, advancements in battery technology, increasing demand for sustainable solutions.
Electrical Utility Task Vehicles Industry Evolution
The Electrical Utility Task Vehicles market experienced a Compound Annual Growth Rate (CAGR) of xx% during the historical period (2019-2024). This growth was fueled by the increasing adoption of electric vehicles due to their lower operating costs and environmental benefits. Technological advancements, such as improved battery life, faster charging times, and enhanced performance capabilities, further accelerated market expansion. Consumer demand is shifting towards more efficient, sustainable, and technologically advanced vehicles, requiring manufacturers to continuously innovate to meet these changing preferences. The estimated market size in 2025 is $xx million, with a projected CAGR of xx% during the forecast period (2025-2033), indicating robust growth potential. This growth is primarily driven by the increasing electrification of utility fleets and the rising focus on reducing carbon emissions across various sectors. Adoption of electric utility task vehicles is expected to reach xx% by 2033.
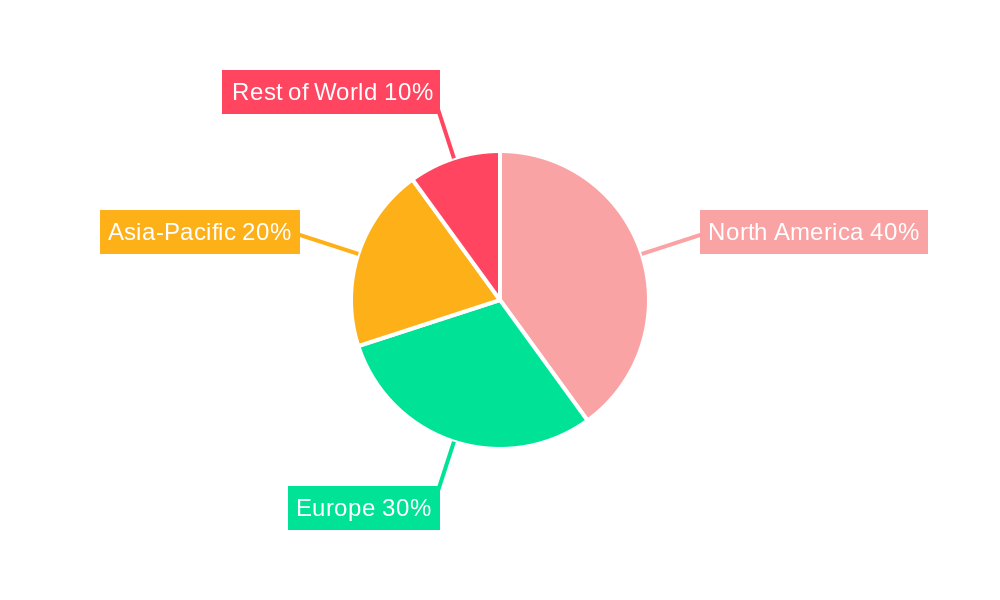
Leading Regions, Countries, or Segments in Electrical Utility Task Vehicles
North America currently holds the dominant position in the Electrical Utility Task Vehicles market, accounting for approximately xx% of the global market share in 2024. This dominance is attributed to several key factors:
- High investment in renewable energy infrastructure: Significant government investments are driving the adoption of electric vehicles in the utility sector.
- Favorable regulatory environment: Supportive policies and incentives promote the transition to electric vehicles.
- Strong presence of major manufacturers: A large number of key players are headquartered in the region.
Europe follows as a significant market, driven by stringent emission regulations and growing environmental awareness. The Asia-Pacific region is also showing rapid growth, fueled by increasing urbanization and infrastructure development. However, challenges like high initial costs and limited charging infrastructure are hindering market penetration in some regions.
Electrical Utility Task Vehicles Product Innovations
Recent innovations in Electrical Utility Task Vehicles focus on enhancing battery technology for extended range and faster charging times. Improved motor efficiency, advanced safety features like autonomous braking and obstacle detection, and enhanced payload capacities are driving market adoption. The integration of smart technologies, including telematics and data analytics, allows for optimized fleet management and reduced operational costs. These innovations provide unique selling propositions for manufacturers, emphasizing improved performance, reduced environmental impact, and enhanced operational efficiency.
Propelling Factors for Electrical Utility Task Vehicles Growth
The growth of the Electrical Utility Task Vehicles market is driven by several key factors. Technological advancements, such as improved battery technology and more efficient motors, are making electric vehicles increasingly viable. Economically, the lower operating costs of electric vehicles compared to gasoline-powered counterparts are attracting increased adoption. Furthermore, stringent government regulations aimed at reducing emissions and promoting sustainability are pushing the transition towards electric vehicles. These factors are converging to create significant growth opportunities in the coming years.
Obstacles in the Electrical Utility Task Vehicles Market
The Electrical Utility Task Vehicles market faces certain challenges. High initial purchase prices compared to gasoline-powered vehicles, and limited charging infrastructure in some regions, can restrict widespread adoption. Supply chain disruptions, particularly concerning battery materials, can impact production and availability. Intense competition among established and emerging manufacturers further adds to the challenges. These factors collectively impact market growth and require manufacturers to develop robust strategies to address these obstacles.
Future Opportunities in Electrical Utility Task Vehicles
The future of the Electrical Utility Task Vehicles market holds significant opportunities. Expansion into new markets, particularly in developing countries with growing infrastructure needs, presents a substantial growth potential. Technological advancements, like the development of solid-state batteries and improved charging technologies, will enhance vehicle performance and overcome current limitations. Increasing consumer demand for sustainable and technologically advanced vehicles will continue to drive market expansion. These opportunities necessitate proactive strategies by manufacturers to capitalize on future market growth.
Major Players in the Electrical Utility Task Vehicles Ecosystem
- Polaris
- John Deere
- Kawasaki
- Yamaha
- Kubota
- Can-Am (BRP)
- CFMOTO
- Honda
- HSUN Motor
- Arctic Cat
- KYMCO
- Linhai Group
Key Developments in Electrical Utility Task Vehicles Industry
- Q1 2024: John Deere launches a new line of electric utility vehicles with enhanced battery technology.
- Q3 2023: Polaris announces a strategic partnership with a battery supplier to secure long-term supply.
- Q4 2022: A major merger between two smaller electric utility vehicle manufacturers consolidates market share.
Strategic Electrical Utility Task Vehicles Market Forecast
The Electrical Utility Task Vehicles market is poised for continued robust growth, driven by technological advancements, increasing environmental concerns, and supportive government policies. The market is expected to witness substantial expansion in the coming years, with key growth catalysts including the rising adoption of electric vehicles across various sectors, and the development of innovative technologies that enhance vehicle performance and reduce operational costs. This presents significant opportunities for manufacturers to invest in research and development, expand their product portfolios, and capture a larger share of this expanding market.
Electrical Utility Task Vehicles Segmentation
-
1. Application
- 1.1. Work UTV
- 1.2. Sport UTV
- 1.3. Others
-
2. Types
- 2.1. HEV
- 2.2. BEV
- 2.3. FCEV
Electrical Utility Task Vehicles Segmentation By Geography
-
1. North America
- 1.1. United States
- 1.2. Canada
- 1.3. Mexico
-
2. South America
- 2.1. Brazil
- 2.2. Argentina
- 2.3. Rest of South America
-
3. Europe
- 3.1. United Kingdom
- 3.2. Germany
- 3.3. France
- 3.4. Italy
- 3.5. Spain
- 3.6. Russia
- 3.7. Benelux
- 3.8. Nordics
- 3.9. Rest of Europe
-
4. Middle East & Africa
- 4.1. Turkey
- 4.2. Israel
- 4.3. GCC
- 4.4. North Africa
- 4.5. South Africa
- 4.6. Rest of Middle East & Africa
-
5. Asia Pacific
- 5.1. China
- 5.2. India
- 5.3. Japan
- 5.4. South Korea
- 5.5. ASEAN
- 5.6. Oceania
- 5.7. Rest of Asia Pacific
Electrical Utility Task Vehicles Regional Market Share
Geographic Coverage of Electrical Utility Task Vehicles
Electrical Utility Task Vehicles REPORT HIGHLIGHTS
| Aspects | Details |
|---|---|
| Study Period | 2020-2034 |
| Base Year | 2025 |
| Estimated Year | 2026 |
| Forecast Period | 2026-2034 |
| Historical Period | 2020-2025 |
| Growth Rate | CAGR of 22.87% from 2020-2034 |
| Segmentation |
|
Table of Contents
- 1. Introduction
- 1.1. Research Scope
- 1.2. Market Segmentation
- 1.3. Research Methodology
- 1.4. Definitions and Assumptions
- 2. Executive Summary
- 2.1. Introduction
- 3. Market Dynamics
- 3.1. Introduction
- 3.2. Market Drivers
- 3.3. Market Restrains
- 3.4. Market Trends
- 4. Market Factor Analysis
- 4.1. Porters Five Forces
- 4.2. Supply/Value Chain
- 4.3. PESTEL analysis
- 4.4. Market Entropy
- 4.5. Patent/Trademark Analysis
- 5. Global Electrical Utility Task Vehicles Analysis, Insights and Forecast, 2020-2032
- 5.1. Market Analysis, Insights and Forecast - by Application
- 5.1.1. Work UTV
- 5.1.2. Sport UTV
- 5.1.3. Others
- 5.2. Market Analysis, Insights and Forecast - by Types
- 5.2.1. HEV
- 5.2.2. BEV
- 5.2.3. FCEV
- 5.3. Market Analysis, Insights and Forecast - by Region
- 5.3.1. North America
- 5.3.2. South America
- 5.3.3. Europe
- 5.3.4. Middle East & Africa
- 5.3.5. Asia Pacific
- 5.1. Market Analysis, Insights and Forecast - by Application
- 6. North America Electrical Utility Task Vehicles Analysis, Insights and Forecast, 2020-2032
- 6.1. Market Analysis, Insights and Forecast - by Application
- 6.1.1. Work UTV
- 6.1.2. Sport UTV
- 6.1.3. Others
- 6.2. Market Analysis, Insights and Forecast - by Types
- 6.2.1. HEV
- 6.2.2. BEV
- 6.2.3. FCEV
- 6.1. Market Analysis, Insights and Forecast - by Application
- 7. South America Electrical Utility Task Vehicles Analysis, Insights and Forecast, 2020-2032
- 7.1. Market Analysis, Insights and Forecast - by Application
- 7.1.1. Work UTV
- 7.1.2. Sport UTV
- 7.1.3. Others
- 7.2. Market Analysis, Insights and Forecast - by Types
- 7.2.1. HEV
- 7.2.2. BEV
- 7.2.3. FCEV
- 7.1. Market Analysis, Insights and Forecast - by Application
- 8. Europe Electrical Utility Task Vehicles Analysis, Insights and Forecast, 2020-2032
- 8.1. Market Analysis, Insights and Forecast - by Application
- 8.1.1. Work UTV
- 8.1.2. Sport UTV
- 8.1.3. Others
- 8.2. Market Analysis, Insights and Forecast - by Types
- 8.2.1. HEV
- 8.2.2. BEV
- 8.2.3. FCEV
- 8.1. Market Analysis, Insights and Forecast - by Application
- 9. Middle East & Africa Electrical Utility Task Vehicles Analysis, Insights and Forecast, 2020-2032
- 9.1. Market Analysis, Insights and Forecast - by Application
- 9.1.1. Work UTV
- 9.1.2. Sport UTV
- 9.1.3. Others
- 9.2. Market Analysis, Insights and Forecast - by Types
- 9.2.1. HEV
- 9.2.2. BEV
- 9.2.3. FCEV
- 9.1. Market Analysis, Insights and Forecast - by Application
- 10. Asia Pacific Electrical Utility Task Vehicles Analysis, Insights and Forecast, 2020-2032
- 10.1. Market Analysis, Insights and Forecast - by Application
- 10.1.1. Work UTV
- 10.1.2. Sport UTV
- 10.1.3. Others
- 10.2. Market Analysis, Insights and Forecast - by Types
- 10.2.1. HEV
- 10.2.2. BEV
- 10.2.3. FCEV
- 10.1. Market Analysis, Insights and Forecast - by Application
- 11. Competitive Analysis
- 11.1. Global Market Share Analysis 2025
- 11.2. Company Profiles
- 11.2.1 Polaris
- 11.2.1.1. Overview
- 11.2.1.2. Products
- 11.2.1.3. SWOT Analysis
- 11.2.1.4. Recent Developments
- 11.2.1.5. Financials (Based on Availability)
- 11.2.2 John Deere
- 11.2.2.1. Overview
- 11.2.2.2. Products
- 11.2.2.3. SWOT Analysis
- 11.2.2.4. Recent Developments
- 11.2.2.5. Financials (Based on Availability)
- 11.2.3 Kawasaki
- 11.2.3.1. Overview
- 11.2.3.2. Products
- 11.2.3.3. SWOT Analysis
- 11.2.3.4. Recent Developments
- 11.2.3.5. Financials (Based on Availability)
- 11.2.4 Yamaha
- 11.2.4.1. Overview
- 11.2.4.2. Products
- 11.2.4.3. SWOT Analysis
- 11.2.4.4. Recent Developments
- 11.2.4.5. Financials (Based on Availability)
- 11.2.5 Kubota
- 11.2.5.1. Overview
- 11.2.5.2. Products
- 11.2.5.3. SWOT Analysis
- 11.2.5.4. Recent Developments
- 11.2.5.5. Financials (Based on Availability)
- 11.2.6 Can-Am(BPR)
- 11.2.6.1. Overview
- 11.2.6.2. Products
- 11.2.6.3. SWOT Analysis
- 11.2.6.4. Recent Developments
- 11.2.6.5. Financials (Based on Availability)
- 11.2.7 CFMOTO
- 11.2.7.1. Overview
- 11.2.7.2. Products
- 11.2.7.3. SWOT Analysis
- 11.2.7.4. Recent Developments
- 11.2.7.5. Financials (Based on Availability)
- 11.2.8 Honda
- 11.2.8.1. Overview
- 11.2.8.2. Products
- 11.2.8.3. SWOT Analysis
- 11.2.8.4. Recent Developments
- 11.2.8.5. Financials (Based on Availability)
- 11.2.9 HSUN Motor
- 11.2.9.1. Overview
- 11.2.9.2. Products
- 11.2.9.3. SWOT Analysis
- 11.2.9.4. Recent Developments
- 11.2.9.5. Financials (Based on Availability)
- 11.2.10 Arctic Cat
- 11.2.10.1. Overview
- 11.2.10.2. Products
- 11.2.10.3. SWOT Analysis
- 11.2.10.4. Recent Developments
- 11.2.10.5. Financials (Based on Availability)
- 11.2.11 KYMCO
- 11.2.11.1. Overview
- 11.2.11.2. Products
- 11.2.11.3. SWOT Analysis
- 11.2.11.4. Recent Developments
- 11.2.11.5. Financials (Based on Availability)
- 11.2.12 Linhai Group
- 11.2.12.1. Overview
- 11.2.12.2. Products
- 11.2.12.3. SWOT Analysis
- 11.2.12.4. Recent Developments
- 11.2.12.5. Financials (Based on Availability)
- 11.2.1 Polaris
List of Figures
- Figure 1: Global Electrical Utility Task Vehicles Revenue Breakdown (undefined, %) by Region 2025 & 2033
- Figure 2: North America Electrical Utility Task Vehicles Revenue (undefined), by Application 2025 & 2033
- Figure 3: North America Electrical Utility Task Vehicles Revenue Share (%), by Application 2025 & 2033
- Figure 4: North America Electrical Utility Task Vehicles Revenue (undefined), by Types 2025 & 2033
- Figure 5: North America Electrical Utility Task Vehicles Revenue Share (%), by Types 2025 & 2033
- Figure 6: North America Electrical Utility Task Vehicles Revenue (undefined), by Country 2025 & 2033
- Figure 7: North America Electrical Utility Task Vehicles Revenue Share (%), by Country 2025 & 2033
- Figure 8: South America Electrical Utility Task Vehicles Revenue (undefined), by Application 2025 & 2033
- Figure 9: South America Electrical Utility Task Vehicles Revenue Share (%), by Application 2025 & 2033
- Figure 10: South America Electrical Utility Task Vehicles Revenue (undefined), by Types 2025 & 2033
- Figure 11: South America Electrical Utility Task Vehicles Revenue Share (%), by Types 2025 & 2033
- Figure 12: South America Electrical Utility Task Vehicles Revenue (undefined), by Country 2025 & 2033
- Figure 13: South America Electrical Utility Task Vehicles Revenue Share (%), by Country 2025 & 2033
- Figure 14: Europe Electrical Utility Task Vehicles Revenue (undefined), by Application 2025 & 2033
- Figure 15: Europe Electrical Utility Task Vehicles Revenue Share (%), by Application 2025 & 2033
- Figure 16: Europe Electrical Utility Task Vehicles Revenue (undefined), by Types 2025 & 2033
- Figure 17: Europe Electrical Utility Task Vehicles Revenue Share (%), by Types 2025 & 2033
- Figure 18: Europe Electrical Utility Task Vehicles Revenue (undefined), by Country 2025 & 2033
- Figure 19: Europe Electrical Utility Task Vehicles Revenue Share (%), by Country 2025 & 2033
- Figure 20: Middle East & Africa Electrical Utility Task Vehicles Revenue (undefined), by Application 2025 & 2033
- Figure 21: Middle East & Africa Electrical Utility Task Vehicles Revenue Share (%), by Application 2025 & 2033
- Figure 22: Middle East & Africa Electrical Utility Task Vehicles Revenue (undefined), by Types 2025 & 2033
- Figure 23: Middle East & Africa Electrical Utility Task Vehicles Revenue Share (%), by Types 2025 & 2033
- Figure 24: Middle East & Africa Electrical Utility Task Vehicles Revenue (undefined), by Country 2025 & 2033
- Figure 25: Middle East & Africa Electrical Utility Task Vehicles Revenue Share (%), by Country 2025 & 2033
- Figure 26: Asia Pacific Electrical Utility Task Vehicles Revenue (undefined), by Application 2025 & 2033
- Figure 27: Asia Pacific Electrical Utility Task Vehicles Revenue Share (%), by Application 2025 & 2033
- Figure 28: Asia Pacific Electrical Utility Task Vehicles Revenue (undefined), by Types 2025 & 2033
- Figure 29: Asia Pacific Electrical Utility Task Vehicles Revenue Share (%), by Types 2025 & 2033
- Figure 30: Asia Pacific Electrical Utility Task Vehicles Revenue (undefined), by Country 2025 & 2033
- Figure 31: Asia Pacific Electrical Utility Task Vehicles Revenue Share (%), by Country 2025 & 2033
List of Tables
- Table 1: Global Electrical Utility Task Vehicles Revenue undefined Forecast, by Application 2020 & 2033
- Table 2: Global Electrical Utility Task Vehicles Revenue undefined Forecast, by Types 2020 & 2033
- Table 3: Global Electrical Utility Task Vehicles Revenue undefined Forecast, by Region 2020 & 2033
- Table 4: Global Electrical Utility Task Vehicles Revenue undefined Forecast, by Application 2020 & 2033
- Table 5: Global Electrical Utility Task Vehicles Revenue undefined Forecast, by Types 2020 & 2033
- Table 6: Global Electrical Utility Task Vehicles Revenue undefined Forecast, by Country 2020 & 2033
- Table 7: United States Electrical Utility Task Vehicles Revenue (undefined) Forecast, by Application 2020 & 2033
- Table 8: Canada Electrical Utility Task Vehicles Revenue (undefined) Forecast, by Application 2020 & 2033
- Table 9: Mexico Electrical Utility Task Vehicles Revenue (undefined) Forecast, by Application 2020 & 2033
- Table 10: Global Electrical Utility Task Vehicles Revenue undefined Forecast, by Application 2020 & 2033
- Table 11: Global Electrical Utility Task Vehicles Revenue undefined Forecast, by Types 2020 & 2033
- Table 12: Global Electrical Utility Task Vehicles Revenue undefined Forecast, by Country 2020 & 2033
- Table 13: Brazil Electrical Utility Task Vehicles Revenue (undefined) Forecast, by Application 2020 & 2033
- Table 14: Argentina Electrical Utility Task Vehicles Revenue (undefined) Forecast, by Application 2020 & 2033
- Table 15: Rest of South America Electrical Utility Task Vehicles Revenue (undefined) Forecast, by Application 2020 & 2033
- Table 16: Global Electrical Utility Task Vehicles Revenue undefined Forecast, by Application 2020 & 2033
- Table 17: Global Electrical Utility Task Vehicles Revenue undefined Forecast, by Types 2020 & 2033
- Table 18: Global Electrical Utility Task Vehicles Revenue undefined Forecast, by Country 2020 & 2033
- Table 19: United Kingdom Electrical Utility Task Vehicles Revenue (undefined) Forecast, by Application 2020 & 2033
- Table 20: Germany Electrical Utility Task Vehicles Revenue (undefined) Forecast, by Application 2020 & 2033
- Table 21: France Electrical Utility Task Vehicles Revenue (undefined) Forecast, by Application 2020 & 2033
- Table 22: Italy Electrical Utility Task Vehicles Revenue (undefined) Forecast, by Application 2020 & 2033
- Table 23: Spain Electrical Utility Task Vehicles Revenue (undefined) Forecast, by Application 2020 & 2033
- Table 24: Russia Electrical Utility Task Vehicles Revenue (undefined) Forecast, by Application 2020 & 2033
- Table 25: Benelux Electrical Utility Task Vehicles Revenue (undefined) Forecast, by Application 2020 & 2033
- Table 26: Nordics Electrical Utility Task Vehicles Revenue (undefined) Forecast, by Application 2020 & 2033
- Table 27: Rest of Europe Electrical Utility Task Vehicles Revenue (undefined) Forecast, by Application 2020 & 2033
- Table 28: Global Electrical Utility Task Vehicles Revenue undefined Forecast, by Application 2020 & 2033
- Table 29: Global Electrical Utility Task Vehicles Revenue undefined Forecast, by Types 2020 & 2033
- Table 30: Global Electrical Utility Task Vehicles Revenue undefined Forecast, by Country 2020 & 2033
- Table 31: Turkey Electrical Utility Task Vehicles Revenue (undefined) Forecast, by Application 2020 & 2033
- Table 32: Israel Electrical Utility Task Vehicles Revenue (undefined) Forecast, by Application 2020 & 2033
- Table 33: GCC Electrical Utility Task Vehicles Revenue (undefined) Forecast, by Application 2020 & 2033
- Table 34: North Africa Electrical Utility Task Vehicles Revenue (undefined) Forecast, by Application 2020 & 2033
- Table 35: South Africa Electrical Utility Task Vehicles Revenue (undefined) Forecast, by Application 2020 & 2033
- Table 36: Rest of Middle East & Africa Electrical Utility Task Vehicles Revenue (undefined) Forecast, by Application 2020 & 2033
- Table 37: Global Electrical Utility Task Vehicles Revenue undefined Forecast, by Application 2020 & 2033
- Table 38: Global Electrical Utility Task Vehicles Revenue undefined Forecast, by Types 2020 & 2033
- Table 39: Global Electrical Utility Task Vehicles Revenue undefined Forecast, by Country 2020 & 2033
- Table 40: China Electrical Utility Task Vehicles Revenue (undefined) Forecast, by Application 2020 & 2033
- Table 41: India Electrical Utility Task Vehicles Revenue (undefined) Forecast, by Application 2020 & 2033
- Table 42: Japan Electrical Utility Task Vehicles Revenue (undefined) Forecast, by Application 2020 & 2033
- Table 43: South Korea Electrical Utility Task Vehicles Revenue (undefined) Forecast, by Application 2020 & 2033
- Table 44: ASEAN Electrical Utility Task Vehicles Revenue (undefined) Forecast, by Application 2020 & 2033
- Table 45: Oceania Electrical Utility Task Vehicles Revenue (undefined) Forecast, by Application 2020 & 2033
- Table 46: Rest of Asia Pacific Electrical Utility Task Vehicles Revenue (undefined) Forecast, by Application 2020 & 2033
Frequently Asked Questions
1. What is the projected Compound Annual Growth Rate (CAGR) of the Electrical Utility Task Vehicles?
The projected CAGR is approximately 22.87%.
2. Which companies are prominent players in the Electrical Utility Task Vehicles?
Key companies in the market include Polaris, John Deere, Kawasaki, Yamaha, Kubota, Can-Am(BPR), CFMOTO, Honda, HSUN Motor, Arctic Cat, KYMCO, Linhai Group.
3. What are the main segments of the Electrical Utility Task Vehicles?
The market segments include Application, Types.
4. Can you provide details about the market size?
The market size is estimated to be USD XXX N/A as of 2022.
5. What are some drivers contributing to market growth?
N/A
6. What are the notable trends driving market growth?
N/A
7. Are there any restraints impacting market growth?
N/A
8. Can you provide examples of recent developments in the market?
N/A
9. What pricing options are available for accessing the report?
Pricing options include single-user, multi-user, and enterprise licenses priced at USD 4900.00, USD 7350.00, and USD 9800.00 respectively.
10. Is the market size provided in terms of value or volume?
The market size is provided in terms of value, measured in N/A.
11. Are there any specific market keywords associated with the report?
Yes, the market keyword associated with the report is "Electrical Utility Task Vehicles," which aids in identifying and referencing the specific market segment covered.
12. How do I determine which pricing option suits my needs best?
The pricing options vary based on user requirements and access needs. Individual users may opt for single-user licenses, while businesses requiring broader access may choose multi-user or enterprise licenses for cost-effective access to the report.
13. Are there any additional resources or data provided in the Electrical Utility Task Vehicles report?
While the report offers comprehensive insights, it's advisable to review the specific contents or supplementary materials provided to ascertain if additional resources or data are available.
14. How can I stay updated on further developments or reports in the Electrical Utility Task Vehicles?
To stay informed about further developments, trends, and reports in the Electrical Utility Task Vehicles, consider subscribing to industry newsletters, following relevant companies and organizations, or regularly checking reputable industry news sources and publications.
Methodology
Step 1 - Identification of Relevant Samples Size from Population Database


Step 2 - Approaches for Defining Global Market Size (Value, Volume* & Price*)

Note*: In applicable scenarios
Step 3 - Data Sources
Primary Research
- Web Analytics
- Survey Reports
- Research Institute
- Latest Research Reports
- Opinion Leaders
Secondary Research
- Annual Reports
- White Paper
- Latest Press Release
- Industry Association
- Paid Database
- Investor Presentations

Step 4 - Data Triangulation
Involves using different sources of information in order to increase the validity of a study
These sources are likely to be stakeholders in a program - participants, other researchers, program staff, other community members, and so on.
Then we put all data in single framework & apply various statistical tools to find out the dynamic on the market.
During the analysis stage, feedback from the stakeholder groups would be compared to determine areas of agreement as well as areas of divergence