

Key Insights
The Electric Vehicle Level 3 Fast Charger market is poised for substantial expansion, projected to reach an estimated market size of USD 21,030 million by 2033. This impressive growth is fueled by a remarkable Compound Annual Growth Rate (CAGR) of 27.2% over the forecast period of 2025-2033. This surge is primarily driven by the escalating adoption of electric vehicles globally, necessitating robust and rapid charging infrastructure to alleviate range anxiety and support seamless long-distance travel. Government initiatives and incentives aimed at promoting EV adoption and developing charging networks further bolster market expansion. The increasing demand for faster charging solutions in public spaces, including transportation hubs and public parking facilities, is a significant factor. Furthermore, advancements in charging technology, leading to higher power outputs and improved efficiency, are also contributing to market dynamism. The integration of smart charging solutions, enabling grid optimization and load balancing, represents a key trend.
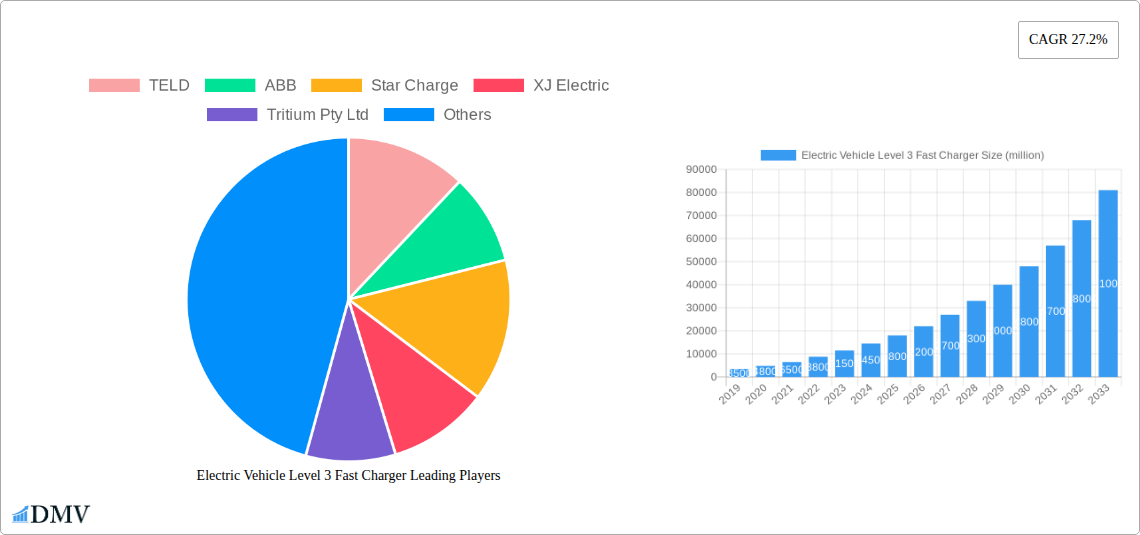
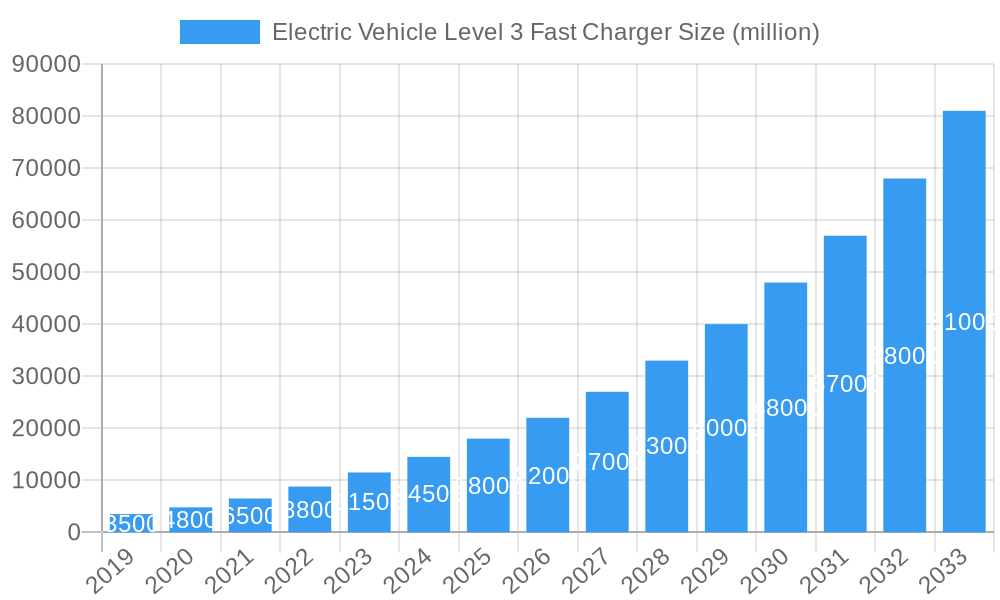
Electric Vehicle Level 3 Fast Charger Market Size (In Billion)
The market is segmented into various charging connector types, with the Combined Charging System (CCS) expected to dominate due to its widespread adoption in major automotive markets. However, CHAdeMO, Tesla Supercharger, and GB/T will continue to hold significant shares, particularly in regions where they are predominantly used. Key players like TELD, ABB, Star Charge, XJ Electric, Tritium Pty Ltd, TESLA, ChargePoint, Efacec, Schneider Electric, Wanma, Siemens, and BTC Power are actively investing in research and development to offer innovative and efficient fast-charging solutions. While the market presents immense opportunities, challenges such as high initial installation costs, grid capacity limitations, and the need for standardized charging protocols could temper growth to some extent. Nevertheless, the overarching trend towards electrification and sustainable transportation ensures a bright outlook for the Electric Vehicle Level 3 Fast Charger market.
Electric Vehicle Level 3 Fast Charger Company Market Share
Electric Vehicle Level 3 Fast Charger Market Composition & Trends
The electric vehicle (EV) Level 3 fast charger market is experiencing dynamic shifts driven by rapid technological advancements and increasing EV adoption. Market concentration is evolving, with key players like ABB, ChargePoint, TESLA, and Schneider Electric actively shaping the landscape through strategic partnerships and product development. Innovation catalysts include the demand for faster charging speeds, improved grid integration, and the expansion of charging infrastructure in public and private sectors. Regulatory landscapes worldwide are increasingly supportive, offering incentives and setting standards that encourage the deployment of DC fast charging solutions. Substitute products, such as Level 2 chargers, still hold a significant market share but are gradually being outpaced by the need for ultra-fast charging for longer-distance travel and commercial fleets. End-user profiles are diversifying, encompassing individual EV owners seeking convenience, fleet operators prioritizing uptime, and energy providers looking to manage grid load. Mergers and acquisitions (M&A) are significant, with deal values reaching several hundred million dollars, indicating consolidation and strategic expansion. For instance, recent M&A activities have seen established energy and automotive component giants acquiring specialized charging companies to bolster their portfolios, contributing to a projected market value of over $50,000 million by the end of the forecast period. The competitive intensity is high, with established players and emerging innovators vying for market share, leading to a market share distribution where the top 5 players collectively hold approximately 60% of the market value.
Electric Vehicle Level 3 Fast Charger Industry Evolution
The electric vehicle Level 3 fast charger industry has witnessed a phenomenal evolutionary trajectory, transforming from a niche technology to a critical enabler of mass EV adoption. Over the historical period from 2019 to 2024, the market experienced a compound annual growth rate (CAGR) of approximately 35%, driven by a confluence of factors. Initially, the primary growth engines were government incentives and the increasing availability of EV models. As the study period commenced, consumer awareness and the desire for convenient, rapid charging solutions began to escalate, pushing manufacturers to innovate. Technological advancements have been relentless, with charging power increasing from around 50 kW in the early years to over 350 kW and even pushing towards 500 kW in recent developments. This has significantly reduced charging times, making EVs a more viable option for longer journeys.
The base year, 2025, marks a pivotal point where Level 3 fast charging infrastructure is becoming more ubiquitous, with an estimated installed base exceeding 1.5 million units globally. The forecast period from 2025 to 2033 anticipates continued robust growth, with a projected CAGR of around 25%. This sustained expansion is fueled by several interconnected trends. Shifting consumer demands are a significant driver; drivers now expect charging times comparable to refueling a gasoline vehicle, and Level 3 chargers are fulfilling this expectation. The expansion of charging networks, particularly along major transportation corridors and in urban centers, is crucial. Companies like TELD, Star Charge, and Wanma are making substantial investments in expanding their network footprints, especially in regions with high EV penetration.
Technological advancements continue to be a cornerstone of this evolution. The development of ultra-fast charging protocols, such as advancements in the Combined Charging System (CCS) standard and the continued iteration of the Tesla Supercharger network, are enabling higher power delivery and improved vehicle compatibility. The integration of smart grid technologies, including vehicle-to-grid (V2G) capabilities, is also becoming increasingly important, allowing chargers to not only deliver power to EVs but also to store and return energy to the grid, thereby optimizing energy usage and potentially generating revenue. The adoption of interoperable charging standards is also fostering wider accessibility and user convenience. As we move towards 2033, the market is expected to reach a valuation exceeding $50,000 million, underscoring the transformative impact of Level 3 fast charging on the global transportation ecosystem.
Leading Regions, Countries, or Segments in Electric Vehicle Level 3 Fast Charger
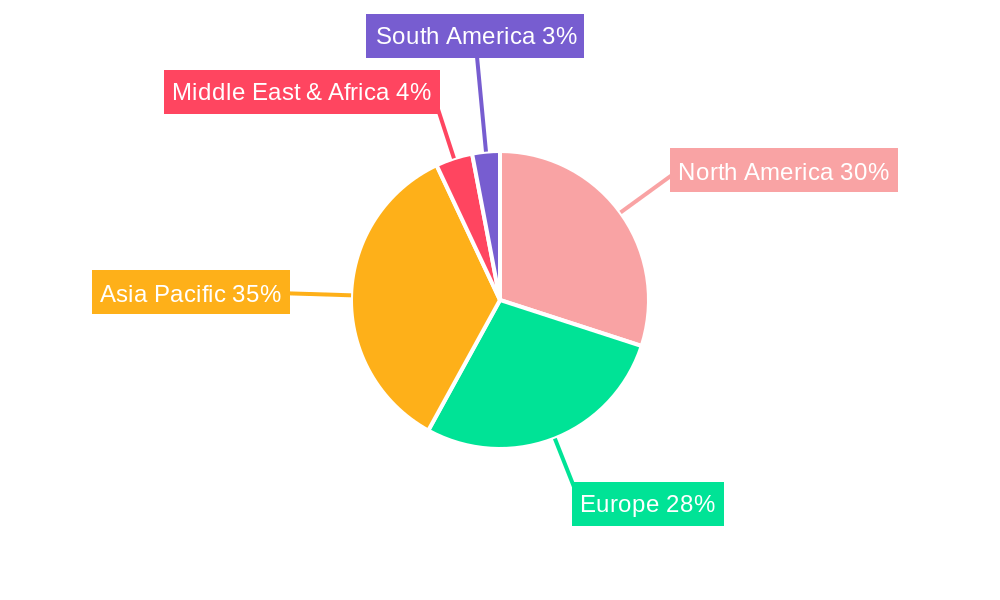
The global electric vehicle Level 3 fast charger market is characterized by regional dominance and segment-specific growth patterns. North America, particularly the United States, and Europe, led by Germany, Norway, and the UK, currently represent the most significant markets, driven by strong government support, high EV adoption rates, and substantial investments in charging infrastructure.
In terms of Application, the Transportation Hubs segment is emerging as a dominant force. These hubs, including airports, train stations, and major highway rest stops, are crucial for enabling long-distance EV travel and facilitating the transition to electric mobility. The ability to quickly charge vehicles at these high-traffic locations is paramount for drivers. Public parking facilities in urban centers also represent a rapidly growing application, catering to the needs of commuters and shoppers.
The Type of charging connector also plays a crucial role in market segmentation. The Combined Charging System (CCS) has emerged as the dominant global standard, particularly in North America and Europe, owing to its dual AC/DC charging capability and widespread adoption by major automakers. However, the Tesla Supercharger network continues to hold significant sway, particularly in regions where Tesla vehicles are prevalent, and its proprietary connector has been a key differentiator. In Asia, particularly China, the GB/T standard remains the primary charging protocol, reflecting the unique automotive ecosystem in the region. CHAdeMO still maintains a presence, especially in countries like Japan where it was an early standard, but its market share is gradually declining in favor of CCS.
Key Drivers for Dominance in Regions and Segments:
- Regulatory Support and Incentives: Governments worldwide are offering substantial subsidies, tax credits, and grants for the deployment of Level 3 chargers. For example, the US Bipartisan Infrastructure Law allocates billions of dollars for EV charging infrastructure, significantly boosting deployment in transportation hubs and along highways.
- EV Adoption Rates: Regions with higher EV sales naturally see a greater demand for fast charging. Countries like Norway, with over 80% of new car sales being electric, necessitate extensive Level 3 charging networks.
- Investment Trends: Major energy companies, automakers, and charging infrastructure providers are making multi-billion dollar investments to expand their networks. Companies like Siemens and Efacec are actively involved in large-scale infrastructure projects.
- Technological Advancements: The development of higher-power chargers (e.g., 350 kW and above) that can significantly reduce charging times is crucial for segments like transportation hubs, where rapid turnaround is essential.
- Urban Planning and Infrastructure Development: Cities are increasingly integrating EV charging into urban planning, designating prime locations in public parking areas and transportation hubs for fast chargers.
The dominance of these regions and segments is a testament to the strategic investments, supportive policies, and evolving consumer demands that are shaping the future of electric mobility.
Electric Vehicle Level 3 Fast Charger Product Innovations
Recent product innovations in the electric vehicle Level 3 fast charger market are centered around increasing power output, enhancing interoperability, and improving user experience. Manufacturers are pushing the boundaries of charging speeds, with new models capable of delivering over 350 kW, enabling EVs to gain hundreds of miles of range in under 15 minutes. This relentless pursuit of faster charging addresses a key consumer concern. Innovations in Combined Charging System (CCS) technology are leading to more efficient power delivery and better thermal management, crucial for sustained high-power charging. Furthermore, the development of modular charger designs allows for scalability and easier maintenance, reducing total cost of ownership. Advancements in software integration are enabling smart charging features, grid services, and seamless payment processing.
Propelling Factors for Electric Vehicle Level 3 Fast Charger Growth
The exponential growth of the electric vehicle Level 3 fast charger market is propelled by a synergistic interplay of technological, economic, and regulatory forces. Technologically, the continuous enhancement of charging speeds, moving from 50kW to 350kW and beyond, directly addresses range anxiety and charging time concerns. Economically, the declining cost of EV batteries and the increasing demand for EVs are creating a larger addressable market for charging infrastructure. Government mandates and incentives, such as tax credits for charger installation and the establishment of charging network targets (e.g., the US National Electric Vehicle Infrastructure Formula Program), are critical economic catalysts. Furthermore, the growing awareness of climate change and the desire for sustainable transportation solutions are driving consumer adoption, further fueling the need for ubiquitous fast charging.
Obstacles in the Electric Vehicle Level 3 Fast Charger Market
Despite its robust growth, the electric vehicle Level 3 fast charger market faces several significant obstacles. The high upfront cost of installing Level 3 chargers remains a substantial barrier, particularly for smaller businesses and in less densely populated areas. Grid infrastructure limitations can also pose a challenge; upgrading local power grids to support the high power demands of multiple fast chargers requires significant investment and time. Regulatory hurdles and the complexity of obtaining permits for charger installation can cause delays and increase project costs. Furthermore, the ongoing supply chain disruptions for critical components, such as semiconductors and power electronics, can impact production timelines and increase manufacturing expenses. Ensuring interoperability and standardisation across different charging connector types and payment systems is also an ongoing challenge that can create friction for consumers.
Future Opportunities in Electric Vehicle Level 3 Fast Charger
Emerging opportunities in the electric vehicle Level 3 fast charger market are vast and varied. The expansion of fast charging infrastructure into underserved rural areas and along less-traveled freight corridors presents significant growth potential. The development of ultra-high power charging solutions (e.g., 500kW and above) for heavy-duty electric trucks and buses is a burgeoning segment. The integration of battery storage systems with Level 3 chargers offers opportunities for grid stabilization, peak shaving, and new revenue streams through energy arbitrage and ancillary services. The growing trend towards autonomous vehicles will also necessitate the development of advanced, automated charging solutions. Furthermore, the potential for bidirectional charging (V2G) opens up new economic models where EVs can act as mobile power sources for buildings or the grid.
Major Players in the Electric Vehicle Level 3 Fast Charger Ecosystem
- TELD
- ABB
- Star Charge
- XJ Electric
- Tritium Pty Ltd
- TESLA
- ChargePoint
- Efacec
- Schneider Electric
- Wanma
- Siemens
- BTC Power
Key Developments in Electric Vehicle Level 3 Fast Charger Industry
- 2023/01: ABB launches its Terra 360 charger, offering up to 360 kW charging power, further accelerating charge times for electric vehicles.
- 2023/03: Tritium Pty Ltd announces significant expansion of its manufacturing capacity to meet growing global demand for its fast chargers.
- 2023/06: Tesla opens its Supercharger network to non-Tesla EVs in select European countries, signaling a move towards greater interoperability.
- 2023/08: ChargePoint announces strategic partnerships to expand its Level 3 charging network along major transportation routes in North America.
- 2023/10: Siemens introduces new modular DC fast charging solutions designed for flexibility and scalability.
- 2024/01: TELD announces plans to deploy a significant number of high-power fast chargers in urban areas across Asia.
- 2024/03: Star Charge collaborates with automakers to integrate its fast charging technology into new EV models.
- 2024/05: The Biden-Harris Administration announces new initiatives and funding to accelerate the build-out of a national EV charging network, boosting demand for Level 3 chargers.
- 2024/07: Efacec secures a major contract to supply Level 3 chargers for public charging infrastructure projects in Europe.
- 2024/09: Wanma invests in R&D for next-generation ultra-fast charging technologies.
- 2024/11: BTC Power introduces enhanced safety features and user interface improvements for its fast charging stations.
Strategic Electric Vehicle Level 3 Fast Charger Market Forecast
The strategic forecast for the electric vehicle Level 3 fast charger market is overwhelmingly positive, driven by the accelerating global transition to electric mobility. Continued government support, coupled with significant private sector investment, will be instrumental in expanding charging infrastructure, particularly in underserved regions and along key transportation corridors. Technological advancements, such as the development of higher-power charging solutions and the integration of smart grid capabilities, will further enhance the appeal and efficiency of Level 3 chargers. As EV adoption rates continue to soar, the demand for convenient and rapid charging will remain a critical factor, solidifying the indispensable role of Level 3 fast chargers in shaping the future of transportation.
Electric Vehicle Level 3 Fast Charger Segmentation
-
1. Application
- 1.1. Transportation Hub
- 1.2. Public Parking
- 1.3. Others
-
2. Type
- 2.1. Combined Charging System (CCS)
- 2.2. CHAdeMO
- 2.3. Tesla Supercharger
- 2.4. GB/T
Electric Vehicle Level 3 Fast Charger Segmentation By Geography
-
1. North America
- 1.1. United States
- 1.2. Canada
- 1.3. Mexico
-
2. South America
- 2.1. Brazil
- 2.2. Argentina
- 2.3. Rest of South America
-
3. Europe
- 3.1. United Kingdom
- 3.2. Germany
- 3.3. France
- 3.4. Italy
- 3.5. Spain
- 3.6. Russia
- 3.7. Benelux
- 3.8. Nordics
- 3.9. Rest of Europe
-
4. Middle East & Africa
- 4.1. Turkey
- 4.2. Israel
- 4.3. GCC
- 4.4. North Africa
- 4.5. South Africa
- 4.6. Rest of Middle East & Africa
-
5. Asia Pacific
- 5.1. China
- 5.2. India
- 5.3. Japan
- 5.4. South Korea
- 5.5. ASEAN
- 5.6. Oceania
- 5.7. Rest of Asia Pacific
Electric Vehicle Level 3 Fast Charger Regional Market Share
Geographic Coverage of Electric Vehicle Level 3 Fast Charger
Electric Vehicle Level 3 Fast Charger REPORT HIGHLIGHTS
| Aspects | Details |
|---|---|
| Study Period | 2020-2034 |
| Base Year | 2025 |
| Estimated Year | 2026 |
| Forecast Period | 2026-2034 |
| Historical Period | 2020-2025 |
| Growth Rate | CAGR of 27.2% from 2020-2034 |
| Segmentation |
|
Table of Contents
- 1. Introduction
- 1.1. Research Scope
- 1.2. Market Segmentation
- 1.3. Research Methodology
- 1.4. Definitions and Assumptions
- 2. Executive Summary
- 2.1. Introduction
- 3. Market Dynamics
- 3.1. Introduction
- 3.2. Market Drivers
- 3.3. Market Restrains
- 3.4. Market Trends
- 4. Market Factor Analysis
- 4.1. Porters Five Forces
- 4.2. Supply/Value Chain
- 4.3. PESTEL analysis
- 4.4. Market Entropy
- 4.5. Patent/Trademark Analysis
- 5. Global Electric Vehicle Level 3 Fast Charger Analysis, Insights and Forecast, 2020-2032
- 5.1. Market Analysis, Insights and Forecast - by Application
- 5.1.1. Transportation Hub
- 5.1.2. Public Parking
- 5.1.3. Others
- 5.2. Market Analysis, Insights and Forecast - by Type
- 5.2.1. Combined Charging System (CCS)
- 5.2.2. CHAdeMO
- 5.2.3. Tesla Supercharger
- 5.2.4. GB/T
- 5.3. Market Analysis, Insights and Forecast - by Region
- 5.3.1. North America
- 5.3.2. South America
- 5.3.3. Europe
- 5.3.4. Middle East & Africa
- 5.3.5. Asia Pacific
- 5.1. Market Analysis, Insights and Forecast - by Application
- 6. North America Electric Vehicle Level 3 Fast Charger Analysis, Insights and Forecast, 2020-2032
- 6.1. Market Analysis, Insights and Forecast - by Application
- 6.1.1. Transportation Hub
- 6.1.2. Public Parking
- 6.1.3. Others
- 6.2. Market Analysis, Insights and Forecast - by Type
- 6.2.1. Combined Charging System (CCS)
- 6.2.2. CHAdeMO
- 6.2.3. Tesla Supercharger
- 6.2.4. GB/T
- 6.1. Market Analysis, Insights and Forecast - by Application
- 7. South America Electric Vehicle Level 3 Fast Charger Analysis, Insights and Forecast, 2020-2032
- 7.1. Market Analysis, Insights and Forecast - by Application
- 7.1.1. Transportation Hub
- 7.1.2. Public Parking
- 7.1.3. Others
- 7.2. Market Analysis, Insights and Forecast - by Type
- 7.2.1. Combined Charging System (CCS)
- 7.2.2. CHAdeMO
- 7.2.3. Tesla Supercharger
- 7.2.4. GB/T
- 7.1. Market Analysis, Insights and Forecast - by Application
- 8. Europe Electric Vehicle Level 3 Fast Charger Analysis, Insights and Forecast, 2020-2032
- 8.1. Market Analysis, Insights and Forecast - by Application
- 8.1.1. Transportation Hub
- 8.1.2. Public Parking
- 8.1.3. Others
- 8.2. Market Analysis, Insights and Forecast - by Type
- 8.2.1. Combined Charging System (CCS)
- 8.2.2. CHAdeMO
- 8.2.3. Tesla Supercharger
- 8.2.4. GB/T
- 8.1. Market Analysis, Insights and Forecast - by Application
- 9. Middle East & Africa Electric Vehicle Level 3 Fast Charger Analysis, Insights and Forecast, 2020-2032
- 9.1. Market Analysis, Insights and Forecast - by Application
- 9.1.1. Transportation Hub
- 9.1.2. Public Parking
- 9.1.3. Others
- 9.2. Market Analysis, Insights and Forecast - by Type
- 9.2.1. Combined Charging System (CCS)
- 9.2.2. CHAdeMO
- 9.2.3. Tesla Supercharger
- 9.2.4. GB/T
- 9.1. Market Analysis, Insights and Forecast - by Application
- 10. Asia Pacific Electric Vehicle Level 3 Fast Charger Analysis, Insights and Forecast, 2020-2032
- 10.1. Market Analysis, Insights and Forecast - by Application
- 10.1.1. Transportation Hub
- 10.1.2. Public Parking
- 10.1.3. Others
- 10.2. Market Analysis, Insights and Forecast - by Type
- 10.2.1. Combined Charging System (CCS)
- 10.2.2. CHAdeMO
- 10.2.3. Tesla Supercharger
- 10.2.4. GB/T
- 10.1. Market Analysis, Insights and Forecast - by Application
- 11. Competitive Analysis
- 11.1. Global Market Share Analysis 2025
- 11.2. Company Profiles
- 11.2.1 TELD
- 11.2.1.1. Overview
- 11.2.1.2. Products
- 11.2.1.3. SWOT Analysis
- 11.2.1.4. Recent Developments
- 11.2.1.5. Financials (Based on Availability)
- 11.2.2 ABB
- 11.2.2.1. Overview
- 11.2.2.2. Products
- 11.2.2.3. SWOT Analysis
- 11.2.2.4. Recent Developments
- 11.2.2.5. Financials (Based on Availability)
- 11.2.3 Star Charge
- 11.2.3.1. Overview
- 11.2.3.2. Products
- 11.2.3.3. SWOT Analysis
- 11.2.3.4. Recent Developments
- 11.2.3.5. Financials (Based on Availability)
- 11.2.4 XJ Electric
- 11.2.4.1. Overview
- 11.2.4.2. Products
- 11.2.4.3. SWOT Analysis
- 11.2.4.4. Recent Developments
- 11.2.4.5. Financials (Based on Availability)
- 11.2.5 Tritium Pty Ltd
- 11.2.5.1. Overview
- 11.2.5.2. Products
- 11.2.5.3. SWOT Analysis
- 11.2.5.4. Recent Developments
- 11.2.5.5. Financials (Based on Availability)
- 11.2.6 TESLA
- 11.2.6.1. Overview
- 11.2.6.2. Products
- 11.2.6.3. SWOT Analysis
- 11.2.6.4. Recent Developments
- 11.2.6.5. Financials (Based on Availability)
- 11.2.7 ChargePoint
- 11.2.7.1. Overview
- 11.2.7.2. Products
- 11.2.7.3. SWOT Analysis
- 11.2.7.4. Recent Developments
- 11.2.7.5. Financials (Based on Availability)
- 11.2.8 Efacec
- 11.2.8.1. Overview
- 11.2.8.2. Products
- 11.2.8.3. SWOT Analysis
- 11.2.8.4. Recent Developments
- 11.2.8.5. Financials (Based on Availability)
- 11.2.9 Schneider Electric
- 11.2.9.1. Overview
- 11.2.9.2. Products
- 11.2.9.3. SWOT Analysis
- 11.2.9.4. Recent Developments
- 11.2.9.5. Financials (Based on Availability)
- 11.2.10 Wanma
- 11.2.10.1. Overview
- 11.2.10.2. Products
- 11.2.10.3. SWOT Analysis
- 11.2.10.4. Recent Developments
- 11.2.10.5. Financials (Based on Availability)
- 11.2.11 Siemens
- 11.2.11.1. Overview
- 11.2.11.2. Products
- 11.2.11.3. SWOT Analysis
- 11.2.11.4. Recent Developments
- 11.2.11.5. Financials (Based on Availability)
- 11.2.12 BTC Power
- 11.2.12.1. Overview
- 11.2.12.2. Products
- 11.2.12.3. SWOT Analysis
- 11.2.12.4. Recent Developments
- 11.2.12.5. Financials (Based on Availability)
- 11.2.1 TELD
List of Figures
- Figure 1: Global Electric Vehicle Level 3 Fast Charger Revenue Breakdown (million, %) by Region 2025 & 2033
- Figure 2: Global Electric Vehicle Level 3 Fast Charger Volume Breakdown (K, %) by Region 2025 & 2033
- Figure 3: North America Electric Vehicle Level 3 Fast Charger Revenue (million), by Application 2025 & 2033
- Figure 4: North America Electric Vehicle Level 3 Fast Charger Volume (K), by Application 2025 & 2033
- Figure 5: North America Electric Vehicle Level 3 Fast Charger Revenue Share (%), by Application 2025 & 2033
- Figure 6: North America Electric Vehicle Level 3 Fast Charger Volume Share (%), by Application 2025 & 2033
- Figure 7: North America Electric Vehicle Level 3 Fast Charger Revenue (million), by Type 2025 & 2033
- Figure 8: North America Electric Vehicle Level 3 Fast Charger Volume (K), by Type 2025 & 2033
- Figure 9: North America Electric Vehicle Level 3 Fast Charger Revenue Share (%), by Type 2025 & 2033
- Figure 10: North America Electric Vehicle Level 3 Fast Charger Volume Share (%), by Type 2025 & 2033
- Figure 11: North America Electric Vehicle Level 3 Fast Charger Revenue (million), by Country 2025 & 2033
- Figure 12: North America Electric Vehicle Level 3 Fast Charger Volume (K), by Country 2025 & 2033
- Figure 13: North America Electric Vehicle Level 3 Fast Charger Revenue Share (%), by Country 2025 & 2033
- Figure 14: North America Electric Vehicle Level 3 Fast Charger Volume Share (%), by Country 2025 & 2033
- Figure 15: South America Electric Vehicle Level 3 Fast Charger Revenue (million), by Application 2025 & 2033
- Figure 16: South America Electric Vehicle Level 3 Fast Charger Volume (K), by Application 2025 & 2033
- Figure 17: South America Electric Vehicle Level 3 Fast Charger Revenue Share (%), by Application 2025 & 2033
- Figure 18: South America Electric Vehicle Level 3 Fast Charger Volume Share (%), by Application 2025 & 2033
- Figure 19: South America Electric Vehicle Level 3 Fast Charger Revenue (million), by Type 2025 & 2033
- Figure 20: South America Electric Vehicle Level 3 Fast Charger Volume (K), by Type 2025 & 2033
- Figure 21: South America Electric Vehicle Level 3 Fast Charger Revenue Share (%), by Type 2025 & 2033
- Figure 22: South America Electric Vehicle Level 3 Fast Charger Volume Share (%), by Type 2025 & 2033
- Figure 23: South America Electric Vehicle Level 3 Fast Charger Revenue (million), by Country 2025 & 2033
- Figure 24: South America Electric Vehicle Level 3 Fast Charger Volume (K), by Country 2025 & 2033
- Figure 25: South America Electric Vehicle Level 3 Fast Charger Revenue Share (%), by Country 2025 & 2033
- Figure 26: South America Electric Vehicle Level 3 Fast Charger Volume Share (%), by Country 2025 & 2033
- Figure 27: Europe Electric Vehicle Level 3 Fast Charger Revenue (million), by Application 2025 & 2033
- Figure 28: Europe Electric Vehicle Level 3 Fast Charger Volume (K), by Application 2025 & 2033
- Figure 29: Europe Electric Vehicle Level 3 Fast Charger Revenue Share (%), by Application 2025 & 2033
- Figure 30: Europe Electric Vehicle Level 3 Fast Charger Volume Share (%), by Application 2025 & 2033
- Figure 31: Europe Electric Vehicle Level 3 Fast Charger Revenue (million), by Type 2025 & 2033
- Figure 32: Europe Electric Vehicle Level 3 Fast Charger Volume (K), by Type 2025 & 2033
- Figure 33: Europe Electric Vehicle Level 3 Fast Charger Revenue Share (%), by Type 2025 & 2033
- Figure 34: Europe Electric Vehicle Level 3 Fast Charger Volume Share (%), by Type 2025 & 2033
- Figure 35: Europe Electric Vehicle Level 3 Fast Charger Revenue (million), by Country 2025 & 2033
- Figure 36: Europe Electric Vehicle Level 3 Fast Charger Volume (K), by Country 2025 & 2033
- Figure 37: Europe Electric Vehicle Level 3 Fast Charger Revenue Share (%), by Country 2025 & 2033
- Figure 38: Europe Electric Vehicle Level 3 Fast Charger Volume Share (%), by Country 2025 & 2033
- Figure 39: Middle East & Africa Electric Vehicle Level 3 Fast Charger Revenue (million), by Application 2025 & 2033
- Figure 40: Middle East & Africa Electric Vehicle Level 3 Fast Charger Volume (K), by Application 2025 & 2033
- Figure 41: Middle East & Africa Electric Vehicle Level 3 Fast Charger Revenue Share (%), by Application 2025 & 2033
- Figure 42: Middle East & Africa Electric Vehicle Level 3 Fast Charger Volume Share (%), by Application 2025 & 2033
- Figure 43: Middle East & Africa Electric Vehicle Level 3 Fast Charger Revenue (million), by Type 2025 & 2033
- Figure 44: Middle East & Africa Electric Vehicle Level 3 Fast Charger Volume (K), by Type 2025 & 2033
- Figure 45: Middle East & Africa Electric Vehicle Level 3 Fast Charger Revenue Share (%), by Type 2025 & 2033
- Figure 46: Middle East & Africa Electric Vehicle Level 3 Fast Charger Volume Share (%), by Type 2025 & 2033
- Figure 47: Middle East & Africa Electric Vehicle Level 3 Fast Charger Revenue (million), by Country 2025 & 2033
- Figure 48: Middle East & Africa Electric Vehicle Level 3 Fast Charger Volume (K), by Country 2025 & 2033
- Figure 49: Middle East & Africa Electric Vehicle Level 3 Fast Charger Revenue Share (%), by Country 2025 & 2033
- Figure 50: Middle East & Africa Electric Vehicle Level 3 Fast Charger Volume Share (%), by Country 2025 & 2033
- Figure 51: Asia Pacific Electric Vehicle Level 3 Fast Charger Revenue (million), by Application 2025 & 2033
- Figure 52: Asia Pacific Electric Vehicle Level 3 Fast Charger Volume (K), by Application 2025 & 2033
- Figure 53: Asia Pacific Electric Vehicle Level 3 Fast Charger Revenue Share (%), by Application 2025 & 2033
- Figure 54: Asia Pacific Electric Vehicle Level 3 Fast Charger Volume Share (%), by Application 2025 & 2033
- Figure 55: Asia Pacific Electric Vehicle Level 3 Fast Charger Revenue (million), by Type 2025 & 2033
- Figure 56: Asia Pacific Electric Vehicle Level 3 Fast Charger Volume (K), by Type 2025 & 2033
- Figure 57: Asia Pacific Electric Vehicle Level 3 Fast Charger Revenue Share (%), by Type 2025 & 2033
- Figure 58: Asia Pacific Electric Vehicle Level 3 Fast Charger Volume Share (%), by Type 2025 & 2033
- Figure 59: Asia Pacific Electric Vehicle Level 3 Fast Charger Revenue (million), by Country 2025 & 2033
- Figure 60: Asia Pacific Electric Vehicle Level 3 Fast Charger Volume (K), by Country 2025 & 2033
- Figure 61: Asia Pacific Electric Vehicle Level 3 Fast Charger Revenue Share (%), by Country 2025 & 2033
- Figure 62: Asia Pacific Electric Vehicle Level 3 Fast Charger Volume Share (%), by Country 2025 & 2033
List of Tables
- Table 1: Global Electric Vehicle Level 3 Fast Charger Revenue million Forecast, by Application 2020 & 2033
- Table 2: Global Electric Vehicle Level 3 Fast Charger Volume K Forecast, by Application 2020 & 2033
- Table 3: Global Electric Vehicle Level 3 Fast Charger Revenue million Forecast, by Type 2020 & 2033
- Table 4: Global Electric Vehicle Level 3 Fast Charger Volume K Forecast, by Type 2020 & 2033
- Table 5: Global Electric Vehicle Level 3 Fast Charger Revenue million Forecast, by Region 2020 & 2033
- Table 6: Global Electric Vehicle Level 3 Fast Charger Volume K Forecast, by Region 2020 & 2033
- Table 7: Global Electric Vehicle Level 3 Fast Charger Revenue million Forecast, by Application 2020 & 2033
- Table 8: Global Electric Vehicle Level 3 Fast Charger Volume K Forecast, by Application 2020 & 2033
- Table 9: Global Electric Vehicle Level 3 Fast Charger Revenue million Forecast, by Type 2020 & 2033
- Table 10: Global Electric Vehicle Level 3 Fast Charger Volume K Forecast, by Type 2020 & 2033
- Table 11: Global Electric Vehicle Level 3 Fast Charger Revenue million Forecast, by Country 2020 & 2033
- Table 12: Global Electric Vehicle Level 3 Fast Charger Volume K Forecast, by Country 2020 & 2033
- Table 13: United States Electric Vehicle Level 3 Fast Charger Revenue (million) Forecast, by Application 2020 & 2033
- Table 14: United States Electric Vehicle Level 3 Fast Charger Volume (K) Forecast, by Application 2020 & 2033
- Table 15: Canada Electric Vehicle Level 3 Fast Charger Revenue (million) Forecast, by Application 2020 & 2033
- Table 16: Canada Electric Vehicle Level 3 Fast Charger Volume (K) Forecast, by Application 2020 & 2033
- Table 17: Mexico Electric Vehicle Level 3 Fast Charger Revenue (million) Forecast, by Application 2020 & 2033
- Table 18: Mexico Electric Vehicle Level 3 Fast Charger Volume (K) Forecast, by Application 2020 & 2033
- Table 19: Global Electric Vehicle Level 3 Fast Charger Revenue million Forecast, by Application 2020 & 2033
- Table 20: Global Electric Vehicle Level 3 Fast Charger Volume K Forecast, by Application 2020 & 2033
- Table 21: Global Electric Vehicle Level 3 Fast Charger Revenue million Forecast, by Type 2020 & 2033
- Table 22: Global Electric Vehicle Level 3 Fast Charger Volume K Forecast, by Type 2020 & 2033
- Table 23: Global Electric Vehicle Level 3 Fast Charger Revenue million Forecast, by Country 2020 & 2033
- Table 24: Global Electric Vehicle Level 3 Fast Charger Volume K Forecast, by Country 2020 & 2033
- Table 25: Brazil Electric Vehicle Level 3 Fast Charger Revenue (million) Forecast, by Application 2020 & 2033
- Table 26: Brazil Electric Vehicle Level 3 Fast Charger Volume (K) Forecast, by Application 2020 & 2033
- Table 27: Argentina Electric Vehicle Level 3 Fast Charger Revenue (million) Forecast, by Application 2020 & 2033
- Table 28: Argentina Electric Vehicle Level 3 Fast Charger Volume (K) Forecast, by Application 2020 & 2033
- Table 29: Rest of South America Electric Vehicle Level 3 Fast Charger Revenue (million) Forecast, by Application 2020 & 2033
- Table 30: Rest of South America Electric Vehicle Level 3 Fast Charger Volume (K) Forecast, by Application 2020 & 2033
- Table 31: Global Electric Vehicle Level 3 Fast Charger Revenue million Forecast, by Application 2020 & 2033
- Table 32: Global Electric Vehicle Level 3 Fast Charger Volume K Forecast, by Application 2020 & 2033
- Table 33: Global Electric Vehicle Level 3 Fast Charger Revenue million Forecast, by Type 2020 & 2033
- Table 34: Global Electric Vehicle Level 3 Fast Charger Volume K Forecast, by Type 2020 & 2033
- Table 35: Global Electric Vehicle Level 3 Fast Charger Revenue million Forecast, by Country 2020 & 2033
- Table 36: Global Electric Vehicle Level 3 Fast Charger Volume K Forecast, by Country 2020 & 2033
- Table 37: United Kingdom Electric Vehicle Level 3 Fast Charger Revenue (million) Forecast, by Application 2020 & 2033
- Table 38: United Kingdom Electric Vehicle Level 3 Fast Charger Volume (K) Forecast, by Application 2020 & 2033
- Table 39: Germany Electric Vehicle Level 3 Fast Charger Revenue (million) Forecast, by Application 2020 & 2033
- Table 40: Germany Electric Vehicle Level 3 Fast Charger Volume (K) Forecast, by Application 2020 & 2033
- Table 41: France Electric Vehicle Level 3 Fast Charger Revenue (million) Forecast, by Application 2020 & 2033
- Table 42: France Electric Vehicle Level 3 Fast Charger Volume (K) Forecast, by Application 2020 & 2033
- Table 43: Italy Electric Vehicle Level 3 Fast Charger Revenue (million) Forecast, by Application 2020 & 2033
- Table 44: Italy Electric Vehicle Level 3 Fast Charger Volume (K) Forecast, by Application 2020 & 2033
- Table 45: Spain Electric Vehicle Level 3 Fast Charger Revenue (million) Forecast, by Application 2020 & 2033
- Table 46: Spain Electric Vehicle Level 3 Fast Charger Volume (K) Forecast, by Application 2020 & 2033
- Table 47: Russia Electric Vehicle Level 3 Fast Charger Revenue (million) Forecast, by Application 2020 & 2033
- Table 48: Russia Electric Vehicle Level 3 Fast Charger Volume (K) Forecast, by Application 2020 & 2033
- Table 49: Benelux Electric Vehicle Level 3 Fast Charger Revenue (million) Forecast, by Application 2020 & 2033
- Table 50: Benelux Electric Vehicle Level 3 Fast Charger Volume (K) Forecast, by Application 2020 & 2033
- Table 51: Nordics Electric Vehicle Level 3 Fast Charger Revenue (million) Forecast, by Application 2020 & 2033
- Table 52: Nordics Electric Vehicle Level 3 Fast Charger Volume (K) Forecast, by Application 2020 & 2033
- Table 53: Rest of Europe Electric Vehicle Level 3 Fast Charger Revenue (million) Forecast, by Application 2020 & 2033
- Table 54: Rest of Europe Electric Vehicle Level 3 Fast Charger Volume (K) Forecast, by Application 2020 & 2033
- Table 55: Global Electric Vehicle Level 3 Fast Charger Revenue million Forecast, by Application 2020 & 2033
- Table 56: Global Electric Vehicle Level 3 Fast Charger Volume K Forecast, by Application 2020 & 2033
- Table 57: Global Electric Vehicle Level 3 Fast Charger Revenue million Forecast, by Type 2020 & 2033
- Table 58: Global Electric Vehicle Level 3 Fast Charger Volume K Forecast, by Type 2020 & 2033
- Table 59: Global Electric Vehicle Level 3 Fast Charger Revenue million Forecast, by Country 2020 & 2033
- Table 60: Global Electric Vehicle Level 3 Fast Charger Volume K Forecast, by Country 2020 & 2033
- Table 61: Turkey Electric Vehicle Level 3 Fast Charger Revenue (million) Forecast, by Application 2020 & 2033
- Table 62: Turkey Electric Vehicle Level 3 Fast Charger Volume (K) Forecast, by Application 2020 & 2033
- Table 63: Israel Electric Vehicle Level 3 Fast Charger Revenue (million) Forecast, by Application 2020 & 2033
- Table 64: Israel Electric Vehicle Level 3 Fast Charger Volume (K) Forecast, by Application 2020 & 2033
- Table 65: GCC Electric Vehicle Level 3 Fast Charger Revenue (million) Forecast, by Application 2020 & 2033
- Table 66: GCC Electric Vehicle Level 3 Fast Charger Volume (K) Forecast, by Application 2020 & 2033
- Table 67: North Africa Electric Vehicle Level 3 Fast Charger Revenue (million) Forecast, by Application 2020 & 2033
- Table 68: North Africa Electric Vehicle Level 3 Fast Charger Volume (K) Forecast, by Application 2020 & 2033
- Table 69: South Africa Electric Vehicle Level 3 Fast Charger Revenue (million) Forecast, by Application 2020 & 2033
- Table 70: South Africa Electric Vehicle Level 3 Fast Charger Volume (K) Forecast, by Application 2020 & 2033
- Table 71: Rest of Middle East & Africa Electric Vehicle Level 3 Fast Charger Revenue (million) Forecast, by Application 2020 & 2033
- Table 72: Rest of Middle East & Africa Electric Vehicle Level 3 Fast Charger Volume (K) Forecast, by Application 2020 & 2033
- Table 73: Global Electric Vehicle Level 3 Fast Charger Revenue million Forecast, by Application 2020 & 2033
- Table 74: Global Electric Vehicle Level 3 Fast Charger Volume K Forecast, by Application 2020 & 2033
- Table 75: Global Electric Vehicle Level 3 Fast Charger Revenue million Forecast, by Type 2020 & 2033
- Table 76: Global Electric Vehicle Level 3 Fast Charger Volume K Forecast, by Type 2020 & 2033
- Table 77: Global Electric Vehicle Level 3 Fast Charger Revenue million Forecast, by Country 2020 & 2033
- Table 78: Global Electric Vehicle Level 3 Fast Charger Volume K Forecast, by Country 2020 & 2033
- Table 79: China Electric Vehicle Level 3 Fast Charger Revenue (million) Forecast, by Application 2020 & 2033
- Table 80: China Electric Vehicle Level 3 Fast Charger Volume (K) Forecast, by Application 2020 & 2033
- Table 81: India Electric Vehicle Level 3 Fast Charger Revenue (million) Forecast, by Application 2020 & 2033
- Table 82: India Electric Vehicle Level 3 Fast Charger Volume (K) Forecast, by Application 2020 & 2033
- Table 83: Japan Electric Vehicle Level 3 Fast Charger Revenue (million) Forecast, by Application 2020 & 2033
- Table 84: Japan Electric Vehicle Level 3 Fast Charger Volume (K) Forecast, by Application 2020 & 2033
- Table 85: South Korea Electric Vehicle Level 3 Fast Charger Revenue (million) Forecast, by Application 2020 & 2033
- Table 86: South Korea Electric Vehicle Level 3 Fast Charger Volume (K) Forecast, by Application 2020 & 2033
- Table 87: ASEAN Electric Vehicle Level 3 Fast Charger Revenue (million) Forecast, by Application 2020 & 2033
- Table 88: ASEAN Electric Vehicle Level 3 Fast Charger Volume (K) Forecast, by Application 2020 & 2033
- Table 89: Oceania Electric Vehicle Level 3 Fast Charger Revenue (million) Forecast, by Application 2020 & 2033
- Table 90: Oceania Electric Vehicle Level 3 Fast Charger Volume (K) Forecast, by Application 2020 & 2033
- Table 91: Rest of Asia Pacific Electric Vehicle Level 3 Fast Charger Revenue (million) Forecast, by Application 2020 & 2033
- Table 92: Rest of Asia Pacific Electric Vehicle Level 3 Fast Charger Volume (K) Forecast, by Application 2020 & 2033
Frequently Asked Questions
1. What is the projected Compound Annual Growth Rate (CAGR) of the Electric Vehicle Level 3 Fast Charger?
The projected CAGR is approximately 27.2%.
2. Which companies are prominent players in the Electric Vehicle Level 3 Fast Charger?
Key companies in the market include TELD, ABB, Star Charge, XJ Electric, Tritium Pty Ltd, TESLA, ChargePoint, Efacec, Schneider Electric, Wanma, Siemens, BTC Power.
3. What are the main segments of the Electric Vehicle Level 3 Fast Charger?
The market segments include Application, Type.
4. Can you provide details about the market size?
The market size is estimated to be USD 21030 million as of 2022.
5. What are some drivers contributing to market growth?
N/A
6. What are the notable trends driving market growth?
N/A
7. Are there any restraints impacting market growth?
N/A
8. Can you provide examples of recent developments in the market?
N/A
9. What pricing options are available for accessing the report?
Pricing options include single-user, multi-user, and enterprise licenses priced at USD 3950.00, USD 5925.00, and USD 7900.00 respectively.
10. Is the market size provided in terms of value or volume?
The market size is provided in terms of value, measured in million and volume, measured in K.
11. Are there any specific market keywords associated with the report?
Yes, the market keyword associated with the report is "Electric Vehicle Level 3 Fast Charger," which aids in identifying and referencing the specific market segment covered.
12. How do I determine which pricing option suits my needs best?
The pricing options vary based on user requirements and access needs. Individual users may opt for single-user licenses, while businesses requiring broader access may choose multi-user or enterprise licenses for cost-effective access to the report.
13. Are there any additional resources or data provided in the Electric Vehicle Level 3 Fast Charger report?
While the report offers comprehensive insights, it's advisable to review the specific contents or supplementary materials provided to ascertain if additional resources or data are available.
14. How can I stay updated on further developments or reports in the Electric Vehicle Level 3 Fast Charger?
To stay informed about further developments, trends, and reports in the Electric Vehicle Level 3 Fast Charger, consider subscribing to industry newsletters, following relevant companies and organizations, or regularly checking reputable industry news sources and publications.
Methodology
Step 1 - Identification of Relevant Samples Size from Population Database


Step 2 - Approaches for Defining Global Market Size (Value, Volume* & Price*)

Note*: In applicable scenarios
Step 3 - Data Sources
Primary Research
- Web Analytics
- Survey Reports
- Research Institute
- Latest Research Reports
- Opinion Leaders
Secondary Research
- Annual Reports
- White Paper
- Latest Press Release
- Industry Association
- Paid Database
- Investor Presentations

Step 4 - Data Triangulation
Involves using different sources of information in order to increase the validity of a study
These sources are likely to be stakeholders in a program - participants, other researchers, program staff, other community members, and so on.
Then we put all data in single framework & apply various statistical tools to find out the dynamic on the market.
During the analysis stage, feedback from the stakeholder groups would be compared to determine areas of agreement as well as areas of divergence