

Key Insights
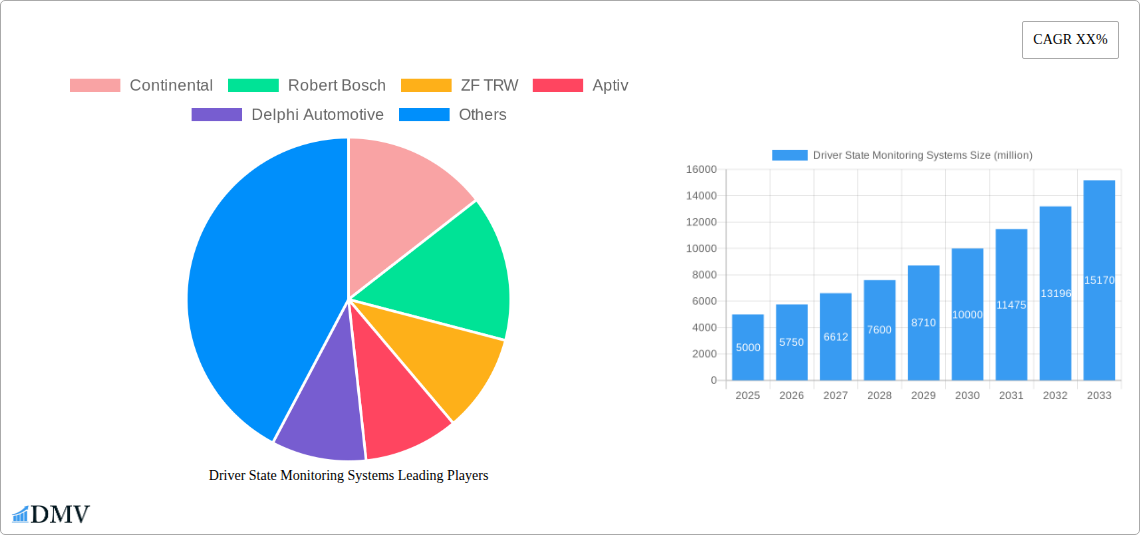
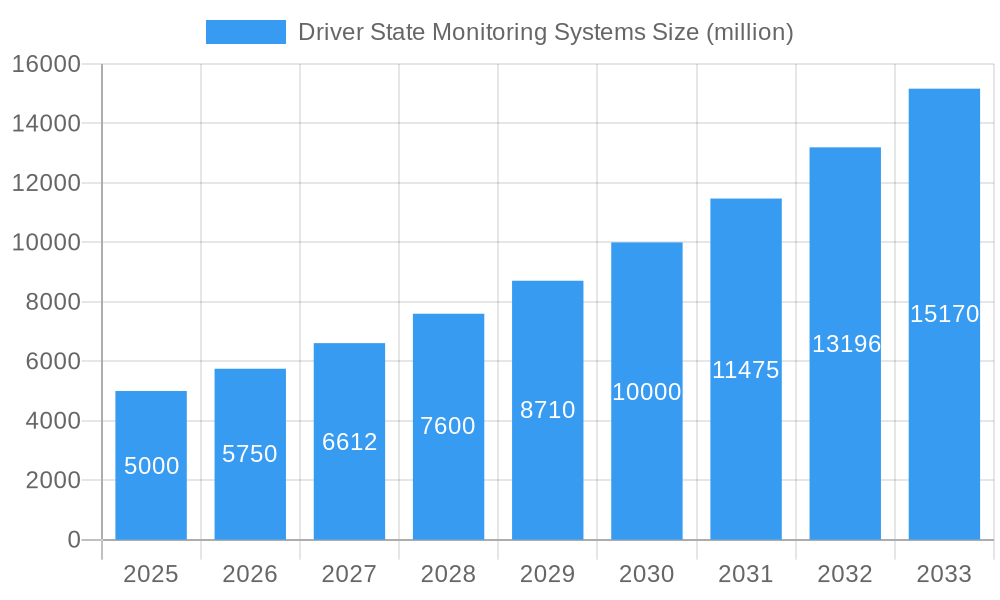
The Driver State Monitoring Systems (DSMS) market is experiencing robust growth, driven by increasing concerns over road safety and the rising adoption of Advanced Driver-Assistance Systems (ADAS) and autonomous vehicles. The market, estimated at $5 billion in 2025, is projected to exhibit a Compound Annual Growth Rate (CAGR) of 15% from 2025 to 2033, reaching approximately $15 billion by 2033. This growth is fueled by several key factors, including stringent government regulations mandating driver monitoring features in new vehicles, advancements in sensor technology leading to more accurate and reliable driver state detection, and the increasing affordability of DSMS components. Key market segments include passenger cars, commercial vehicles, and public transportation, with passenger cars currently dominating the market share. Leading players such as Continental, Bosch, and Aptiv are heavily investing in research and development, driving innovation in areas like eye-tracking, driver fatigue detection, and in-cabin monitoring systems. Competition is fierce, with companies focusing on developing more sophisticated and integrated solutions that offer improved accuracy, reliability, and cost-effectiveness.
Driver State Monitoring Systems Market Size (In Billion)
The restraints to market growth primarily involve the high initial investment costs associated with integrating DSMS into vehicles, concerns over data privacy and security related to driver monitoring, and the challenges in achieving consistent accuracy across varying environmental conditions and driver demographics. However, these challenges are gradually being addressed through technological advancements and collaborative efforts across the industry. The geographic distribution of the market is expected to be dominated by North America and Europe initially, followed by a steady rise in the Asia-Pacific region driven by increasing vehicle production and rising disposable incomes. Continued innovation in artificial intelligence (AI) and machine learning (ML) will play a critical role in enhancing the capabilities of DSMS, enabling more sophisticated driver behavior analysis and improved accident prevention capabilities in the future.
Driver State Monitoring Systems Company Market Share
Driver State Monitoring Systems Market Report: 2019-2033
This comprehensive report provides an in-depth analysis of the global Driver State Monitoring Systems (DSMS) market, projecting a market value exceeding $XX million by 2033. The study period covers 2019-2033, with 2025 serving as both the base and estimated year. This report is crucial for stakeholders seeking to understand market dynamics, technological advancements, and future opportunities within this rapidly evolving sector. Key players like Continental, Robert Bosch, ZF TRW, and Aptiv are analyzed, alongside emerging competitors, offering invaluable insights for strategic decision-making.
Driver State Monitoring Systems Market Composition & Trends
The global Driver State Monitoring Systems market, valued at $XX million in 2025, exhibits a moderately consolidated structure. Continental, Robert Bosch, and ZF TRW collectively hold a significant market share, exceeding XX%, while other players like Aptiv, Delphi Automotive, and Denso contribute significantly to the remaining market. Innovation is driven by advancements in AI, computer vision, and sensor technologies, leading to more accurate and reliable driver monitoring capabilities. Stringent safety regulations globally are accelerating DSMS adoption, particularly in passenger vehicles. Substitute products, such as advanced driver-assistance systems (ADAS), coexist and even complement DSMS, creating a symbiotic relationship. End-users primarily include automotive manufacturers, Tier-1 suppliers, and aftermarket companies. M&A activity in the past five years has totaled approximately $XX million, with deals focusing on technology integration and expansion into new markets.
- Market Share Distribution (2025): Continental (XX%), Robert Bosch (XX%), ZF TRW (XX%), Others (XX%).
- M&A Deal Value (2019-2024): Approximately $XX million.
- Key Innovation Catalysts: AI, Computer Vision, Sensor Technology.
- Regulatory Landscape: Stringent safety standards driving adoption.
Driver State Monitoring Systems Industry Evolution
The DSMS market experienced robust growth during the historical period (2019-2024), with a CAGR of XX%. This growth is primarily fueled by the increasing demand for enhanced vehicle safety features and the rising adoption of autonomous driving technologies. Technological advancements, particularly in sensor fusion and machine learning algorithms, have significantly improved the accuracy and reliability of DSMS. Consumer demand for safer vehicles, coupled with government regulations mandating advanced driver-assistance systems, are further propelling market expansion. The forecast period (2025-2033) projects continued growth, with a projected CAGR of XX%, driven by the increasing integration of DSMS into various vehicle segments, including passenger cars, commercial vehicles, and even two-wheelers. Adoption rates are expected to increase significantly, with penetration exceeding XX% in key markets by 2033.
- Historical Growth (2019-2024): CAGR of XX%
- Forecast Growth (2025-2033): CAGR of XX%
- Projected Adoption Rate (2033): XX% in key markets
Leading Regions, Countries, or Segments in Driver State Monitoring Systems
North America currently dominates the global DSMS market, driven by stringent safety regulations, high vehicle ownership rates, and robust technological advancements. Europe follows closely, with a strong emphasis on advanced driver-assistance systems and autonomous vehicle development. Asia-Pacific is experiencing rapid growth, fuelled by increasing vehicle production and rising disposable incomes. The passenger vehicle segment holds the largest market share, followed by commercial vehicles.
- Key Drivers for North American Dominance: Stringent safety regulations, high vehicle ownership rates, technological innovation.
- Key Drivers for European Growth: Emphasis on ADAS and autonomous vehicle development.
- Key Drivers for Asia-Pacific Growth: Increasing vehicle production, rising disposable incomes.
Driver State Monitoring Systems Product Innovations
Recent product innovations focus on improving accuracy, reducing false positives, and integrating DSMS with other ADAS features. Advancements in sensor fusion, using combinations of cameras, radar, and lidar, enhance the reliability of driver state detection. The development of more sophisticated algorithms based on machine learning enables accurate recognition of driver drowsiness, distraction, and impairment. These innovations offer unique selling propositions by increasing the safety and reliability of vehicles, contributing to reduced accident rates and improved driver experience.
Propelling Factors for Driver State Monitoring Systems Growth
The growth of the DSMS market is driven by a confluence of factors. Stringent government regulations mandating advanced safety features are a primary driver, alongside the increasing consumer demand for safer vehicles. Technological advancements, particularly in AI and sensor technology, are leading to more accurate and reliable driver monitoring capabilities. Furthermore, the rising adoption of autonomous driving technologies creates a synergistic effect, increasing the demand for robust DSMS as a crucial safety component. Economic factors like rising disposable incomes in developing countries are also contributing to market growth.
Obstacles in the Driver State Monitoring Systems Market
Several factors hinder the growth of the DSMS market. High initial costs associated with implementing DSMS in vehicles can be a barrier for some manufacturers. Supply chain disruptions and the availability of critical components, such as advanced sensors and chips, can impact production and market availability. Intense competition among established players and emerging companies creates pricing pressure. Additionally, concerns regarding data privacy and security associated with driver monitoring data represent a significant challenge. These factors can collectively impact the market growth by reducing market penetration rates and increase the total cost of the DSMS systems.
Future Opportunities in Driver State Monitoring Systems
Future opportunities lie in expanding into new markets, particularly in developing countries with rising vehicle ownership rates. The integration of DSMS with other vehicle systems, such as infotainment and telematics, offers significant potential. Further technological advancements, such as the use of bio-sensing technologies to detect driver physiological states, present opportunities for enhanced accuracy and functionalities. Furthermore, the growing demand for autonomous vehicles will propel the demand for more sophisticated DSMS, increasing market potential.
Major Players in the Driver State Monitoring Systems Ecosystem
- Continental
- Robert Bosch
- ZF TRW
- Aptiv
- Delphi Automotive
- Aisin Seiki
- Denso
- Mobileye NV
- Visteon
- Tobii Technology
- Valeo
- Seeing MACHINE
- Ficosa International
Key Developments in Driver State Monitoring Systems Industry
- Q1 2023: Continental launched an advanced DSMS incorporating AI-powered drowsiness detection.
- Q3 2022: Robert Bosch and ZF TRW announced a strategic partnership to develop next-generation DSMS technology.
- Q4 2021: Mobileye released its EyeQ6 chip, significantly enhancing DSMS processing capabilities.
Strategic Driver State Monitoring Systems Market Forecast
The DSMS market is poised for continued significant growth over the forecast period. Driven by technological advancements, increasing regulatory pressures, and rising consumer demand for enhanced vehicle safety, the market is expected to experience robust expansion. New opportunities in emerging markets and the integration of DSMS with other vehicle systems will further fuel this growth, resulting in a substantial market size by 2033. The focus on improving accuracy, reducing costs, and enhancing data privacy will be key factors shaping future market dynamics.
Driver State Monitoring Systems Segmentation
-
1. Application
- 1.1. Passenger Car
- 1.2. LCV
- 1.3. HCV
-
2. Types
- 2.1. Heart Rate Monitoring
- 2.2. Facial Recognition
- 2.3. Others
Driver State Monitoring Systems Segmentation By Geography
-
1. North America
- 1.1. United States
- 1.2. Canada
- 1.3. Mexico
-
2. South America
- 2.1. Brazil
- 2.2. Argentina
- 2.3. Rest of South America
-
3. Europe
- 3.1. United Kingdom
- 3.2. Germany
- 3.3. France
- 3.4. Italy
- 3.5. Spain
- 3.6. Russia
- 3.7. Benelux
- 3.8. Nordics
- 3.9. Rest of Europe
-
4. Middle East & Africa
- 4.1. Turkey
- 4.2. Israel
- 4.3. GCC
- 4.4. North Africa
- 4.5. South Africa
- 4.6. Rest of Middle East & Africa
-
5. Asia Pacific
- 5.1. China
- 5.2. India
- 5.3. Japan
- 5.4. South Korea
- 5.5. ASEAN
- 5.6. Oceania
- 5.7. Rest of Asia Pacific

Driver State Monitoring Systems Regional Market Share
Geographic Coverage of Driver State Monitoring Systems
Driver State Monitoring Systems REPORT HIGHLIGHTS
| Aspects | Details |
|---|---|
| Study Period | 2020-2034 |
| Base Year | 2025 |
| Estimated Year | 2026 |
| Forecast Period | 2026-2034 |
| Historical Period | 2020-2025 |
| Growth Rate | CAGR of XX% from 2020-2034 |
| Segmentation |
|
Table of Contents
- 1. Introduction
- 1.1. Research Scope
- 1.2. Market Segmentation
- 1.3. Research Methodology
- 1.4. Definitions and Assumptions
- 2. Executive Summary
- 2.1. Introduction
- 3. Market Dynamics
- 3.1. Introduction
- 3.2. Market Drivers
- 3.3. Market Restrains
- 3.4. Market Trends
- 4. Market Factor Analysis
- 4.1. Porters Five Forces
- 4.2. Supply/Value Chain
- 4.3. PESTEL analysis
- 4.4. Market Entropy
- 4.5. Patent/Trademark Analysis
- 5. Global Driver State Monitoring Systems Analysis, Insights and Forecast, 2020-2032
- 5.1. Market Analysis, Insights and Forecast - by Application
- 5.1.1. Passenger Car
- 5.1.2. LCV
- 5.1.3. HCV
- 5.2. Market Analysis, Insights and Forecast - by Types
- 5.2.1. Heart Rate Monitoring
- 5.2.2. Facial Recognition
- 5.2.3. Others
- 5.3. Market Analysis, Insights and Forecast - by Region
- 5.3.1. North America
- 5.3.2. South America
- 5.3.3. Europe
- 5.3.4. Middle East & Africa
- 5.3.5. Asia Pacific
- 5.1. Market Analysis, Insights and Forecast - by Application
- 6. North America Driver State Monitoring Systems Analysis, Insights and Forecast, 2020-2032
- 6.1. Market Analysis, Insights and Forecast - by Application
- 6.1.1. Passenger Car
- 6.1.2. LCV
- 6.1.3. HCV
- 6.2. Market Analysis, Insights and Forecast - by Types
- 6.2.1. Heart Rate Monitoring
- 6.2.2. Facial Recognition
- 6.2.3. Others
- 6.1. Market Analysis, Insights and Forecast - by Application
- 7. South America Driver State Monitoring Systems Analysis, Insights and Forecast, 2020-2032
- 7.1. Market Analysis, Insights and Forecast - by Application
- 7.1.1. Passenger Car
- 7.1.2. LCV
- 7.1.3. HCV
- 7.2. Market Analysis, Insights and Forecast - by Types
- 7.2.1. Heart Rate Monitoring
- 7.2.2. Facial Recognition
- 7.2.3. Others
- 7.1. Market Analysis, Insights and Forecast - by Application
- 8. Europe Driver State Monitoring Systems Analysis, Insights and Forecast, 2020-2032
- 8.1. Market Analysis, Insights and Forecast - by Application
- 8.1.1. Passenger Car
- 8.1.2. LCV
- 8.1.3. HCV
- 8.2. Market Analysis, Insights and Forecast - by Types
- 8.2.1. Heart Rate Monitoring
- 8.2.2. Facial Recognition
- 8.2.3. Others
- 8.1. Market Analysis, Insights and Forecast - by Application
- 9. Middle East & Africa Driver State Monitoring Systems Analysis, Insights and Forecast, 2020-2032
- 9.1. Market Analysis, Insights and Forecast - by Application
- 9.1.1. Passenger Car
- 9.1.2. LCV
- 9.1.3. HCV
- 9.2. Market Analysis, Insights and Forecast - by Types
- 9.2.1. Heart Rate Monitoring
- 9.2.2. Facial Recognition
- 9.2.3. Others
- 9.1. Market Analysis, Insights and Forecast - by Application
- 10. Asia Pacific Driver State Monitoring Systems Analysis, Insights and Forecast, 2020-2032
- 10.1. Market Analysis, Insights and Forecast - by Application
- 10.1.1. Passenger Car
- 10.1.2. LCV
- 10.1.3. HCV
- 10.2. Market Analysis, Insights and Forecast - by Types
- 10.2.1. Heart Rate Monitoring
- 10.2.2. Facial Recognition
- 10.2.3. Others
- 10.1. Market Analysis, Insights and Forecast - by Application
- 11. Competitive Analysis
- 11.1. Global Market Share Analysis 2025
- 11.2. Company Profiles
- 11.2.1 Continental
- 11.2.1.1. Overview
- 11.2.1.2. Products
- 11.2.1.3. SWOT Analysis
- 11.2.1.4. Recent Developments
- 11.2.1.5. Financials (Based on Availability)
- 11.2.2 Robert Bosch
- 11.2.2.1. Overview
- 11.2.2.2. Products
- 11.2.2.3. SWOT Analysis
- 11.2.2.4. Recent Developments
- 11.2.2.5. Financials (Based on Availability)
- 11.2.3 ZF TRW
- 11.2.3.1. Overview
- 11.2.3.2. Products
- 11.2.3.3. SWOT Analysis
- 11.2.3.4. Recent Developments
- 11.2.3.5. Financials (Based on Availability)
- 11.2.4 Aptiv
- 11.2.4.1. Overview
- 11.2.4.2. Products
- 11.2.4.3. SWOT Analysis
- 11.2.4.4. Recent Developments
- 11.2.4.5. Financials (Based on Availability)
- 11.2.5 Delphi Automotive
- 11.2.5.1. Overview
- 11.2.5.2. Products
- 11.2.5.3. SWOT Analysis
- 11.2.5.4. Recent Developments
- 11.2.5.5. Financials (Based on Availability)
- 11.2.6 Aisin Seiki
- 11.2.6.1. Overview
- 11.2.6.2. Products
- 11.2.6.3. SWOT Analysis
- 11.2.6.4. Recent Developments
- 11.2.6.5. Financials (Based on Availability)
- 11.2.7 Denso
- 11.2.7.1. Overview
- 11.2.7.2. Products
- 11.2.7.3. SWOT Analysis
- 11.2.7.4. Recent Developments
- 11.2.7.5. Financials (Based on Availability)
- 11.2.8 Mobileye NV
- 11.2.8.1. Overview
- 11.2.8.2. Products
- 11.2.8.3. SWOT Analysis
- 11.2.8.4. Recent Developments
- 11.2.8.5. Financials (Based on Availability)
- 11.2.9 Visteon
- 11.2.9.1. Overview
- 11.2.9.2. Products
- 11.2.9.3. SWOT Analysis
- 11.2.9.4. Recent Developments
- 11.2.9.5. Financials (Based on Availability)
- 11.2.10 Tobii Technology
- 11.2.10.1. Overview
- 11.2.10.2. Products
- 11.2.10.3. SWOT Analysis
- 11.2.10.4. Recent Developments
- 11.2.10.5. Financials (Based on Availability)
- 11.2.11 Valeo
- 11.2.11.1. Overview
- 11.2.11.2. Products
- 11.2.11.3. SWOT Analysis
- 11.2.11.4. Recent Developments
- 11.2.11.5. Financials (Based on Availability)
- 11.2.12 Seeing MACHINE
- 11.2.12.1. Overview
- 11.2.12.2. Products
- 11.2.12.3. SWOT Analysis
- 11.2.12.4. Recent Developments
- 11.2.12.5. Financials (Based on Availability)
- 11.2.13 Ficosa International
- 11.2.13.1. Overview
- 11.2.13.2. Products
- 11.2.13.3. SWOT Analysis
- 11.2.13.4. Recent Developments
- 11.2.13.5. Financials (Based on Availability)
- 11.2.1 Continental
List of Figures
- Figure 1: Global Driver State Monitoring Systems Revenue Breakdown (million, %) by Region 2025 & 2033
- Figure 2: North America Driver State Monitoring Systems Revenue (million), by Application 2025 & 2033
- Figure 3: North America Driver State Monitoring Systems Revenue Share (%), by Application 2025 & 2033
- Figure 4: North America Driver State Monitoring Systems Revenue (million), by Types 2025 & 2033
- Figure 5: North America Driver State Monitoring Systems Revenue Share (%), by Types 2025 & 2033
- Figure 6: North America Driver State Monitoring Systems Revenue (million), by Country 2025 & 2033
- Figure 7: North America Driver State Monitoring Systems Revenue Share (%), by Country 2025 & 2033
- Figure 8: South America Driver State Monitoring Systems Revenue (million), by Application 2025 & 2033
- Figure 9: South America Driver State Monitoring Systems Revenue Share (%), by Application 2025 & 2033
- Figure 10: South America Driver State Monitoring Systems Revenue (million), by Types 2025 & 2033
- Figure 11: South America Driver State Monitoring Systems Revenue Share (%), by Types 2025 & 2033
- Figure 12: South America Driver State Monitoring Systems Revenue (million), by Country 2025 & 2033
- Figure 13: South America Driver State Monitoring Systems Revenue Share (%), by Country 2025 & 2033
- Figure 14: Europe Driver State Monitoring Systems Revenue (million), by Application 2025 & 2033
- Figure 15: Europe Driver State Monitoring Systems Revenue Share (%), by Application 2025 & 2033
- Figure 16: Europe Driver State Monitoring Systems Revenue (million), by Types 2025 & 2033
- Figure 17: Europe Driver State Monitoring Systems Revenue Share (%), by Types 2025 & 2033
- Figure 18: Europe Driver State Monitoring Systems Revenue (million), by Country 2025 & 2033
- Figure 19: Europe Driver State Monitoring Systems Revenue Share (%), by Country 2025 & 2033
- Figure 20: Middle East & Africa Driver State Monitoring Systems Revenue (million), by Application 2025 & 2033
- Figure 21: Middle East & Africa Driver State Monitoring Systems Revenue Share (%), by Application 2025 & 2033
- Figure 22: Middle East & Africa Driver State Monitoring Systems Revenue (million), by Types 2025 & 2033
- Figure 23: Middle East & Africa Driver State Monitoring Systems Revenue Share (%), by Types 2025 & 2033
- Figure 24: Middle East & Africa Driver State Monitoring Systems Revenue (million), by Country 2025 & 2033
- Figure 25: Middle East & Africa Driver State Monitoring Systems Revenue Share (%), by Country 2025 & 2033
- Figure 26: Asia Pacific Driver State Monitoring Systems Revenue (million), by Application 2025 & 2033
- Figure 27: Asia Pacific Driver State Monitoring Systems Revenue Share (%), by Application 2025 & 2033
- Figure 28: Asia Pacific Driver State Monitoring Systems Revenue (million), by Types 2025 & 2033
- Figure 29: Asia Pacific Driver State Monitoring Systems Revenue Share (%), by Types 2025 & 2033
- Figure 30: Asia Pacific Driver State Monitoring Systems Revenue (million), by Country 2025 & 2033
- Figure 31: Asia Pacific Driver State Monitoring Systems Revenue Share (%), by Country 2025 & 2033
List of Tables
- Table 1: Global Driver State Monitoring Systems Revenue million Forecast, by Application 2020 & 2033
- Table 2: Global Driver State Monitoring Systems Revenue million Forecast, by Types 2020 & 2033
- Table 3: Global Driver State Monitoring Systems Revenue million Forecast, by Region 2020 & 2033
- Table 4: Global Driver State Monitoring Systems Revenue million Forecast, by Application 2020 & 2033
- Table 5: Global Driver State Monitoring Systems Revenue million Forecast, by Types 2020 & 2033
- Table 6: Global Driver State Monitoring Systems Revenue million Forecast, by Country 2020 & 2033
- Table 7: United States Driver State Monitoring Systems Revenue (million) Forecast, by Application 2020 & 2033
- Table 8: Canada Driver State Monitoring Systems Revenue (million) Forecast, by Application 2020 & 2033
- Table 9: Mexico Driver State Monitoring Systems Revenue (million) Forecast, by Application 2020 & 2033
- Table 10: Global Driver State Monitoring Systems Revenue million Forecast, by Application 2020 & 2033
- Table 11: Global Driver State Monitoring Systems Revenue million Forecast, by Types 2020 & 2033
- Table 12: Global Driver State Monitoring Systems Revenue million Forecast, by Country 2020 & 2033
- Table 13: Brazil Driver State Monitoring Systems Revenue (million) Forecast, by Application 2020 & 2033
- Table 14: Argentina Driver State Monitoring Systems Revenue (million) Forecast, by Application 2020 & 2033
- Table 15: Rest of South America Driver State Monitoring Systems Revenue (million) Forecast, by Application 2020 & 2033
- Table 16: Global Driver State Monitoring Systems Revenue million Forecast, by Application 2020 & 2033
- Table 17: Global Driver State Monitoring Systems Revenue million Forecast, by Types 2020 & 2033
- Table 18: Global Driver State Monitoring Systems Revenue million Forecast, by Country 2020 & 2033
- Table 19: United Kingdom Driver State Monitoring Systems Revenue (million) Forecast, by Application 2020 & 2033
- Table 20: Germany Driver State Monitoring Systems Revenue (million) Forecast, by Application 2020 & 2033
- Table 21: France Driver State Monitoring Systems Revenue (million) Forecast, by Application 2020 & 2033
- Table 22: Italy Driver State Monitoring Systems Revenue (million) Forecast, by Application 2020 & 2033
- Table 23: Spain Driver State Monitoring Systems Revenue (million) Forecast, by Application 2020 & 2033
- Table 24: Russia Driver State Monitoring Systems Revenue (million) Forecast, by Application 2020 & 2033
- Table 25: Benelux Driver State Monitoring Systems Revenue (million) Forecast, by Application 2020 & 2033
- Table 26: Nordics Driver State Monitoring Systems Revenue (million) Forecast, by Application 2020 & 2033
- Table 27: Rest of Europe Driver State Monitoring Systems Revenue (million) Forecast, by Application 2020 & 2033
- Table 28: Global Driver State Monitoring Systems Revenue million Forecast, by Application 2020 & 2033
- Table 29: Global Driver State Monitoring Systems Revenue million Forecast, by Types 2020 & 2033
- Table 30: Global Driver State Monitoring Systems Revenue million Forecast, by Country 2020 & 2033
- Table 31: Turkey Driver State Monitoring Systems Revenue (million) Forecast, by Application 2020 & 2033
- Table 32: Israel Driver State Monitoring Systems Revenue (million) Forecast, by Application 2020 & 2033
- Table 33: GCC Driver State Monitoring Systems Revenue (million) Forecast, by Application 2020 & 2033
- Table 34: North Africa Driver State Monitoring Systems Revenue (million) Forecast, by Application 2020 & 2033
- Table 35: South Africa Driver State Monitoring Systems Revenue (million) Forecast, by Application 2020 & 2033
- Table 36: Rest of Middle East & Africa Driver State Monitoring Systems Revenue (million) Forecast, by Application 2020 & 2033
- Table 37: Global Driver State Monitoring Systems Revenue million Forecast, by Application 2020 & 2033
- Table 38: Global Driver State Monitoring Systems Revenue million Forecast, by Types 2020 & 2033
- Table 39: Global Driver State Monitoring Systems Revenue million Forecast, by Country 2020 & 2033
- Table 40: China Driver State Monitoring Systems Revenue (million) Forecast, by Application 2020 & 2033
- Table 41: India Driver State Monitoring Systems Revenue (million) Forecast, by Application 2020 & 2033
- Table 42: Japan Driver State Monitoring Systems Revenue (million) Forecast, by Application 2020 & 2033
- Table 43: South Korea Driver State Monitoring Systems Revenue (million) Forecast, by Application 2020 & 2033
- Table 44: ASEAN Driver State Monitoring Systems Revenue (million) Forecast, by Application 2020 & 2033
- Table 45: Oceania Driver State Monitoring Systems Revenue (million) Forecast, by Application 2020 & 2033
- Table 46: Rest of Asia Pacific Driver State Monitoring Systems Revenue (million) Forecast, by Application 2020 & 2033
Frequently Asked Questions
1. What is the projected Compound Annual Growth Rate (CAGR) of the Driver State Monitoring Systems?
The projected CAGR is approximately XX%.
2. Which companies are prominent players in the Driver State Monitoring Systems?
Key companies in the market include Continental, Robert Bosch, ZF TRW, Aptiv, Delphi Automotive, Aisin Seiki, Denso, Mobileye NV, Visteon, Tobii Technology, Valeo, Seeing MACHINE, Ficosa International.
3. What are the main segments of the Driver State Monitoring Systems?
The market segments include Application, Types.
4. Can you provide details about the market size?
The market size is estimated to be USD XXX million as of 2022.
5. What are some drivers contributing to market growth?
N/A
6. What are the notable trends driving market growth?
N/A
7. Are there any restraints impacting market growth?
N/A
8. Can you provide examples of recent developments in the market?
N/A
9. What pricing options are available for accessing the report?
Pricing options include single-user, multi-user, and enterprise licenses priced at USD 4900.00, USD 7350.00, and USD 9800.00 respectively.
10. Is the market size provided in terms of value or volume?
The market size is provided in terms of value, measured in million.
11. Are there any specific market keywords associated with the report?
Yes, the market keyword associated with the report is "Driver State Monitoring Systems," which aids in identifying and referencing the specific market segment covered.
12. How do I determine which pricing option suits my needs best?
The pricing options vary based on user requirements and access needs. Individual users may opt for single-user licenses, while businesses requiring broader access may choose multi-user or enterprise licenses for cost-effective access to the report.
13. Are there any additional resources or data provided in the Driver State Monitoring Systems report?
While the report offers comprehensive insights, it's advisable to review the specific contents or supplementary materials provided to ascertain if additional resources or data are available.
14. How can I stay updated on further developments or reports in the Driver State Monitoring Systems?
To stay informed about further developments, trends, and reports in the Driver State Monitoring Systems, consider subscribing to industry newsletters, following relevant companies and organizations, or regularly checking reputable industry news sources and publications.
Methodology
Step 1 - Identification of Relevant Samples Size from Population Database


Step 2 - Approaches for Defining Global Market Size (Value, Volume* & Price*)

Note*: In applicable scenarios
Step 3 - Data Sources
Primary Research
- Web Analytics
- Survey Reports
- Research Institute
- Latest Research Reports
- Opinion Leaders
Secondary Research
- Annual Reports
- White Paper
- Latest Press Release
- Industry Association
- Paid Database
- Investor Presentations

Step 4 - Data Triangulation
Involves using different sources of information in order to increase the validity of a study
These sources are likely to be stakeholders in a program - participants, other researchers, program staff, other community members, and so on.
Then we put all data in single framework & apply various statistical tools to find out the dynamic on the market.
During the analysis stage, feedback from the stakeholder groups would be compared to determine areas of agreement as well as areas of divergence